Key Takeaways from the “State of the Climate in 2023”

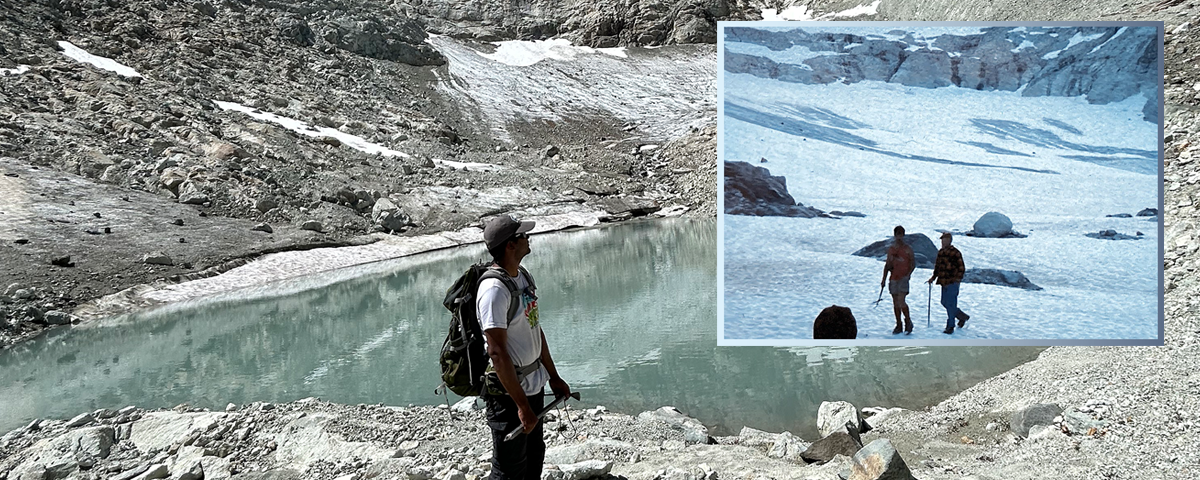
Glacial retreat at ice worm glacier

Earth hit record highs in global temps, greenhouse gases, sea level, and more last year.

By AMS Staff

Last year, global high temperatures, warm oceans, and massive wildfires broke records and sparked increasing concern about climate change. Now the annual State of the Climate report, produced by the National Oceanic and Atmospheric Administration’s National Centers for Environmental Information (NCEI) and peer reviewed and published by the American Meteorological Society, gives us an in-depth global picture of 2023, a year of extremes. 

According to the NOAA/AMS press release, the State of the Climate report this year includes contributions from more than 590 scientists from 59 countries, and “provides the most comprehensive update on Earth’s climate indicators, notable weather events, and other data collected by environmental monitoring stations and instruments located on land, water, ice and in space.”

Below are a few highlights from 2023.

Record-high greenhouse gases (again)

Global atmospheric carbon dioxide, methane, and nitrous oxide all reached higher concentrations than ever recorded. CO2 was 419.3±0.1ppm, 2.8 ppm higher than in 2023 and 50% higher than pre-industrial levels. This is the fourth-largest recorded year-to-year rise in CO2.

Record-high global temperatures

2023 officially beat 2016’s record as the hottest year overall since records began in the 1800s, partly due to the transition from La Niña to a strong El Niño. Globally, 2023 was 0.99°–1.08°F (0.13°–0.17°C) above the 1991–2020 average. The years 2015–2023 have been the hottest nine years on record.
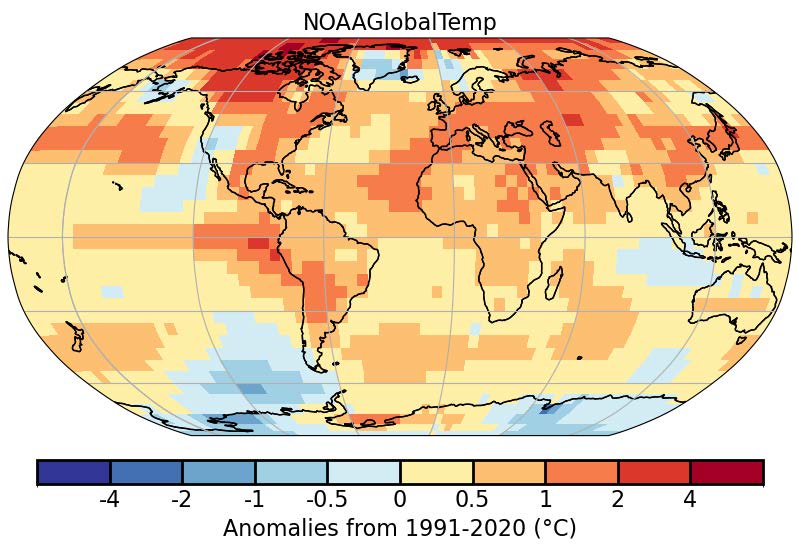
Global Surface Temperatures Were Above Average Across Most of the World (Plate 2.1a in State of the Climate in 2023): During 2023, much-warmer-than-average conditions were observed across most of the world’s surface, with the largest positive temperature anomalies across parts of the higher northern latitudes, shown here as areas shaded from orange to red. Limited areas experienced near-average to cooler-than-average conditions (blue shading). [Note: graphic shows 2023 average temperature anomalies above or below the 1991-2020 average global temperature.]

North America overall experienced its warmest year since records began in 1910, including a heat wave in Mexico that killed 286 people. The Caribbean also experienced its warmest recorded year, and Europe its warmest or second-warmest depending on the analysis.

In Kyoto, Japan, the cherry trees reached peak bloom on March 25, the earliest bloom in the city’s 1,200-year record. Photo: Balazs Simon on Pexels.

Record-high ocean heat

El Niño also contributed to the hottest oceans ever recorded. Mean annual global sea-surface temperature was 0.23°F (0.13°C) higher than 2016’s previous record, and August 22, 2023 saw an all-time high daily mean global sea-surface temperature of 66.18°F (18.99°C). Marine heat waves were recorded on 116 days of 2023 (vs. the previous record of 86 days in 2016) and global ocean heat content down to 2,000 feet also reached record highs.

Record-high sea levels (again)

Global mean sea level rose 8.1±1.5 mm in 2023, to reach a record 101.4 millimeters above the average from 1993, when satellite measurements began.

Massive wildfires caused by heat and drought

37 million acres of Canada burned in 2023, twice the previous record, causing evacuations for more than 232,000 people and with smoke affecting cities as far away as western Europe. Australia experienced its driest August–October since 1900, leading to millions of acres burned in bushfires in the Northern Territory. The European Union experienced its largest wildfire since 2000 (in the Alexandroupolis Municipality of Greece). Notable wildfires also occurred in Brazil, Paraguay, and in the U.S. state of Hawaii.

Warm poles and a greener Arctic

2023 was the fourth warmest year in the Arctic in the 124-year record, and the warmest recorded June–September. Sea ice reached its fifth-lowest extent in the 45-year record (with many monthly and daily records set), and multi-year ice declined. Despite above-average spring snowpack in the North American and Eurasian Arctic, rapid melting led to record and near-record lows in snow-water equivalent by June. The Northern Sea Route and Northwest Passage both opened, and the Northwest Passage saw a record 42 ship transits. Arctic tundra vegetation reached its third-greenest peak in the 24-year record. 

Much of Antarctica also experienced well-above-average heat. In addition, eight months, and 278 days, saw record lows in sea ice extent and area in Antarctica; daily sea ice extent on 21 February was the lowest ever recorded.
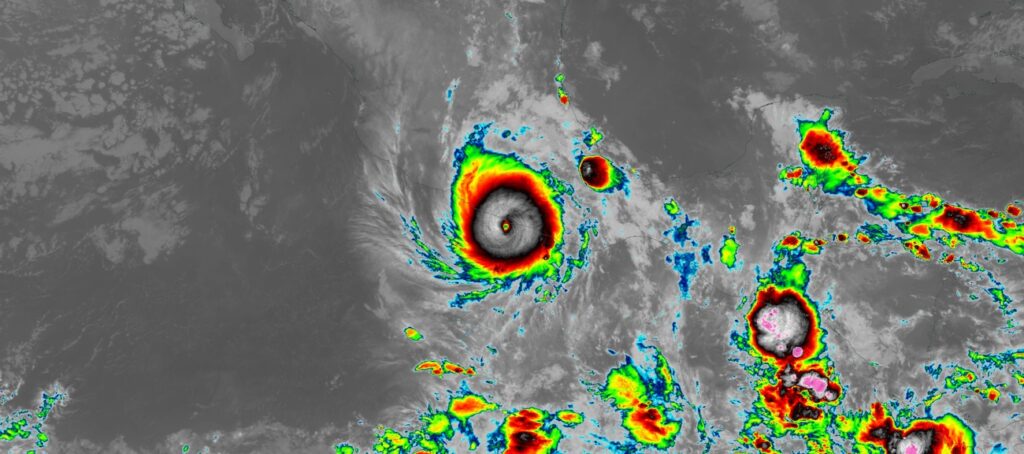
Clean infrared image of Hurricane Otis making landfall near Acapulco, Mexico. Image captured on 25 October, 2023, at 5:20 UTC, by the ABI instrument aboard the GOES-East satellite. Source: NASA Worldview.

Below-average tropical cyclone activity, yet notable storms

There were 82 named tropical storms in 2023, below average. However, global accumulated cyclone energy was above average, rebounding from 2022’s record low, and there were seven Category 5 cyclones. Tropical Cyclone Freddy became the longest lived tropical cyclone on record, lasting from February 6 to March 12; it made landfall three times and caused 165 fatalities in Mozambique and 679 fatalities in Malawi due to flooding and landslides. Typhoon Doksuri/Egay was the costliest economically, causing US$18.4 billion in damages; Beijing saw its heaviest recorded rainfall and 137 residents died in flooding. Rain and floods from Storm Daniel killed at least 4,300 people in Libya. Hurricane Otis underwent the most extreme rapid intensification on record—Category 1 to Category 5 in only nine hours—and became the strongest landfalling hurricane to hit western Mexico, devastating Acapulco.

Persistent ozone hole

The stratospheric ozone hole over Antarctica appeared earlier in the year and lasted longer than normal, and reached its 16th largest extent in 44 years.

The full State of the Climate report includes regional climate breakdowns and notable events in every part of the world. Read the full 2023 report here. Read a summary of key takeaways here.

Image at top: Ice Worm Glacier in the North Cascade mountains of Washington, United States, which was under continuous annual monitoring from 1984 onward and disappeared in 2023. Large photo: The location of former Ice Worm Glacier on 13 August 2023. Inset photo: Ice Worm Glacier on 16 August 1986. Photo credits Mauri Pelto.
Recent Trends in Tropical Cyclone Fatalities in the United States

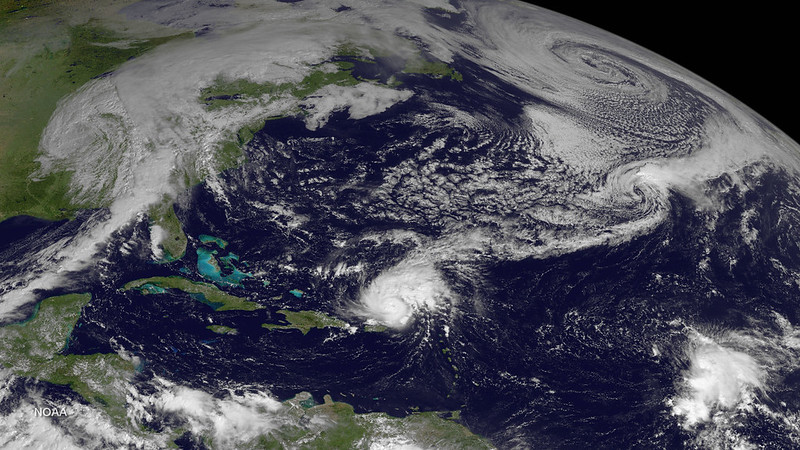
Satellite photo of Hurricane Gonzalo (a ball of swirling clouds) over the Atlantic near Puerto Rico; other larger cloud systems are seen in the upper part of the photo, eclipsed by the curvature of the Earth in the top right. Photo taken by GOES East satellite at 1445Z on October 14, 2014. Photo credit: NOAA.

New data from the past ten years reveal increased prominence of freshwater floods and indirect fatalities in hurricane deaths

Guest post by Dr. Michael Brennan, Director, National Hurricane Center; Daniel Brown, Warning Coordination Meteorologist, National Hurricane Center; and Leah Pope, Hydrologist, Northwest River Forecast Center

The National Hurricane Center’s mission to “save lives and mitigate property loss” is not just achieved by issuing effective watches, warnings, and forecasts of tropical cyclones. We also spend a large portion of the “offseason” educating the public, emergency managers, and our media partners about the risks that tropical cyclones (TCs), including hurricanes, pose to life and property in the United States. Those include natural hazards such as storm surge, wind, and rip currents, and also includes dangerous conditions in the aftermath of a landfalling tropical cyclone, which may lead to “indirect” fatalities. These are deaths which are not directly due to the forces of the storm, but which would not otherwise have occurred. NHC routinely compiles and assesses TC-related information through vehicles such as our Tropical Cyclone Reports (TCRs). Data from the most recent decade reveal that fatality trends may be changing.  

Note:  The fatality data presented here do not include any fatalities from Hurricane Maria in Puerto Rico, since there was no specific, definitive cause provided for those deaths.

Direct Fatalities

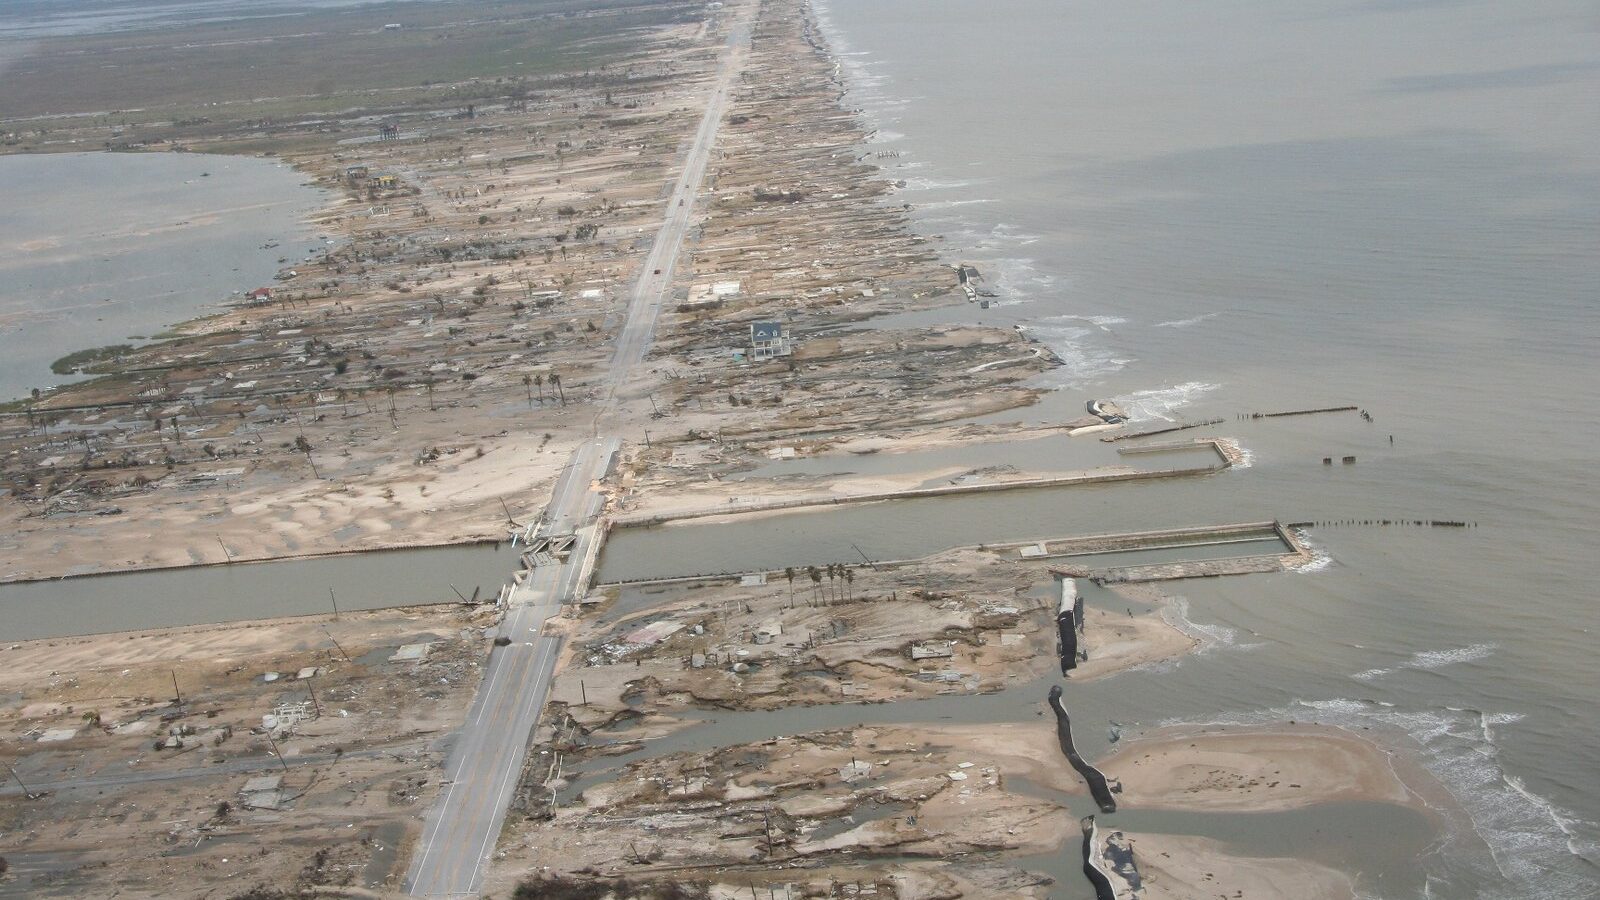
Aerial photo of a peninsula/barrier island that has been breached by a storm surge. Sand, buildings, and other structures have been washed away or damaged, including visible broken lines of sandbags, a damaged bridge, damaged trees, and obliterated buildings; only one house appears to still be standing.
Storm surge damage from Hurricane Ike, Bolivar Peninsula, Texas, 2008. Photo credit: NOAA.

Previous studies by Rappaport (2014) and Rappaport and Blanchard (2016) summarized direct and indirect fatality data from Atlantic basin tropical cyclones in the United States for the 50-year period 1963–2012. During that period, nearly 9 out of 10 tropical cyclone-related direct deaths in the United States were due to water. Storm surge was responsible for nearly half (49%) of the direct deaths, and over one-quarter (27%) were due to rainfall-induced freshwater flooding.  

In response, the National Weather Service (NWS) and NHC worked to improve outreach, education, and communication of storm surge and rainfall hazards. We introduced new real-time storm surge maps in 2014, and in 2017 introduced a storm surge watch/warning that highlights the risk of life-threatening storm surge inundation. 

New Data Suggest Changing Trends

Since 2012, the United States has experienced 21 hurricane landfalls, including 8 major hurricanes, and more than 20 tropical storm landfalls. Eighteen of these hurricane landfalls, including all of the major hurricanes, occurred during 2017–22 after a relatively quiet period. Given the significant number of tropical cyclone landfalls in recent years, and increased deployment of warnings around the storm surge hazard, NHC examined and compared fatality data from the most recent 10-year period (2013–22) to the earlier studies.

Hazard % of direct fatalities from this cause
(1963–2012)
% of direct fatalities from this cause
(2013–2022)
Storm Surge49%11%
Freshwater Flooding27%57%
Wind8%12%
Surf/Rip Currents6%15%
Offshore Marine Incidents6%3%
Tornadoes3%2%
Other1%1%
Note: Due to rounding, numbers may not add up to 100%.

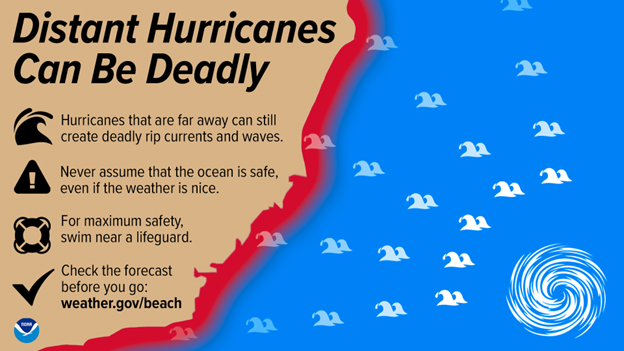
During the most recent 10-year period in the United States, about 57% of direct tropical cyclone deaths were due to drowning from freshwater (rainfall) flooding. Surf and rip current fatalities have become an increasing threat, making up about 15% of direct fatalities in the past decade. These fatalities often occur one or two at a time from distant storms hundreds of miles offshore. Florida, North Carolina, and New Jersey experienced the highest number of TC-related surf and rip current fatalities. Storm surge and wind-related deaths account for 11% and 12% of the direct fatalities, respectively.  

Every hurricane is different, however. Hurricane Harvey in 2017 had the largest number of direct deaths—68, 65 of which were due to freshwater flooding in Texas—in the past decade. Hurricane Ian (2022) was the second deadliest with 66 direct fatalities, 41 of which were due to storm surge in Florida. More than 65% of those who died from direct causes were men, with about 60% of the victims over the age of 60.

Indirect Causes

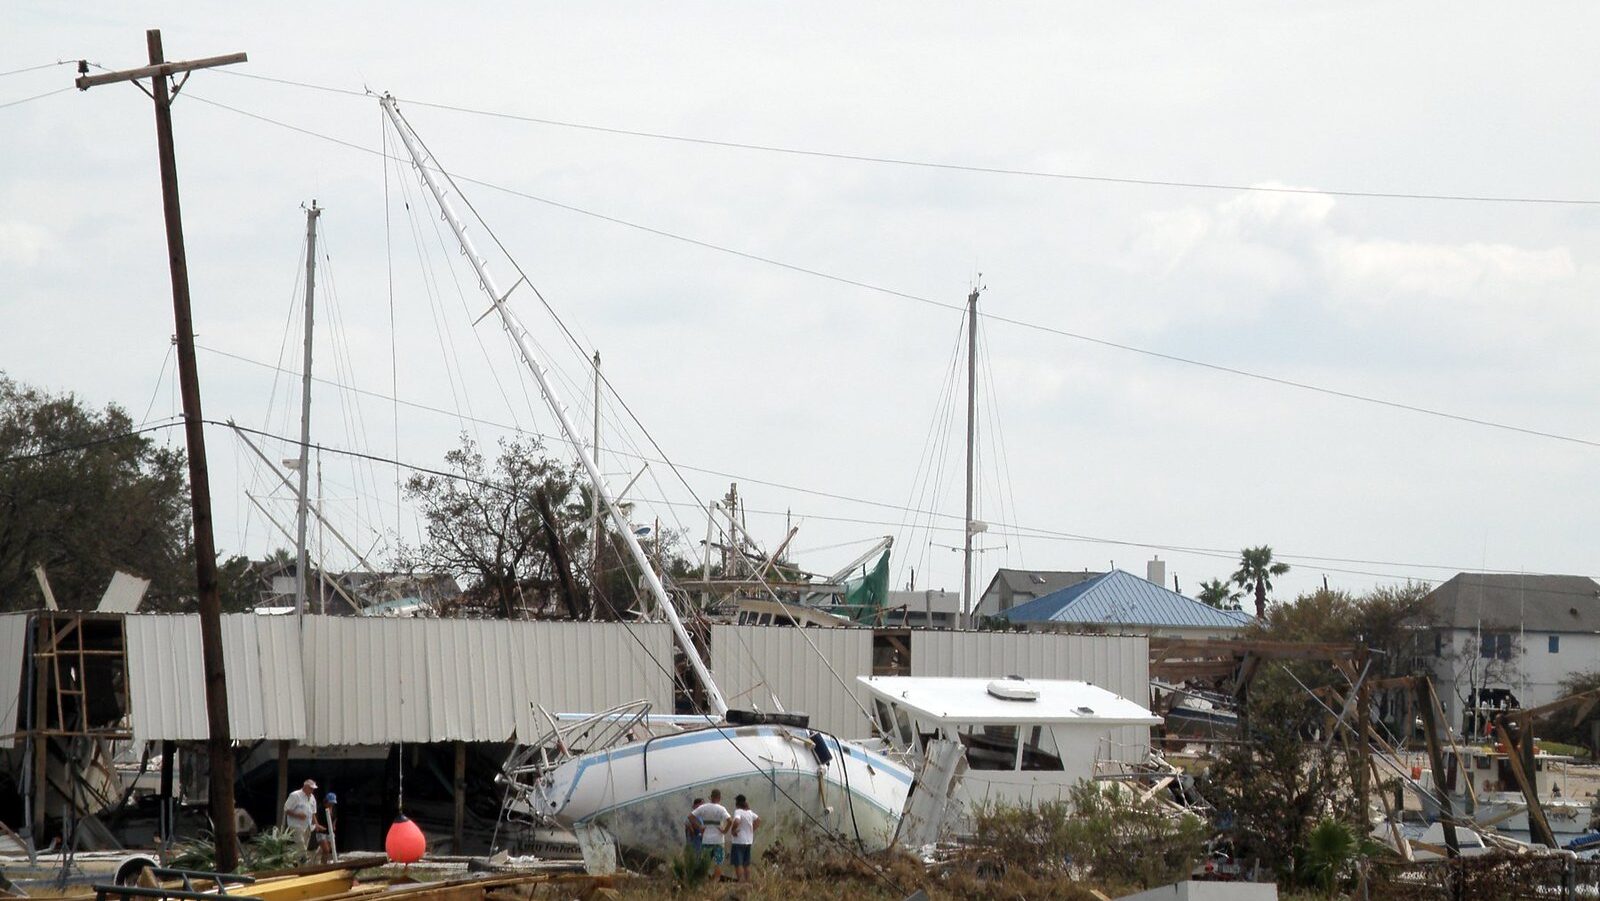
Image of a boat stranded on land, leaning against a wind-destroyed structure and a power line, amid other debris, including destroyed buildings and cars. Three people stand next to the boat observing the damage.
Aftermath of Hurricane Ike in Galveston, Texas, 2008. Photo credit: NOAA.

The recent study revealed that over the past 10 years there has been nearly an equal number of indirect deaths as direct fatalities. Indirect fatalities are due to a wide range of causes, including traffic accidents (16%), preparation/cleanup accidents (15%), carbon monoxide poisoning (12%), lack of medical care (11%), power problem/electrocution (11%), post-storm heat deaths (9%), unknown causes (9%), cardiac-related deaths (7%), and evacuation-related deaths (5%). 

The largest number of indirect deaths in the past decade occurred in association with Hurricanes Ian (90), Irma (82), Michael (43), Harvey (35), and Laura (34). Most (75%) of the indirect deaths are associated with major hurricane landfalls, which leave communities very vulnerable and often with long-duration, widespread power outages. More than half (57%) of the victims were over the age of 60. Younger victims tended to die in vehicle accidents; for older victims, medical-related issues, heat, evacuation, and other accidents were more likely causes of death.

Improving Warnings and Public Understanding

The results of these most recent studies have led the NWS and NHC to increase messaging on the hazards and causes of both direct and indirect fatalities. We continue to highlight rainfall flooding and storm surge risk through the Weather Prediction Center’s Excessive Rainfall Outlook, Flood Warnings from local NWS offices, and increased emphasis on the Storm Surge Warning. These warnings are the loudest “bells” that the NWS can ring during life-threatening flooding. We encourage our media and emergency management partners to work with us to encourage timely public response and personal preparedness ahead of these threats. 

Additionally, with the increased percentage of rip current fatalities associated with high surf and swells from distant hurricanes, the NWS has created new infographics to explain this deadly beach hazard, and is working on graphics to better highlight the threat in real time.

During the highly impactful 2020 hurricane season in the United States, there were more fatalities associated with carbon monoxide poisoning from the improper use of generators than there were from storm surge. After that season, NHC and the NWS developed infographics and worked with media and emergency management partners to highlight that threat. While it is difficult to determine the effectiveness of that messaging, it is encouraging to know that there were no carbon monoxide related-fatalities in the aftermath of Hurricane Ian in 2022 in Florida, despite its devastating impacts and widespread power outages in that state.   

NHC relies on relationships with media, emergency management partners, and the entire weather enterprise to help reach the public before, during, and after tropical cyclone threats. These efforts undoubtedly increase awareness, encourage preparation, and save lives. We hope to continue to improve our messaging and understanding of the threats and causes of injuries and fatalities to better meet our collective mission.  

Visit the National Hurricane Center online.

Header photo: Hurricane Gonzalo in the Atlantic. Photo taken by GOES East satellite at 1445Z on October 14, 2014. Photo credit: NOAA.

This post was invited based on a presentation given by Dr. Brennan at the 50th Conference on Broadcast Meteorology, which took place in Phoenix, Arizona, June 21–23, 2023. The conference was organized by the American Meteorological Society Board on Broadcast Meteorology and chaired by Danielle Breezy and Vanessa Alonso.

Improving Tropical Cyclone Forecasts

Tropical cyclones are usually associated with bad news, but a long-term study about these storms now posted online for publication in BAMS has some good news–about the forecasts, at least. The authors, a Japanese group lead by Munehiko Yamaguchi, studied operational global numerical model forecasts of tropical cyclones since 1991.
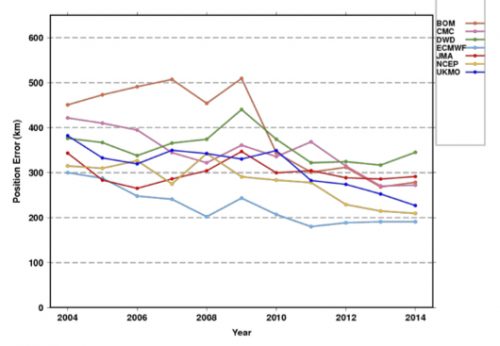
Their finding: the model forecasts of storm positions have improved in the last 25 years. In the Western North Pacific, for example, lead time is two-and-a-half days better. Across the globe, errors in 1 – 5 day forecasts dipped by 6 to 14.5 km, depending on the basin.
Here are the improvements for the globe as a whole. Each line is a different modeling center:
CycloneForecastsGlobal
While position forecasts with a single model are getting better (not so much with intensity forecasts), it seems natural that the use of a consensus of the best models could improve results even more. But Yamaguchi et al. say that’s not true in every ocean basin. The result is not enhanced in the Southern Indian Ocean, for example. The authors explain:

This would be due to the fact that the difference of the position errors of the best three NWP centers is large rather than comparable with each other and thus limits the impact of a consensus approach.

The authors point towards ways to improve tropical cyclone track forecasts, because not all storms behave the same:

while the mean error is decreasing, there still exist many cases in which the errors are extremely large. In other words, there is still a potential to further reduce the annual average TC position errors by reducing the number of such large-error cases.

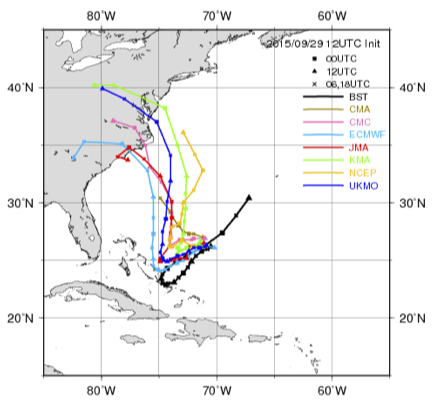
For example, take 5-day track forecasts for Hurricane Joaquin in 2015. Hard to find a useful consensus here (the black line is the eventual track):
JoaquinForecast
Yamaguchi et al. note that these are types of situations that warrant more study, and might yield the next leaps in improvement. They note that the range of forecast possibilities now mapped as a “cone of uncertainty” could be improved by adapting to specific situations:

For straight tracks, 90% of the cyclonic disturbances would lie within the cone, but only 39% of the recurving or looping tracks would be within the cone. Thus a situation-dependent track forecast confidence display would be clearly more appropriate.

Check out the article for more of Yamaguchi et al.’s global perspective on how tropical cyclone forecasts have improved, and could continue to improve.

Survivors Meet the Storm

As  Typhoon Hagupit (Ruby) headed their way this weekend, Filipinos began to show they were a people far too experienced in the ways of typhoons.
Anxiety mixed with prudence. 500,000 people evacuated to safer quarters. Many residents of Tacloban–the city hardest hit by last year’s disastrous Typhoon Haiyan—took shelter in the local stadium. Others stocked up with food and other supplies. The city’s deputy mayor told the BBC, “It’s stirring up a lot of emotions in our hearts and bringing back so many painful memories.”
Those who study severe weather warnings are increasingly noticing this phenomenon: whether by fear or familiarity, people with prior experience have a peculiarly complex reaction to impending severe weather.
For example, a succession of well predicted tornadoes hit central Oklahoma within a short span in May 2013. During the third outbreak of that period, public reaction went awry. Before meteorologists could warn of the dangers of fleeing by car, residents hit the roads and caused potentially catastrophic traffic jams. The spontaneous evacuation, unlike any seen previously for a tornado, exposed the public to great risks.
In a paper to be presented at the AMS Annual Meeting next month at the Phoenix Convention Center (Wednesday, 7 January, 11:15 a.m., Room 226AB), Julia Ross and colleagues will analyze the effects of experience on the public’s “freak out” response to these tornadoes.
Quoting a recent paper by Silver and Andrey in the AMS journal, Weather, Climate, and Society, Ross et al. note that direct experience with hazards amplifies risk perception.  But their survey results show both reasoned and fear-driven reactions to the warnings—and possibly some regionally specific preferences as well.
(In the presentation to follow Ross et al. at the Annual Meeting, Lisa Dilling and colleagues analyze the opposite of a wary, seasoned public. They report on the effect of surprise in the Boulder, Colorado, floods last year.)
If anyone knows typhoons, it’s the people of the Philippines. Supertyphoon Haiyan, which killed 7,000 a year ago, was but one of six different tropical cyclones that have killed more than 1,000 Filipinos in the past decade.
This time around authorities say they’re aiming for zero casualties. But there’s more than just anxiety to deal with. It takes time to rebuild from a blow like Haiyan. A Haiyan survivor in Tacloban told the Associated Press, “I’m scared. “I’m praying to God not to let another disaster strike us again. We haven’t recovered from the first.”
 

Time to Heed the Hurricane Season Forecast?

With this year’s Atlantic hurricane season getting underway, seasonal forecasts are collectively calling for a quieter-than-usual year in the Atlantic basin, which includes the Caribbean Sea and Gulf of Mexico. With busts in these forecasts as recent as last year, however, is this actually reassuring news?
Mark Powell, a NOAA hurricane researcher who is now working with Florida State University’s Center for Ocean-Atmospheric Prediction Studies, was quoted in a recent Palm Beach Daily News article saying such forecasts, which typically are made before the start of the six-month season, “just don’t have any skill this early.”
They practically don’t. The major players of Atlantic hurricane season forecasts—NOAA, Colorado State University (CSU), and the private British forecasting firm Tropical Storm Risk (TSR)—stipulate that there is only a small increase in skill with pre-season forecasts (i.e., how much better such forecasts are) compared to climatology in foretelling the number of named storms that will form in the Atlantic basin from June 1 to November 30. Supporting this, a talk by Eric Blake of the National Hurricane Center presented at the 29th AMS Conference on Hurricanes and Tropical Meteorology stated that NOAA’s May forecasts for anticipated numbers of storms and hurricanes are only slightly better than what climatology showed had occurred in the previous five seasons. Forecast skill does increase as the season nears its peak months: August, September, and October, which is when 70 percent of tropical storms and hurricanes form.
But even these “better” mid-season forecasts can be wrong. In 2013, early predictions for an active season remained high as September neared, yet the actual number of named storms (13) and especially hurricanes (just 2) fell short of most forecasts, which had been collectively predicting a blockbuster season with at least seven hurricanes and three major hurricanes. The long-term average number of named storms and hurricanes is 12 and 6, respectively. There wasn’t a single major hurricane sporting winds greater than 110 mph last year, when climatology said there should have been at least three. In a blog post at the end of last year’s season, Jeff Masters of WeatherUnderground.com detailed the reason the forecasts failed: the large-scale atmospheric circulation, which can’t be predicted more than a week or two out and isn’t part of seasonal forecasts, was not conducive to tropical cyclone formation.
In 2012, however, it was, and the opposite occurred. The number of named storms peaked at 19—not only well above average but also the third highest number of storms on record in a single season. Ten of these went on to become hurricanes, exceeding most seasonal forecasts including NOAA’s, which had called for an average Atlantic hurricane season prior to its start. CSU had projected in June of that year a relatively quiet hurricane season with 13 named storms and only 5 hurricanes. With twice that many hurricanes forming, the season blew the forecast out of the water, making it CSU’s worst bust in decades of predictions. Until 2013.
This year, however, hurricane season forecasters feel the chance of the development of El Niño by the fall is much higher than it was in 2012—70 percent this summer increasing to 80 percent by fall, according to NOAA’s 9 June El Niño status statement—which lends significant weight to the lower hurricane predictions.
Historically, El Niño stifles Atlantic hurricanes. The enormous slug of warmer-than-normal sea surface temperatures along the Eastern Pacific equator, which defines El Niño, imparts a shift in the atmosphere’s circulation that drives unusually strong winds at high altitudes across the tropical Atlantic Ocean during the season. The induced wind shear—a difference in both speed and direction between the surface and aloft—suppresses not only tropical cyclone development but also formation, tearing apart hurricane seedlings before they can organize.
Research in recent years (Journal of Climate: 2009, 2013), however, has shown that a very different effect can result from El Niño’s half-brother – an anomalous warming in the tropical Pacific that pools in the central rather than the eastern part of the ocean basin. When this occurs, as it did in 2004, it can actually amplify the Atlantic hurricane season. That year, four hurricanes—three of them major, including Charley with 150 mph winds—slammed Florida. There were 15 named storms that year.
No forecasters expect a repeat of the devastating 2004 hurricane season. But, already we’ve had a record eight hurricane seasons without landfall of a major hurricane in the United States nor any category hurricane striking Florida. The last one was Wilma in 2005, which hit as a major hurricane.
Whether or not forecasts are accurate this early in the season, the old adage still applies: it only takes one hurricane in your area to create disaster. So be prepared.

The Storm That Started a Drought?

by Robert V. Sobczak, National Park Service, Big Cypress National Preserve.
Reposted from his blog, The South Florida Watershed Journal.
Do all storms end with drought?
I know you’re thinking. I mean the opposite instead:
That “all droughts end with a flood,” right?

Deer Creek
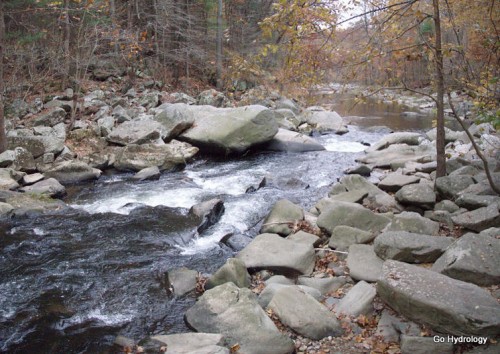
Deer Creek, Maryland at low-water autumn ebb.

A meteorologist in the snow-bound climes of the Red River Basin introduced me to the latter saying. To what degree it holds any statistical truth I cannot say. My initial gut reaction was that an observational bias was in play, plus some seasonal slight of hand. But no matter how much I tried to deny it, the saying kept sneaking up on me wherever I roamed.
Take Tropical Depression Nicole for example. It threatened to make our already high-water rendition of the Big Cypress Swamp all the more wetter but by the flap of the wings of the butterfly bypassed to the east and then onward north to the Atlantic Coast where it drenched those watersheds instead.
Now here’s the catch:
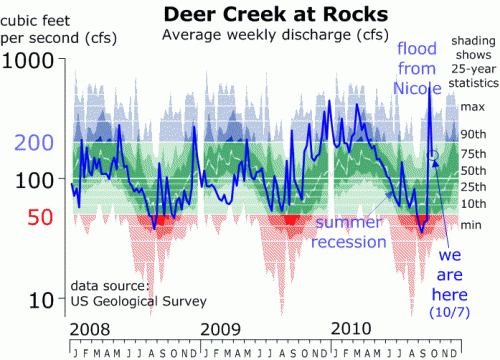
Those watersheds were at the end of their seasonal drought, better known as the summer recession, transforming currents from trickles into torrents overnight.
So yes, chalk one on the board for that old reliable saying!

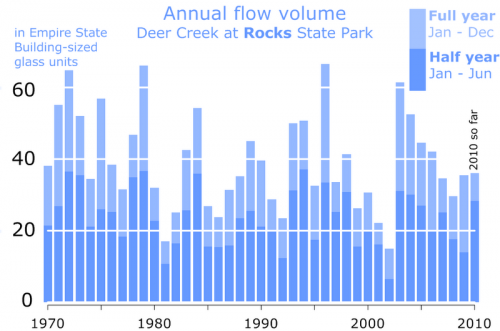
Case in point is Maryland’s Deer Creek, as measured at Rocks State Park (or just “Rocks” as us Harford Countians call it). Thanks to Nicole it now has a chance to top 40 Empire State Buildings (ESBs) worth of water flow for the year. That would make it an above average year, but not a “chart topper,” a term I reserve for the biggest of big flow years which pass 60 or more ESBs worth of water. That’s happened just four times in the modern era (aka my lifetime), the most recent of which (2003) which was, as predicted by that old reliable saying, preceded by the drought of record in 2002 when less than 20 ESBs worth of water flowed through Maryland’s famed Rocks State Park for the year.
Ha, there it is again! So, cherry picking not withstanding, I guess that means that, yes, all drought do seem to end with floods.

Does the same saying apply to the Florida swamps?
Seasonally it happens each year with our winter dry season. By spring the swamps are nearly 100 percent water free and crunchy, just a single lightning strike away from an uncontrollable blaze. But along with the lighting are the thunder that beckon the wet season’s arrival … and the floods that will soon be to follow.
Which brings me back to Nicole:
Instead of flushing flood waters even higher into the swamp it paradoxically reversed the tables by ushering in a week’s worth of dry air in its wake instead.
Meteorologists are calling it an early start to the dry season.

Loop Road near Gator Hook Strand at the wet-season peak.

Or in other words…
Call it the storm that started the drought!

A Slow Start, but Gaining Fast

Tropical Storm Lisa became the 12th named storm in the Atlantic Basin this week in what has suddenly become the active 2010 hurricane season that forecasters months ago had predicted. Nine of those twelve storms formed since August 21, with five of them becoming hurricanes. Before that, only one of the first three named storms (Alex) even reached hurricane strength. By contrast, 2005 (9 out of 28) and 2008 (6 out of 16)  both had numerous storms form before August 20. Why the delay this year? According to a story in Newscientist.com, a mass of hot, dry air over the oceans stunted the formation of tropical storms. Scientists traced this dry air to a massive ridge of high pressure that sat for months over Europe and Asia, causing an intense heatwave in Russia and severe monsoon rains in Pakistan this summer that killed thousands of people. But just as mid-August arrived, when the typical height of Atlantic hurricane activity is imminent, things changed. As the Weather Underground’s Jeff Masters wrote in his blog on August 17:

Vertical instability, which was unusually low since late July, has now returned to near normal levels over the tropical Atlantic, though it remains quite low over the rest of the North Atlantic. Instability is measured as the difference in temperature between the surface and the top of the troposphere (the highest altitude that thunderstorm tops can penetrate to). If the surface is very warm and the top of the troposphere is cold, an unstable atmosphere results, which helps to enhance thunderstorm updrafts and promotes hurricane development. Since SSTs in the Atlantic were at record highs and upper tropospheric temperatures were several degrees cooler than average in July, enhancing instability, something else must have been going on to reduce instability. Dry air can act to reduce instability, and it appears that an unusually dry atmosphere, due to large-scale sinking over the Atlantic, was responsible for the lack of instability.

Not until the heat wave broke near the end of August did the tropical storms really begin to form in earnest, with four storms (Danielle, Earl, Fiona, and Gaston) arising just between August 21 and September 1. And spurred by those record-high SSTs mentioned by Masters, the 2010 season has not only produced 12 named storms and 6 hurricanes, but 5 major hurricanes–four of them Category 4–making that slow start seem like a distant memory. To put this season in historical perspective, there have been yearly averages of 14 named storms, 8 hurricanes, and 4 major hurricanes since the current active Atlantic hurricane period began in 1995. This season is just one major hurricane away from moving into a 7-way tie for 3rd-most major hurricanes in a season, topped only by the 7 major hurricanes in 1961 and 2005 and 8 in 1950 (lists of most active seasons in various categories can be found here).

This photo, taken from the International Space Station, shows the eye of Category-4 Hurricane Igor at 10:56 Atlantic Daylight Time on September 14, 2010, as it advanced over the Atlantic Ocean. (Photo credit: NASA Earth Observatory.)

Inside Earl

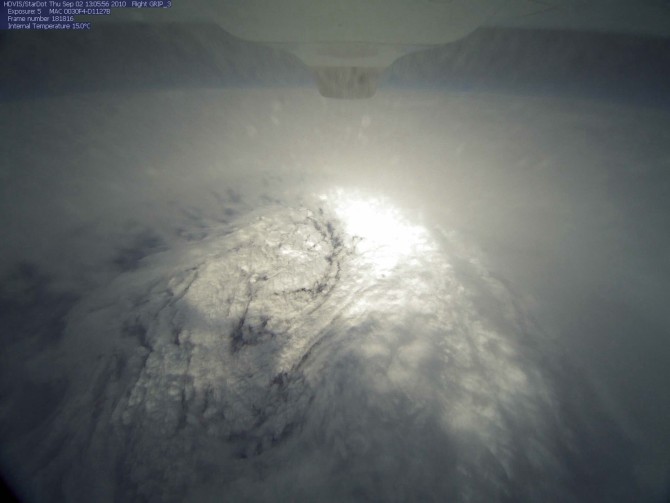
NASA’s GRIP mission (Genesis and Rapid Intensification Processes) is sending aircraft into Hurricane Earl, coming up with some wonderful imagery from almost 20,000 meters above the ocean surface. Here’s how the eye looked from the Global Hawk unmanned aircraft at 9:05 a.m. Eastern, Thursday:

For more on GRIP, Earl, the Global Hawk, and the importance of having drones that can fly up to 26 hours in a single mission, this video interview with Jeff Halverson gives some answers with nice imagery:

Remembering Katrina and New Orleans

by William Hooke, AMS Policy Program Director, from the AMS project, Living on the Real World

“…we can not dedicate, we can not consecrate – we can not hallow – this ground. The brave men, living and dead, who struggled here, have consecrated it far above our poor power to add or detract.”– Abraham Lincoln, Gettysburg address

The last few posts, as we’ve started to think about disasters, we’ve asked, what’s it worth to see a disaster coming? Katrina shows vividly that it’s worth relatively little if we can’t or won’t act. People had been vocal about the growth of vulnerability in New Orleans for decades, even as the vulnerability and risks ratcheted up. The warnings didn’t seem to be enough.
Some salient features of this landscape? Well, for one, the 2002 series of articles by Mark Schleifstein and John McQuaid in the New Orleans Times-Picayune, “Washing Away: how south Louisiana is growing more vulnerable to a catastrophic hurricane.” For another, the 2004 article by Shirley Laska in The Natural Hazards Observer, “What if Hurricane Ivan had not missed New Orleans,” and her June 2005 talk as part of an AMS environmental science seminar on Capitol Hill, in the Senate Hart Office Building, on the topic of “New Orleans, hurricanes, and climate change: a question of resiliency.” That afternoon, one hundred policymakers were in the room, including U.S. Senator Mary Landrieu (D-LA, who to her credit had always been concerned about this threat and working hard, first to avert it, and since to recover from it).
Dr. Laska, a sociologist at the University of New Orleans and then director of the Center for Hazard Assessment, Research, and Technology (CHART), laid out the whole scenario. She touched on the growth in Louisiana population, the development of the Port of New Orleans and the offshore oil extraction and the associated refineries. She recounted a century of bad engineering along the Mississippi, the degradation of Louisiana’s coastal wetlands and the subsequent loss of their natural protection. She discussed the risks in depending upon evacuation as a strategy: the vulnerabilities of the lone evacuation route over Lake Pontchartrain and the fact that at any given time, 100,000 people would be too poor to find a ride, and 2000 people to sick to move. She estimated it would take 90 days to dry out the “bowl” (that portion of New Orleans under sea level and most vulnerable to flooding), and twenty years to recover. So far, as we say in our trade, that forecast seems to be verifying.

Read more

Beware the Wrath of a Presidential Storm

The Philippine Atmospheric, Geophysical and Astronomical Services Administration (PAGASA) may indeed have underestimated the danger that Typhoon Conson posed to Manila in July. But it seems even more likely that PAGASA director Prisco Nilo underestimated the political storm that ensued.
At an emergency disaster coordination meeting after the storm (known locally as Typhoon Basyang), President Benigno Aquino scolded Nilo because PAGASA had led Manilans to believe the capital would be spared the brunt of the rain and winds:

That [storm] information it is sorely lacking and we have had this problem for quite a long time. … You do what you are supposed to do… this is not acceptable. I hope this is the last time that we are all brought to areas different from where we should be.

“He really was not angry,” Nilo commented at a press conference. “It was just a comment made by a President, he wanted things to improve, that was his point.”  Yet it seems the president was indeed angry; angry enough to fire Nilo a few weeks later.
It was only the second week of Aquino’s term when Basyang hit metropolitan Manila on 13 July, initially as a weak Category 1 tropical cyclone. Heavy rains and flooding led to at least 100 deaths (at least 70 people were initially reported as missing). The 95 kph

Typhoon Conson (Basyang)
Typhoon Conson approaching the Philippines in July. Portents of political trouble.

winds caused also caused power and communications outages that paralyzed the city for days. PAGASA’s last advisory that night at 11:00 p.m. said that the typhoon had weakened and was headed farther north of Manila. Yet around midnight the eye of the storm passed through the area.
Nilo’s explanation to President Aquino was that the bureau’s equipment limited storm updates and that the system needed to be updated:

We update the bulletin every six hours to take into account possible changes that were not earlier indicated by the mathematical models we are using as guidance in coming up with our forecast.

According to the Philippine news service GMA News, others have spoken up about similar constraints on PAGASA:

PAGASA officials have repeatedly said lack of modern equipment is hampering them from doing their jobs more effectively.

President Aquino’s responded that the bureau should have consulted

Read more