Greenfield, Doppler on Wheels, and what happens where a twister meets the ground
By Katie Pflaumer, AMS Staff
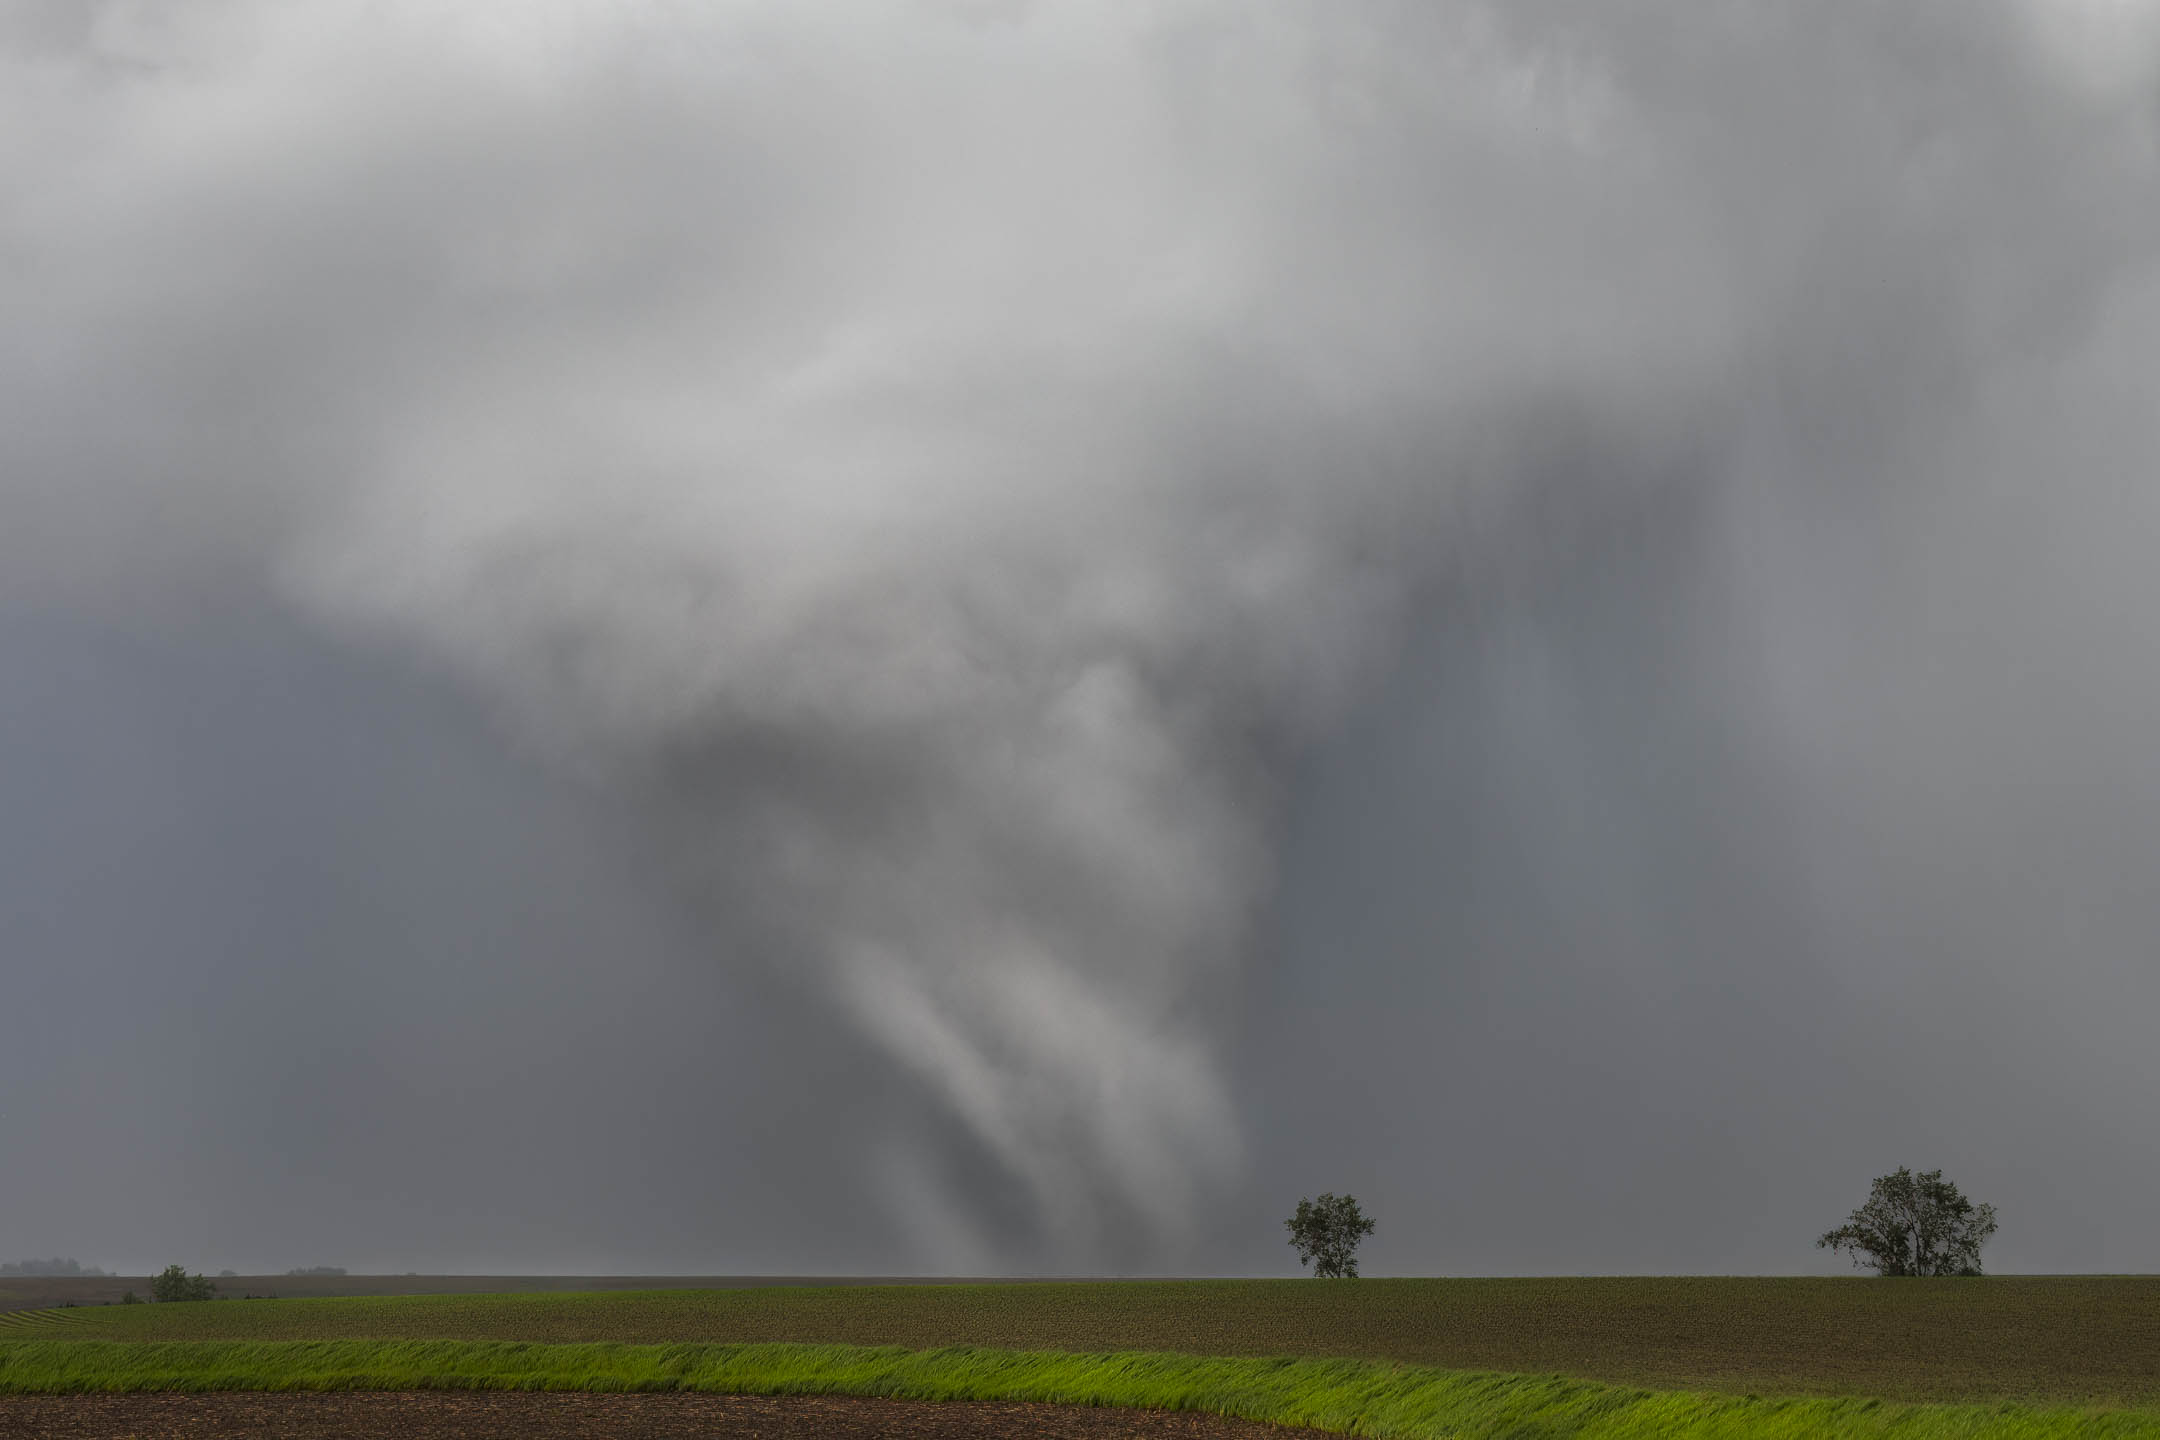
Featured image: The Greenfield tornado, south of the town. Photo credit: Lauren Baca.
On 21 May, 2024, a powerful tornado hit the town of Greenfield, Iowa. A mobile team from the NSF BEST project was able to capture radar and instrument data, measuring one-second gusts among the highest ever recorded. Karen Kosiba, PhD, Principal Investigator (PI) of the BEST project, and Jen Walton, founder of AMS partner organization Girls Who Chase, were both part of the team who intercepted the Greenfield tornado. We spoke with them about what it was like, and what their valuable data might yield.
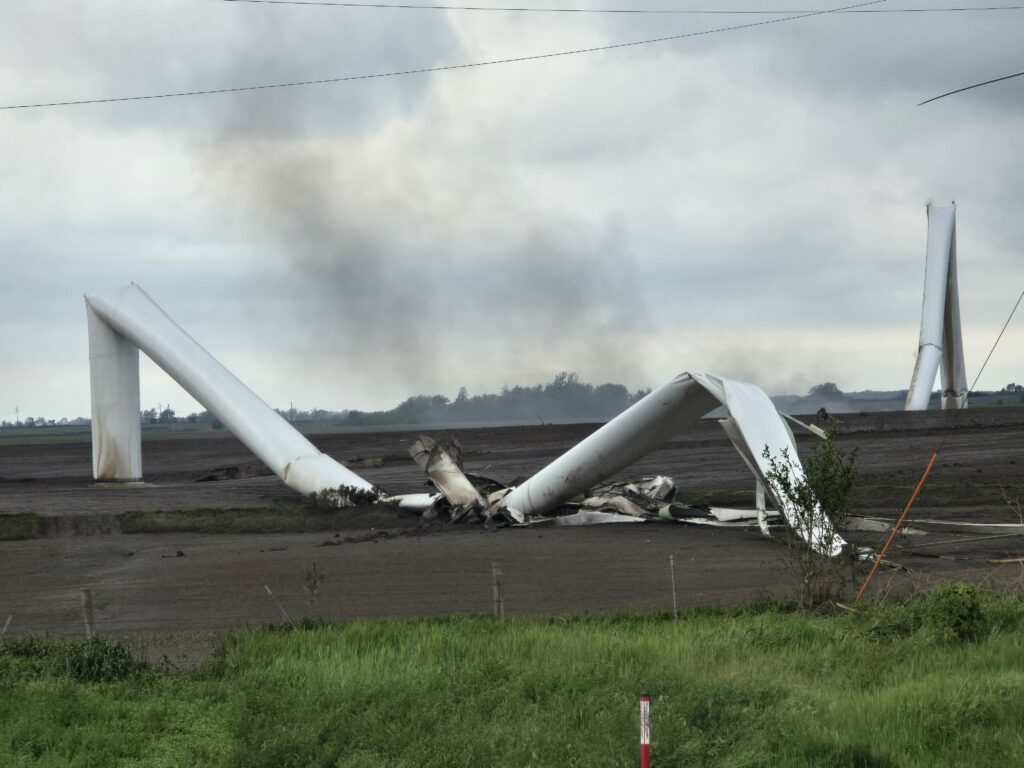
The tornado that hit Greenfield was fast, narrow, and violent, cutting a 44-mile path through southwestern Iowa. Moving into town from the southwest, it had already destroyed wind turbines and family farms, with multiple vortices visibly rotating around its center.
But as it neared Greenfield, where it would kill five people, the tornado was obscured by a cloak of rain. Racing toward the town with her colleagues, Jen Walton told me, “We could see nothing but a wall of white ahead of us.” They were trying to put themselves right in the path of a hidden monster.
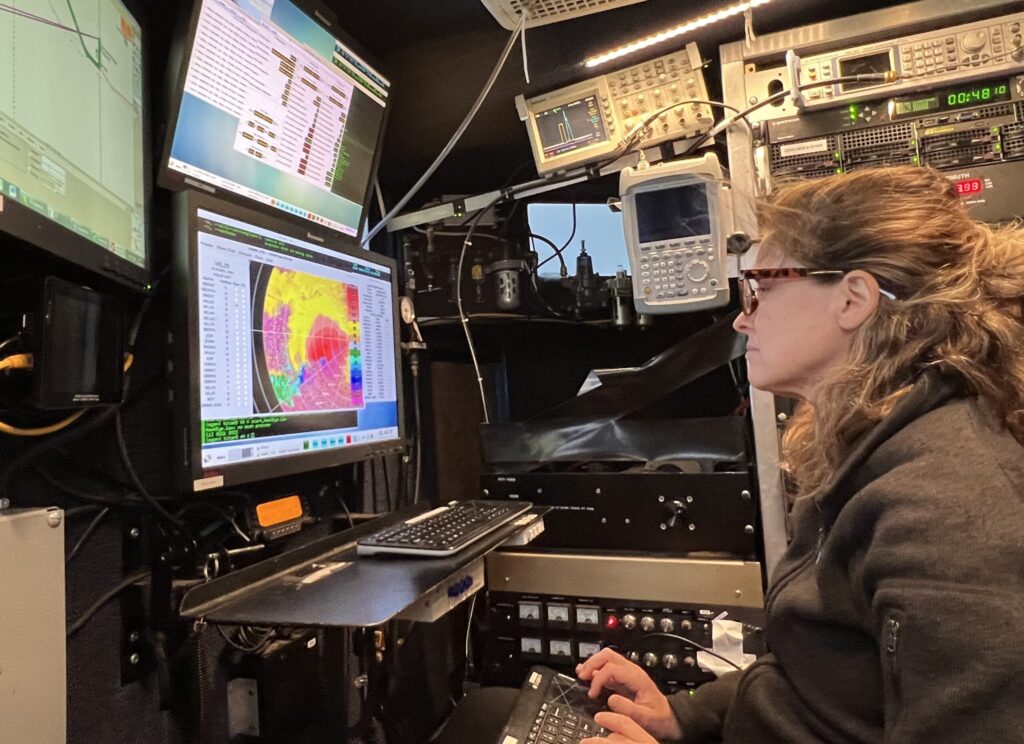
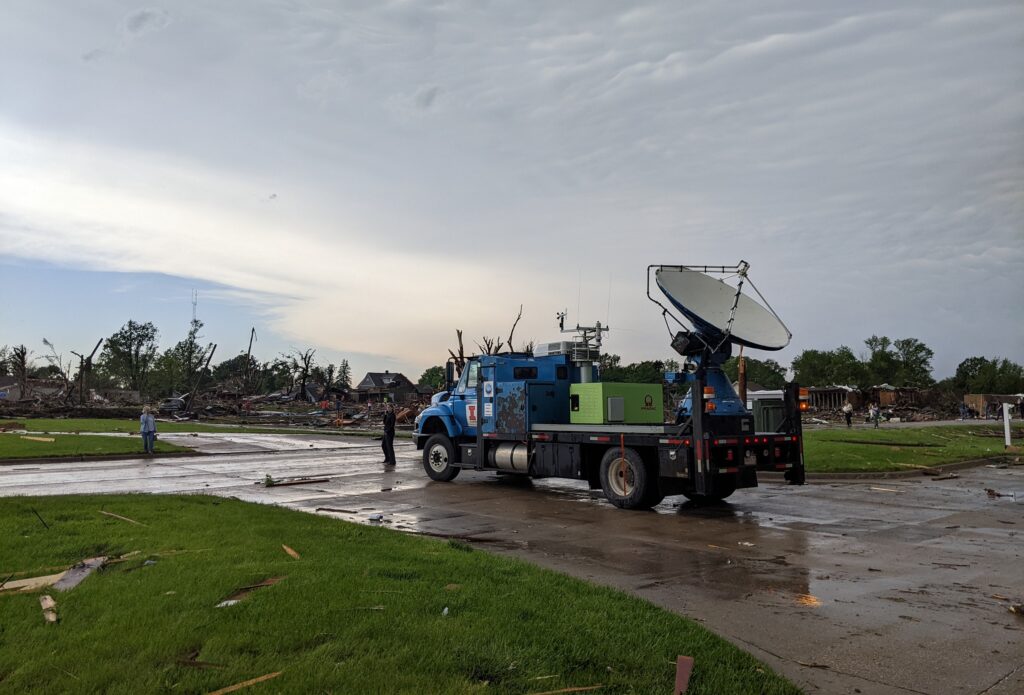
Karen Kosiba wouldn’t have seen it anyway, although she was less than a quarter of a mile from the vortex. “I [almost] never look out the window,” she told me. Her attention was glued to the radar screen. As Principal Investigator on the NSF-funded BEST (Boundary-layer Evolution and Structure of Tornadoes) project, her job was to track the path of the tornado on radar so their team could get close enough to obtain high-resolution dual-Doppler radar and weather instrument data of the tornadic winds closest to the surface of the earth.
They had sped through Greenfield, and her mobile radar vehicle was now parked just to the east of town, hoping for a clear line of sight in the hilly, tree-covered terrain. “I’m operating the radar, we’re basically scanning through this [storm], tracing the path of the tornado, and it was getting more and more obvious it was going to go through Greenfield,” she said.
DOW(n) Low with Tornadoes
Obtaining high-resolution data from tornadoes is incredibly difficult using stationary instruments and radars — especially for near-surface conditions. The earth’s curvature and obstacles like trees and topography mean that far-away radars simply can’t get a good view of where a twister meets the ground. Also, because of beam spreading, far away radars have worse spatial resolution. Josh Wurman invented the Doppler on Wheels (DOW) network of truck-mounted Doppler radars — now part of the University of Illinois’ Flexible Array of Radars and Mesonets (FARM) Facility — in the 1990s to address challenges like these. DOWs have been used all over the world to look at everything from hurricanes to flooding and wildfires.
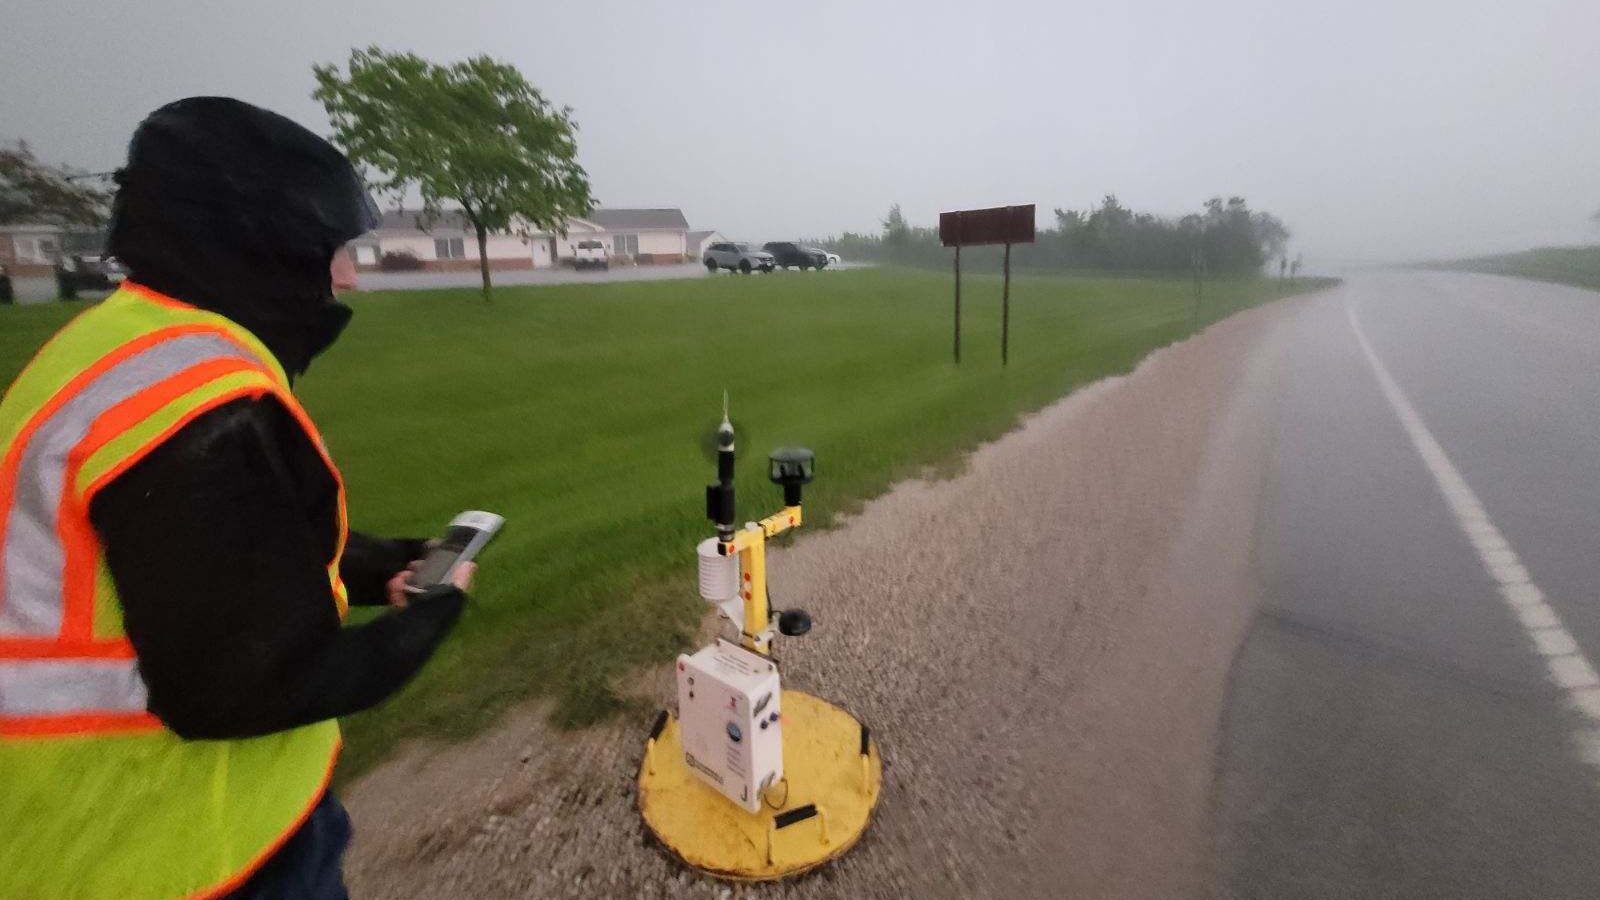
FARM missions currently involve some combination of their four DOWs, a variety of support vehicles equipped with mesonets, and quickly deployable weather stations (Pods), as well as weather balloon-borne instrumentation. The equipment has advanced greatly since the ’90s, Kosiba says. “We scan fast, with really short gates that get us fine-resolution … dual-pol data, which is important for understanding debris signatures and inferring microphysics.”
The BEST project (which Kosiba co-leads with Wurman) deploys DOWs, Pods, and weather balloons to study boundary-layer tornado winds. “We’re looking at … near-surface wind profiles, and how those vary as a function of tornado structure,” said Kosiba. “We’re also looking at thermodynamics — the relative humidity and temperature, more or less buoyant air, where it originates from — and how that affects tornado intensity, structure, and longevity. Is [the tornado] intensifying, weakening, going on for a long or short time?” It’s the kind of assignment the DOWS were made for.
“Some, rare, observations show that tornado winds can exceed 300 mph, and that the most intense winds are very near the ground, where they are especially hard to measure. In order to mitigate the hazards posed by tornadoes, it is critical to better understand their basic structure and intensity.”
—Excerpt from NSF Boundary-layer Evolution and Structure of Tornadoes (BEST) project grant description
In Greenfield
As TV screens and tornado sirens blared warnings to the town of Greenfield, the BEST team frantically tried to find a place to deploy as the tornado bore down.
“It was evolving too quickly,” Kosiba told me. One DOW raced to get about 10 miles out, while Kosiba’s DOW truck tried to get closer — and Jen Walton and colleagues went even closer to the tornado, attempting to drop a Pod. Pods are placed in the projected path of the tornado, with the hope that they will obtain surface wind observations from within the radius of maximum winds. Positioning the Pod was difficult with a storm moving at close to 45 mph.
“As we drove back west toward Greenfield … it was absolutely pouring, making it difficult to make out any features of the tornado-producing storm entering town. But as we pulled up and began to deploy the Pod, the rain bands took on a left-to-right motion indicative of rotation,” said Walton. “That’s when we knew we were in the bear’s cage — chaser slang for the mesocyclone portion of a supercell where a tornado can typically be found, if there is one. As we took GPS coordinates and prepared to depart, debris began falling slantwise out of the rain. We knew it was time to go.”
As it turned out, the Pod team wasn’t the only group having a close encounter. Kosiba’s DOW vehicle ended up directly in the path of a weaker tornado that was forming as they collected data near Greenfield. “The storm was going through a cyclic thing, and there was a new tornado forming very near us. It got windy and rainy.” Although they noticed this in real-time, there wasn’t much they could do except keep collecting data. Luckily, the tornado strengthened after it passed their location.
As so often happens with this work, for Kosiba at least, there was no time even to be nervous. “Tornadoes are so fast, and you’re so focused on getting people in the right place, in a safe place, and getting the data, so there’s no time to think about anything other than that.”
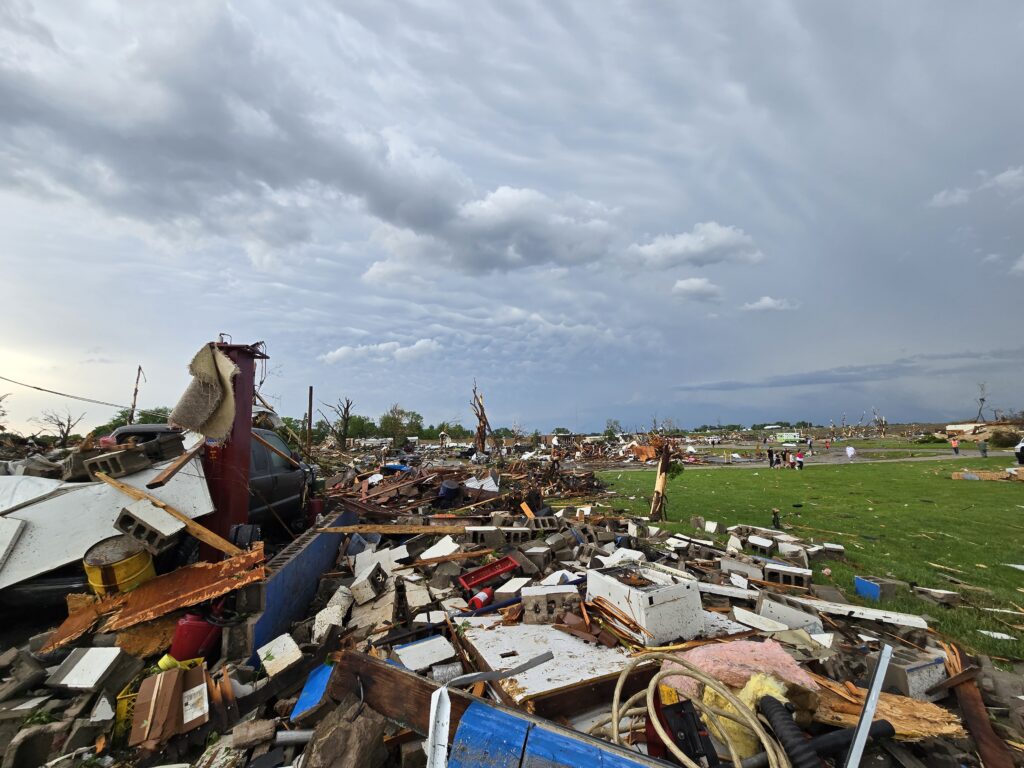
What was harrowing was driving into Greenfield once the tornado had passed. “There’s clearly a path of destruction … In that narrow region [where the tornado went through], it was pretty raked over. People were still coming out of their houses, animals were still trying to get oriented.”
Rare Data from a Disaster
The radar data from the BEST team is high-resolution enough that researchers will be able to examine how specific structures in Greenfield failed in the high winds. “Measuring low-level winds very close to a town is very rare … we can see in a very localized area what these structures experienced,” Kosiba said. These grim analyses could assist damage assessors after future storms, and perhaps even help those building and maintaining man-made structures to make them safer.
“We’re in the preliminary stages of inventorying what we’ve got and what we can do,” said Kosiba. “But it’s a rich and unusual dataset.”
Strongest Winds Ever?
During the storm, the team was concerned only with acquiring good data. When they actually looked at the Greenfield readings, however, they were surprised to note winds of around 270 miles per hour, with gusts well above that. These one-second wind speeds are difficult to pinpoint exactly, said Kosiba, as the particles measured by radar — “debris, raindrops, grass, two-by-fours” — are all moving differently through the air and at different angles to the radar beam. “We’re trying to give a range, which puts this event at 309–318 mph.” The two strongest known tornadoes, El Reno in 2013 and Bridge Creek in 1999, both had DOW-measured wind speeds within that range.
Yet the Greenfield tornado was “only” deemed an EF4 by the National Weather Service (indicating three-second wind speeds up to 200 mph). This is likely because the EF scale is based on the structural damage a tornado leaves, not radar/instrument measurements. To receive the highest rating, EF5, a tornado has to damage structures to a degree that only an EF5 could. “It’s possible there was nothing [in its path] that could have sustained an EF5 level of damage,” said Kosiba.
In addition, the highest wind gusts measured by the DOW team were for very short intervals, often less than one second, rather than longer-period averages. Due to the relative dearth of close-up measurements, we don’t know enough to say how unusual such high wind speeds near the surface really are.
Chasing the Data
“Twisters,” the long-anticipated sequel to the 1996 movie “Twister,” has hit movie screens, highlighting the awe of dangerous storms–and the divisions sometimes drawn between scientific researchers and those who chase storms because it’s their passion. As researchers and storm chasers who work together to get vital information about tornadoes, what do Kosiba and Walton think?
“In my opinion, storm chasers are fonts of historical knowledge and expertise that are underutilized by the scientific community, and this is something I’m discussing with AMS and the broader research community,” said Walton. “We get a bad rap for being adrenaline junkies seeking our next thrill, and of course some folks are. But many people, myself included, would love to have more tangible ways to contribute in addition to already serving as eyes on the ground for the National Weather Service and/or working with local broadcast meteorologists. When Karen mentioned the opportunity to support the BEST Project, I jumped at the opportunity to use my own knowledge and expertise to contribute to work I know will truly make a difference in peoples’ lives – and even though my 2024 looked very different than a typical season, my time in the field with the DOWs is an experience I wouldn’t trade.”
“This kind of data collection is high risk but high payoff. You have to be out in the field to do it,” said Kosiba. “People who storm chase can make very valuable parts of the scientific team. Jen knows storm structure and forecasting … We want people who know what they’re looking at, who can think about exits; they need to be able to make some autonomous decisions out there. … If you just have a textbook understanding of storms, you have to get ramped up [on the practical side]. But people who’ve been looking at these storms for a long time and making decisions, that’s a great skill.”
To learn more about Girls Who Chase, listen to podcast interviews with experts like Dr. Kosiba, or even start your storm chasing education, check out girlswhochase.com.
To learn more about BEST and the DOWs, AMS Members and Weather Band members can watch our 23 July, 2024 webinar featuring Drs. Kosiba and Wurman and moderated by Jen Walton: Tornado on the Ground: DOW insights from 2024 tornadoes, including the Greenfield, IA EF4.
