Bill Hooke and Life on the Real World

A new NOAA oral history archive spotlights lessons from a life in science and policy

William H. “Bill” Hooke, PhD (AMS senior policy fellow emeritus), has both led and thought a great deal about developments in weather, water, climate (WWC) and society at large over more than half a century. He worked for the National Oceanic and Atmospheric Administration (NOAA) and antecedent agencies from 1967 to 2000, including tenures as Deputy Chief Scientist and Acting Chief Scientist of NOAA, as well as Senior Scientist in the Office of the Secretary of Commerce. An honorary AMS member, he has served as a senior AMS policy fellow, associate executive director, and director of the AMS Policy Program. He founded the AMS Summer Policy Colloquium, which he directed for 21 years. 

Over the course of many jobs, administrations, and scientific revolutions, Hooke developed a reputation for exceptional leadership and collaboration, for managing crucial initiatives in natural disaster reduction and national policy, and for deep and multidisciplinary insights across scientific and social fields. He has influenced the careers and lives of many people in the WWC enterprise, and won the AMS’s Joanne Simpson Mentorship Award (now the Robert H. and Joanne Simpson Mentorship Award) in 2014. Now, an oral history video series from NOAA captures some thoughts and observations from his long and vibrant career.

In a series of 30 candid conversations, Hooke talks to AMS Policy Colloquium alumna Mona Behl about his life in a family of scientists; his contributions to disaster reduction, the evolution of the WWC Enterprise, and technological innovations; and what it means to be a leader, a scientist, and a person of faith.

Watch the first video in the series

Here are a few excerpts from their rich conversations.

On luck:

“My dad was born in Chattanooga … in 1918. … The doctor told my grandmother afterwards, he said, “Mrs. Hooke, that’s the biggest baby I ever delivered whose mother lived.” And in fact [maybe] the reason I’m alive today, is that while the doctor was getting ready to tell my grandfather that he had to choose between my grandmother and my dad, my grandfather was nervously walking around outside the hospital, around the block. By the time he came back in for that consultation, my dad had been born. I’ve reflected a lot … that all of us represent just this accident of history. … We’re all lucky to be here.” 

On his childhood and his family’s academic legacy:

“When [my grandfather, who received his PhD from the Sorbonne] came back to the University of North Carolina at Greensboro, he and my grandmother used to have a salon. … People would smoke cigars, and faculty members from the university would come over, and there was just this great conversation and a lot of laughter and so on. As a kid, every time I visited, we’d get to see this scene and participate in it and actually come to like the smell of cigar smoke, although I never smoked. … It was just quite a scene. A spectacular thing to see growing up.”

“[My father, Robert Hooke,] was very interested in problems that were tough to solve. … He thought most of the interesting problems in the world didn’t have solutions. He used to say things like, “Linear problems are all the same. Nonlinear problems are always different.” … The one patent he ever got was for something called Direct Search, which was looking for optima when there was no formula for them.”

“[Getting a PhD in geophysical sciences] was a lack of imagination. Here I was in this tribe of scientists, and it never occurred to me to be anything else. … I woke up with a PhD and thought, ‘Now what?’”

On his early career:

“I never got the job I applied for, and I never turned down one that was offered. … So, I took this job at the Ionospheric Telecommunications Laboratory [in 1967]. … [But when Nixon created NOAA, my boss transferred me to] the Wave Propagation Lab. That was cutting-edge. … [Gordon Little, who ran the lab,] realized that remote sensing was the key to learning about … the atmosphere, the oceans, the solid Earth. … All of these technologies – acoustic sounding, weather radar, Doppler lidar, other techniques, radiometry – were in their infancy, and nothing worked. So, when things started to work, they’d start seeing atmospheric phenomena that nobody had ever seen before … If you had half a brain, you could wander around and you were seeing things that nobody had seen and applying simple ideas to them, and they worked.”

On learning how to manage and lead:

“[Gordon Little] didn’t care much about the Geoacoustics group [at the Wave Propagation Lab] so he put me in charge.] … Well, in our group, we always had a brown bag lunch every day. … The conversation would usually move on, oblivious to whatever I was trying to say. But that lunch [after Little announced the change] … I said something [and] there was this hush that fell over the group. Wow. I realized, from now on, I’m walking in a hall of mirrors. People are only going to show me the side that they think I’m going to like. It was a very important moment for me … One of the things that you learn is, the higher you go … you have to get gentler and gentler and gentler if you really want people to open up to you and for the group to be vibrant the way it should be.”

“If [a leader’s dream is] a small dream, if it’s like, “Hey, we’re going to do this, and a small number of us will get rich.” … It can’t be a shabby dream. People are put off by that. The second thing is it’s got to be a shared dream. … If you don’t share your ideas, they get smaller and smaller and less relevant and really kind of a grotesque version of what they were meant to be. But if you share your ideas, then other people riff on them, and … it actually generates ideas. … People want to be around you. You’re not a sink for thought; you’re a source of it.”

On advice for early career scientists:

“If you’re an early career scientist, you live in a world that encourages you to be anxious and stressed and to feel insecure, maybe even fearful. … [But] the world is hungry for talent. We just have unlimited needs for brain power right now. Brain power is in very short supply, and if you have … something to offer, people are standing in line to harness it and to work with you. It’s just a message that young people need to hear, and they can’t hear it enough.”

On legacy and achievements:

“I have a very dim view of my achievements. … I had the very good fortune to work with just brilliant people. … There’s so much you can do to stifle creativity and innovation, but trying to [instead] stay out of the way of people who are in that business; that means working up the ladder to make that [innovative work] possible for those people. … You need to just be saying thank you and encouraging people day in and day out, hour in and hour out, and you add it up after forty, fifty years, and it has an accumulated effect.”

“I’ve worked with a lot of people who made great contributions to improving weather and climate warnings, but I probably had nothing to do with that myself. … I led efforts where great progress was made. … In particular, a lot of work in small-scale weather, short-term weather, aviation weather, things of that sort. Those were, again, things [that] groups I managed worked on. Made a lot of progress on those things, but it was wonderfully sharp people who did it, and I just kind of went along.”

On civil service:

“The work we’re engaged in is a high calling. I got interested in science because I was good at it, and it was fun. It became serious business, particularly after I got into the hazards work, starting with that Academy panel I was on in 1986, the one that set up the International Decade for Natural Disaster Reduction. … The people were just high-minded people. I saw a lot to admire in the people I was involved with.”

“One piece of advice that I’d give every NOAA employee. … You should take a lot of satisfaction from your role as a civil servant in NOAA and what you’re contributing to society. It’s very easy to see all the things and all the dysfunction and the budget problems … [and] interagency squabbles and the rest of it. … You should just be strong about the value of what you’re doing.”

On the philosophy of science, AI, and innovation:

“Scientists, we might be unique in our difficulty at understanding that we’re not pure. [laughter] We struggle so much to work on the objective part and the experiments in the lab … that we forget that science is a human construct … You have to think a lot more about the human purposes and the human goals and so on. … With artificial intelligence[,] I think we’re all seeing in a vague sort of way, “Wow, this has so much potential for both good and evil.” I don’t think there’s been a moment since the construction of nuclear weapons that people have been [so] apprehensive about the steps we’re now taking. These are steps that have nothing to do with science as we understand it; it has everything to do with humanity. We don’t trust ourselves … to control this science for the benefit and use of life versus those inferior things – fame and power, money and so on – that [Francis] Bacon spoke of.”

“When it comes to science that matters … you want multiple paths to it. You want redundancy. One of the things I fought all my career was this bureaucratic tendency to try to reduce duplication in science, and overlap, and I kept thinking, ‘No. On innovation, you want to be doing as much as you can afford.’”

“AI will probably exacerbate this [current breakdown of social trust] to some extent. … I think we’re in for … a Wild West kind of frontier-like period [in which] wonderful things and horrible things are going to happen at a higher rate of speed than usual. Human beings are going to have a period of trying to deal with that. I think that’s why, to me, it’s getting more and more important that we learn how to be forgiving.”

“Tom [Durham] had written just a stellar disaster preparedness strategy for the State of Tennessee. … Tom had a lot of expertise, and he brought it to bear on this very thoughtful strategy and worked with people to develop it and get started implementing different aspects of it. … That would be the kind of thing that more people could do if aided by artificial intelligence.”

“When I was still living out of Boulder … we had some huge thunderstorms moving rapidly through the Denver area. There was a small echo up in Cheyenne, Wyoming, that didn’t seem worth paying much attention to. Well, it stayed put for six hours … [and] one or two people drowned when the flooding occurred. That’s the kind of thing that an artificial intelligence system might be better at capturing, that kind of alertness and just looking for a detail … that other people might miss. So, I think AI really changes the possibilities for good if we have good intentions and look for ways to harness it. … It’s going to be fun to sort it out. But I think it really changes things.”

On confronting environmental change:

“To get out of the pickle that we’re in with regard to climate change and broader environmental issues … we have to be good as much as we have to understand the science of things. … We’ve got eight billion people playing some version of [game theory] – lack of trust, lack of forgiveness, lack of tolerance. [And] there’s a lot of complacency about all the aggression that we’re visiting on others. … I’ve been very interested in the whole rise of the diversity, equity, inclusion kind [of thing] because it seems to me it’s getting at this … at the level that it really needs to get at it.”

“We are each responsible for fixing it, whatever the problem is. That doesn’t mean changing history; you can’t do that. It is what it is. It means a path forward. … We have to work on the problem all of us together, and that’s eight billion of us. Everybody has something to offer. Everybody has something to regret. It’s our job right now. It’s the 21st-century task. … Suppose you decide that your task in life is to be responsible for the renewal of the world versus your task in life is to document the collapse of the world. Choosing the second one over the first is a poor trade [laughter] in so many ways.”

On his work in natural disaster reduction/resilience:

“The Subcommittee for Natural Disaster Reduction was under this Committee on Environment and Natural Resources. … We felt that our goal was really to try to build US resilience. … It’s really people who were disadvantaged, to begin with, who are hurt most by natural disasters when they occur … I think I told you I’ve always been interested in political science … But it just got to be a much richer thing after that. … I went from feeling excited about what I was doing because it was just so interesting, to feeling each day that I could help make the world a better place.”

“A lot of interest in the government [at the time was on climate change] – this was the Clinton Administration … If you were working on natural hazards, you were struck by [the sense] that the planet really did much of its business through extreme events. These averages that were of so much concern were the averages of extremes of heat and cold, extremes of precipitation and drought. … [Today] we see people putting those two things together.”

“The President looks at a certain number of disaster declarations over the year … But for each of the local officials, it’s life-changing. … the incentives for thinking ahead locally for events like this are just so much stronger than the incentives for a President of the United States to look at these matters. I continue to feel that the best thing to do would be [to] give people at the local level more tools for dealing with this.”

On the AMS Policy Program and Policy Colloquium:

“I was minding my own business. In the year 2000, I was thinking I had about ten or fifteen more years to go in government … I got invited downtown to the DC offices of the American Meteorological Society by Ron McPherson, who was the executive director at the time, and Dick Greenfield, who was standing up this new thing called the AMS Policy Program. … They asked me, ‘Well, when could you start?’ And I said, ‘Two weeks.’ [laughter]”

“I had basically a year to kind of get [the AMS Summer Policy Colloquium] ready and got it started in [2001]. … One of the things I found out pretty early was all the congressional staffers, policy officials in the government, and so on – they were looking for something like this, too, and they were skeptical that maybe the AMS could deliver … But after they came the first time and saw how bright the Colloquium participants were … the speakers just thought, “What a great group. What a great format. All this time for discussion” and so on. Sometimes, they’d come early and hear their colleagues’ lectures or stay late for another colleague’s lecture. That added kind of to the vibe. They’d ask questions as part of the discussion. It was, thanks to the participants, really lively.”

“The Colloquium was a way of showing people that the real world wasn’t operating on the basis of the Navier-Stokes equations, or the rules of radiative transfer, or plasma physics, or whatever – it was working on heuristics, conjecture, power and courage, and trust and faith, and a whole bunch of things on which all those equations are silent. … [As scientists,] we’re not used to being as disciplined in our approach to the policy process as we are to science. This was an effort to overcome that. … I really think the whole thing was a tribute to, again, just the passion that the science leadership of this country, government agencies, and staffers on the Hill had for it and the quality of the participants that were coming in … The people made it all work. … It was just a privilege to be part of it for two decades and to just watch this sweep of intellect, energy, and talent go by.”

On retiring (or not): 

“My uncle “retired” in his fifties and moved back to North Carolina. But at the age of eighty-something, he was still getting research grants from DARPA [Defense Advanced Research Projects Agency] to do these non-fusion applications of plasmas. He was part owner of a drugstore on the main street in North Carolina. … He would do his physics there in the diner and kind of go over to the university … He was the inspiration to me. I kind of felt as long as my uncle was still working, who was thirteen years older than I was, I ought to be working, too. Only I did it in a more formal way and I’m just tremendously happy I did. These last twenty years or so of my career were the best by far.”

View the full video series and transcripts at the NOAA Voices Project

View a biography of Bill Hooke

Bill Hooke is the author of the book Living on the Real World: How Thinking and Acting Like Meteorologists Will Help Save the Planet. He runs the Living on the Real World blog, where you can read his continuing contributions about science, society, and this moment on the planet Earth.

About the NOAA Heritage Oral Histories Project

NOAA Heritage Oral History Project aims to document the history and legacy of NOAA through compelling interviews with its leaders. These firsthand accounts provide an invaluable resource that preserves NOAA’s significant contributions to environmental research and management, fostering a deeper understanding of NOAA’s vital role in shaping our understanding of the Earth’s oceans and atmosphere. Learn more here.
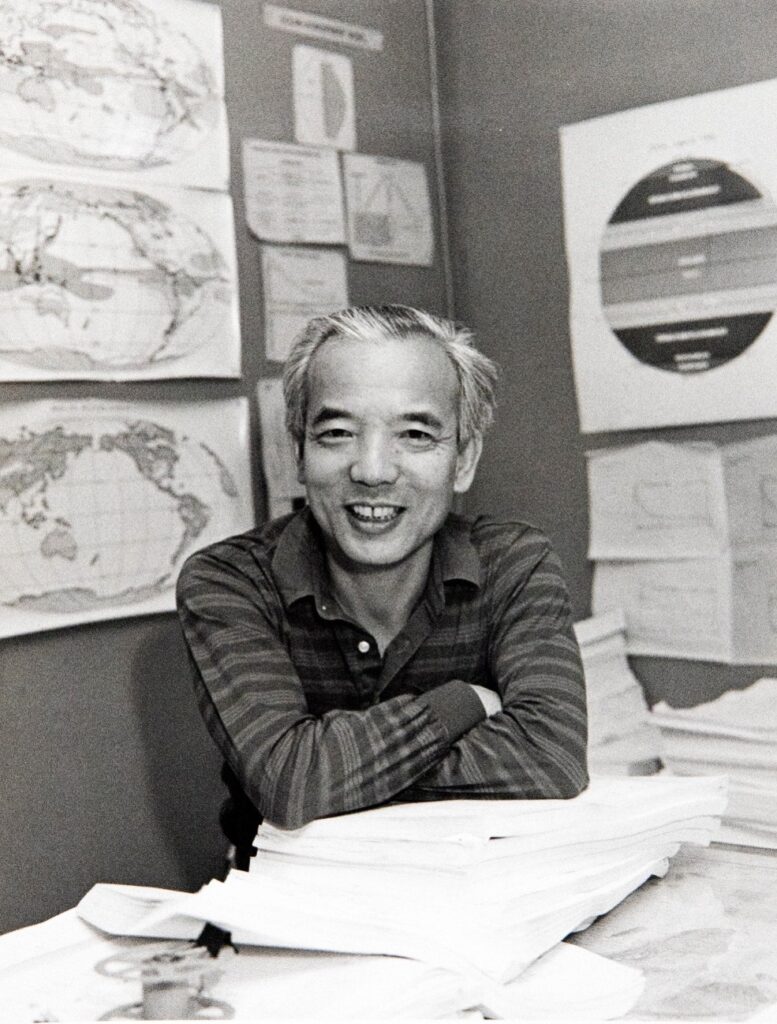
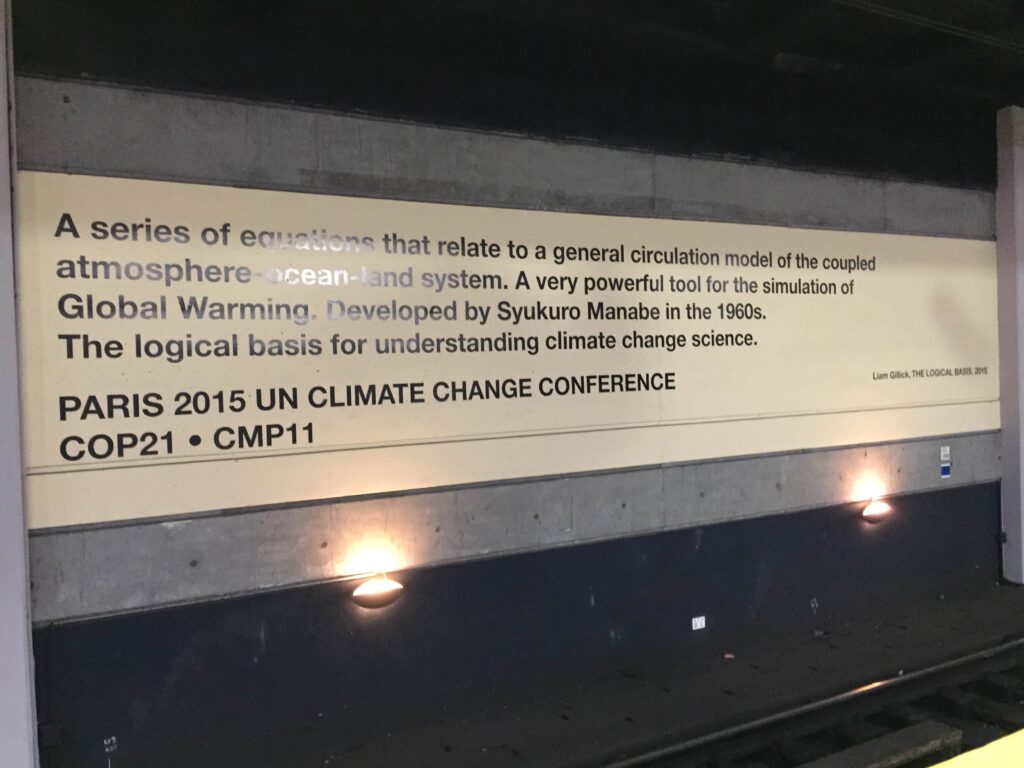
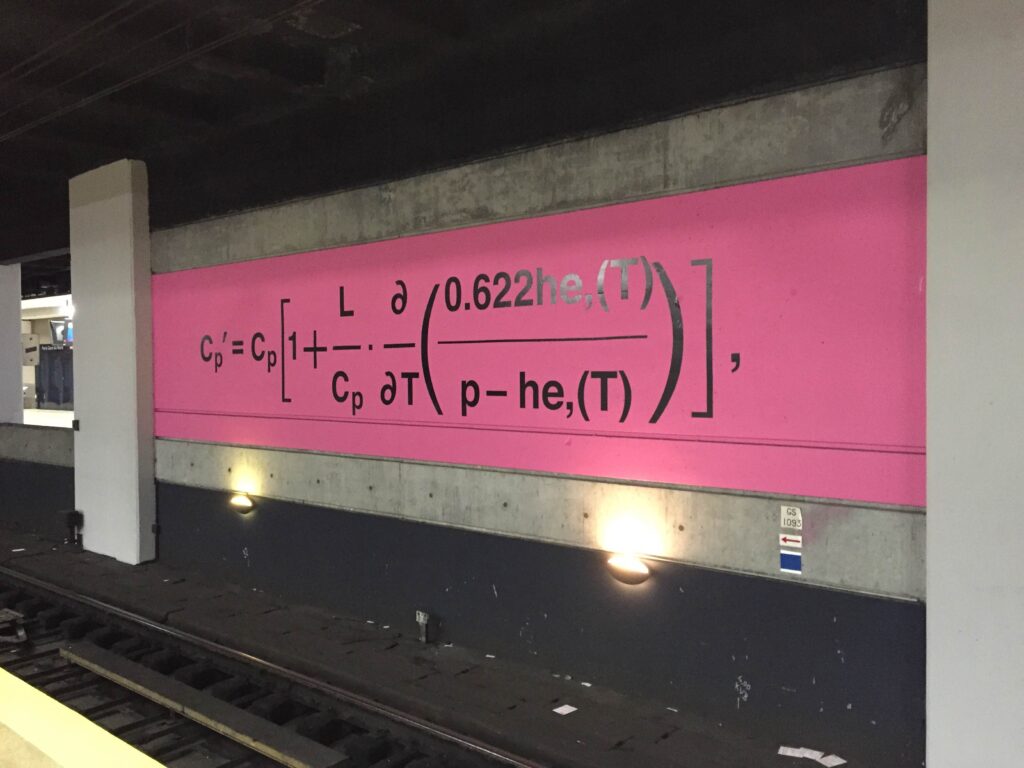
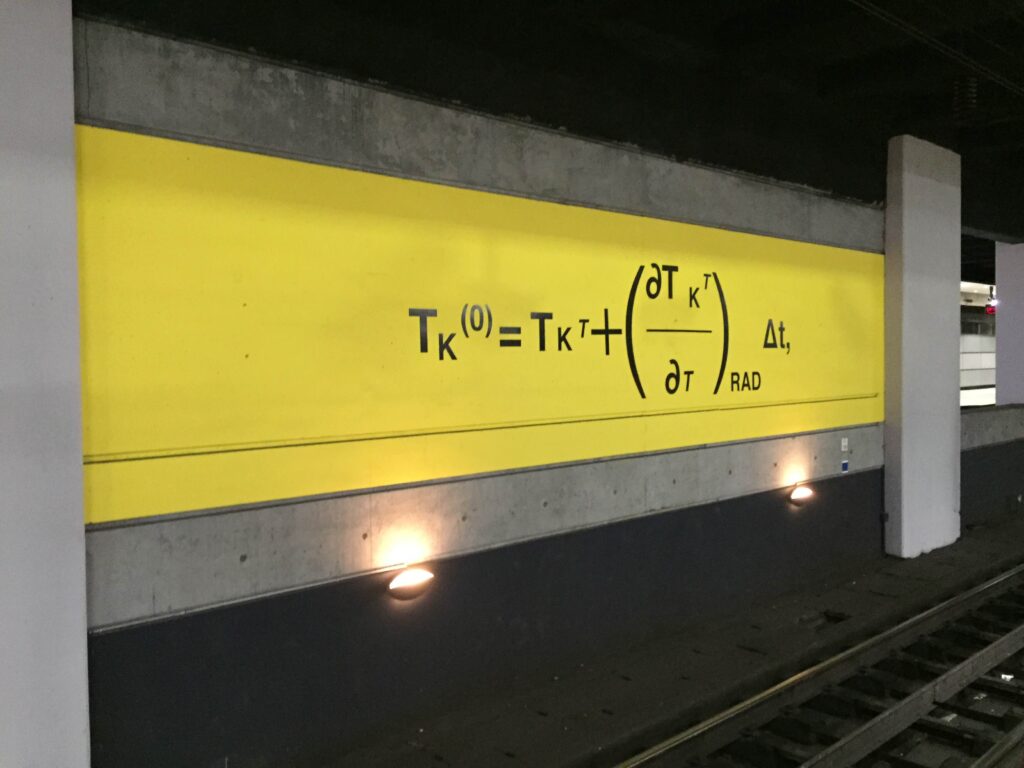
Asian American and Pacific Islander Heritage Month Spotlight: Dr. Syukuro “Suki” Manabe

By Anjuli S. Bamzai, AMS President

My graduate advisor at George Mason University, Dr. Jagadish Shukla, displayed the photos of four meteorologists in his office: Drs. Norman A. Phillips, Jule Charney, Edward Lorenz, and Syukuro “Suki” Manabe. All giants in their field, they had been his PhD advisers at Massachusetts Institute of Technology (MIT). In the 1990s, as I pursued my graduate degree at Dr. Shukla’s Center for Ocean-Land-Atmosphere Studies (COLA), the scientific family tree remained strongly connected, and so I in turn had the chance to cross paths with luminaries like Manabe in person.

Suki Manabe photo

Circa 1994, I had the privilege of hearing Manabe–or, as I came to refer to him, Suki-san–give the inaugural talk at the newly established COLA. He spoke about the use of dynamical general circulation models to study the atmosphere and its coupling to land, using a simple ‘bucket’ model to discover emergent properties of this complex, chaotic system. He was an animated speaker; it was apparent that he was driven by curiosity and sheer love of the science that he was pursuing.

I was inspired by his ability to explain the properties of such a complex system as the Earth in such elegant terms. Suki-san’s clarity and scientific passion resulted in contributions to our understanding of climate the importance of which cannot be overstated. As I began my own foray into Earth system science, those initial interactions were a formative experience.

Left: Suki-san enjoying his work. Photo courtesy of Dr. V. Ramaswamy.

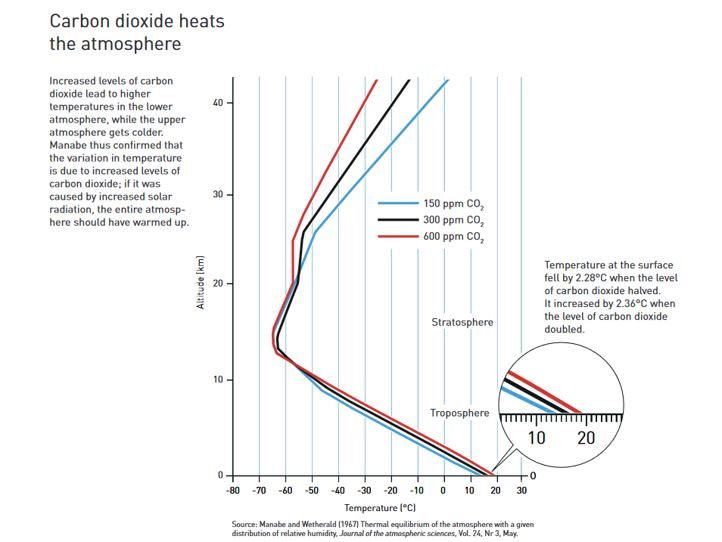
The models he used were relatively simple compared to the complex Earth system models of today. Yet Manabe and Wetherald (1967), published in the AMS’s Journal of the Atmospheric Sciences, is arguably one of the most influential papers in climate science. It demonstrated a key feature of the atmosphere with an increase in carbon dioxide: rising temperatures closer to the ground while the upper atmosphere got colder. If the variation in solar radiation was primarily responsible for the temperature increase, the entire atmosphere would have gotten warmer.

Graphic from Phys.org, based on Manabe and Wetherald (1967), Figure 16, “Vertical distributions of temperature in radiative convective equilibrium for various values of CO2 content.”

The work that Suki-san and his team conducted comprised a major component of the 1979 report, “Carbon dioxide and climate: A scientific assessment.” Led by Jule Charney from MIT, it is now commonly referred to as the Charney Report. The main result of the succinct 22-page report was that “the most probable global warming for a doubling of [atmospheric] CO2 [is] near 3°C with a probable error of ± 1.5°C.” Perhaps most importantly, the report ruled out the possibility that increasing CO2 would have negligible effects. This estimate of climate sensitivity has pretty much withstood the test of time; in the past forty years, annual average CO2 concentrations increased by ~ 21% and the global average surface temperature increased by ~0.66°C. How prescient!

Suki-san was one of the panelists who shared their insights at a session that the National Academy of Sciences’ Board on Atmospheric Sciences and Climate (BASC) convened during its November 2019 meeting to commemorate the 40th anniversary of the Charney Report. Suki-san’s concluding slide pretty much summed up his philosophy: make your model just as complicated as it needs to be, no more. (See photo below.)

Panelists photo and concluding slide. Slide text says, "Concluding Remarks: 
[Bullet point one] Satellite observation of outgoing radiation over annual and inter-decadal time scale should provides macroscopic constraint that is likely to be useful for reducing large uncertainty in climate sensitivity.
[Bullet point two] It is desirable to make parameterization of subgrid-scale process 'as simple as possible', because simpler parameterization is more testable."
Left: Panelists at the November 21, 2019 session on The Charney Report: Reflections after 40 years at the BASC meeting. (Left to right) Drs. Jagadish Shukla, former student of Jule Charney; D. James Baker, member of the original authoring committee; Jim Hansen and Syukuro Manabe, major contributors to the original report; and John Perry, staff lead for the report. Right: Dr. Manabe’s final slide at the Charney Report session at BASC. Photos courtesy of Anjuli Bamzai.

October 5, 2021, was such an exciting day to wake up to! The Nobel Prize in Physics was shared by Drs. Syukuro Manabe, Klaus Hasselman, and Giorgio Parisi. The citation reads: “The Nobel Prize in Physics 2021 was awarded for groundbreaking contributions to our understanding of complex physical systems” with one half jointly to Syukuro Manabe and Klaus Hasselmann “for the physical modelling of Earth’s climate, quantifying variability and reliably predicting global warming,” and the other half to Giorgio Parisi “for the discovery of the interplay of disorder and fluctuations in physical systems from atomic to planetary scales.”

As he eloquently stated on the momentous day that he received the Nobel Prize, “I did these experiments out of pure scientific curiosity. I never realized that it would become a problem of such wide-ranging concern for all of human society.”

The accompanying press release on the Nobel Prize particularly cites Suki-san’s work at NOAA in the 1960s, noting that “he led the development of physical models of the Earth’s climate and was the first person to explore the interaction between radiation balance and the vertical transport of air masses. His work laid the foundation for the development of current climate models.”

Left: Event to honor Nobel Laureate Dr. Suki Manabe at National Academy of Sciences. (Left to right) Drs. Jagadish Shukla, Suki Manabe and Marcia McNutt, President National Academy of Sciences. Photo courtesy of Dr. J. Shukla. Right: (Left to right) Drs. V. Ramaswamy, Director, NOAA GFDL, Suki Manabe, and Whit Anderson, Deputy Director, NOAA GFDL, celebrating the big news of Suki-san’s Nobel Prize, October 2021. Photo courtesy of Dr. V. Ramaswamy.

It is no exaggeration to state that the modeling findings by Suki Manabe and, about a decade later, Klaus Hasselman, opened not only an era of climate modeling but also an entirely new subfield of climate science, viz., detection and attribution (D&A) through fingerprinting and other techniques. Observations have provided an important reality check to model simulations through these D&A efforts.

The current torchbearers of the D&A tradition are Drs. Ben Santer, Tim DelSole, Reto Knutti, Francis Zwiers, Xuebin Zhang, Gabi Hegerl, Claudia Tebaldi, Jerry Meehl, Phil Jones, David Karoly, Peter Stott MBE, Tom Knutson, and Michael Wehner, among others. Over the years several of them have also gone on to receive AMS awards—including, in Meehl’s case, the Jule G. Charney Medal. Speaking of awards, Jonathan Gregory is the most recent recipient of AMS’s Syukuro Manabe Climate Research Award, which has also been bestowed on Drs. Joyce Penner and Cecilia Bitz. Next year, consider nominating someone for the Manabe Award, the Charney Medal, or the new Jagadish Shukla Earth System Predictability Prize!

Those of us in the atmospheric and related sciences benefit directly from Suki Manabe’s scientific legacy and intellectual passion, and all of human society owes Suki-san a great debt for helping us to understand climate change, one of the greatest challenges humankind has ever faced.

Anjuli is grateful to Katherine ‘Katie’ Pflaumer for providing useful edits.

Asian American and Pacific Islander Heritage Month Spotlight: Dr. Tetsuya “Ted” Fujita

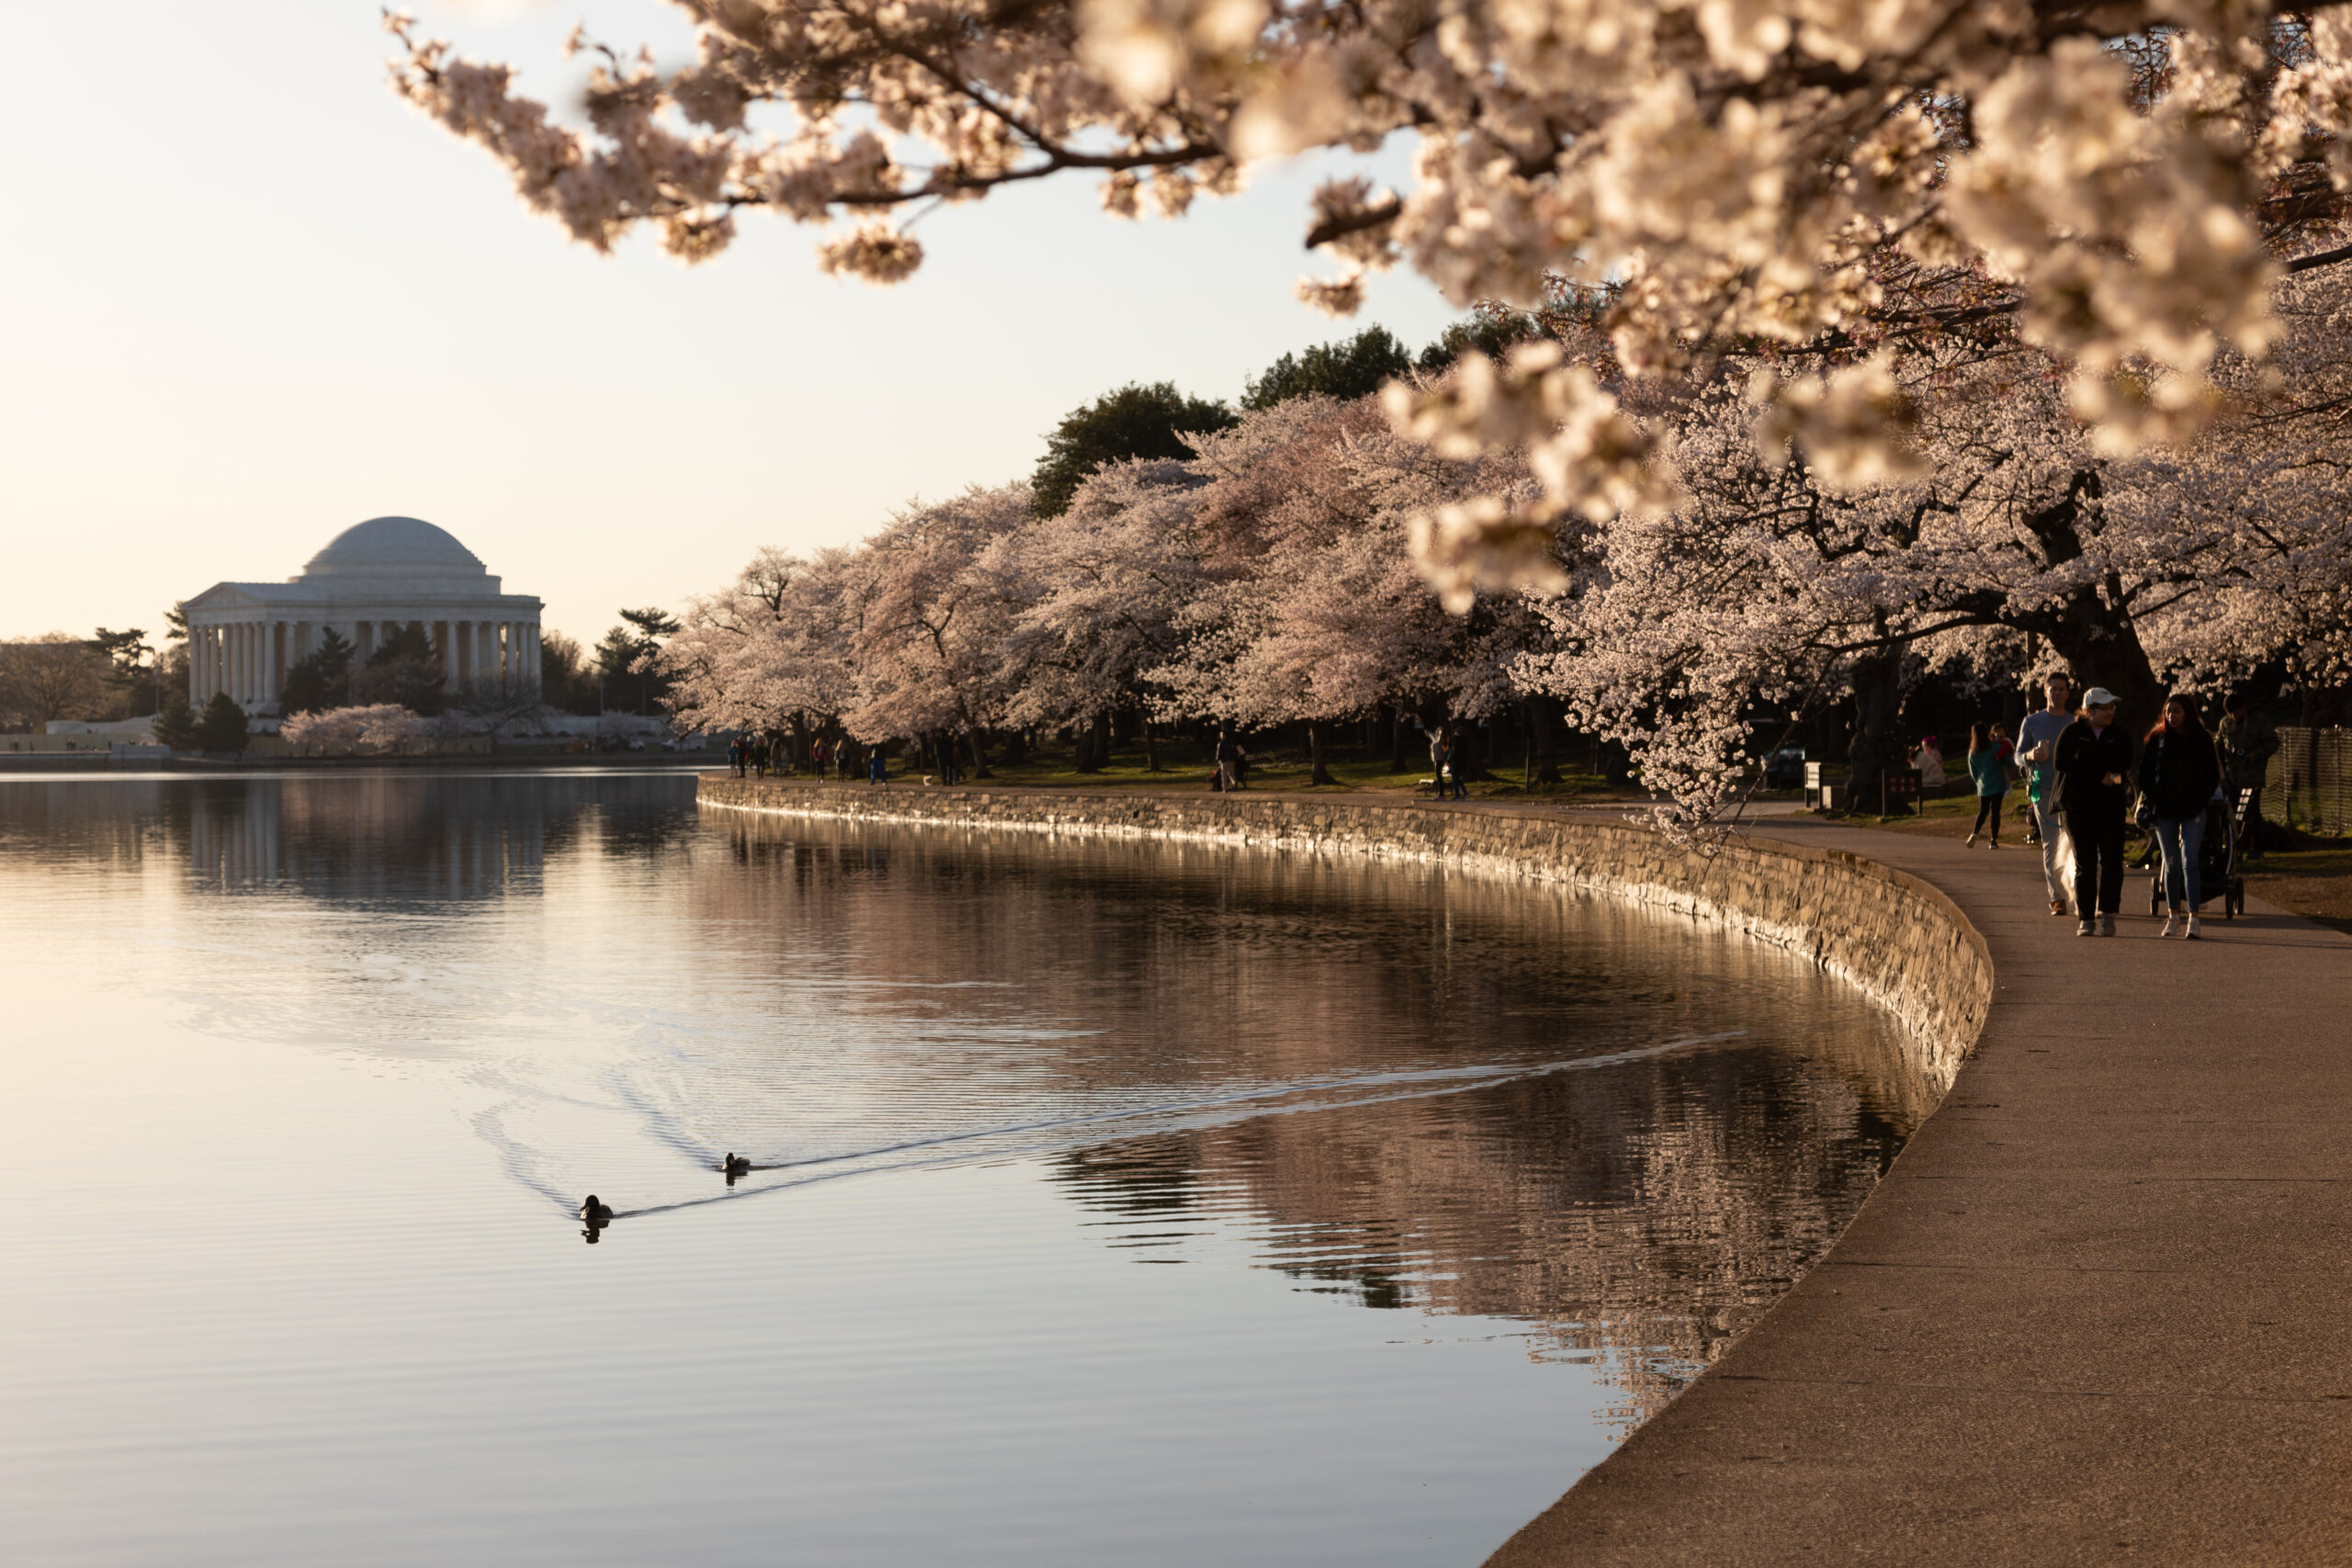
Tidal Basin with cherry blossoms and ducks (NPS photo)

By AMS President Anjuli S. Bamzai

Blossoming cherry trees are stars of springtime in Washington, D.C., and the most popular place to visit the cherry blossom trees is the Tidal Basin. Their bloom is one of the most joyful events of the year, awaited with much anticipation by tourists, meteorologists, local businesses, and the National Park Service.

Celebrating the friendship between the Japanese and American peoples, the Tidal Basin cherry trees were a gift from the Mayor of Tokyo to the United States in 1912. While the precise timing of peak bloom varies from year to year (April 4 on average, driven largely by winter/early spring temperatures), peak bloom has been occurring earlier due to warming trends. Furthermore, a combination of rising sea level and sinking land has necessitated plans for a new seawall that requires many existing trees to be removed. Yet the government of Japan has promised new trees to replace those that were lost.

This year’s beautiful blossoms strongly reminded me of the remarkable contributions of Japanese Americans — in particular Japanese American meteorologists. Our science would be especially bereft without the contributions of several scientists who, after receiving their advanced degrees at the University of Tokyo in the so-called “Syono school” of dynamic meteorology, immigrated to the U.S. from postwar Japan. Among them were Tetsuya Fujita, Akio Arakawa, Akira Kasahara, Kikuro Miyakoda, Takio Murakami, Katsuyuki Ooyama, Michio Yanai, and of course, Syukuro ‘Suki’ Manabe, one of the three recipients of the Nobel Prize in Physics in 2021.

Celebrating AAPI Heritage Month, in this post I chose to showcase the contributions of the legendary Dr. Tetsuya Theodore ‘Ted’ Fujita. Nicknamed “Mr. Tornado,” he linked tornado damage with wind speed and in 1971, developed the Fujita scale for rating tornado intensity based on ground and/or aerial damage surveys. He is also recognized as the discoverer of downbursts and microbursts, which are serious potential threats to aviation safety. Thus his discoveries made aviation safer.

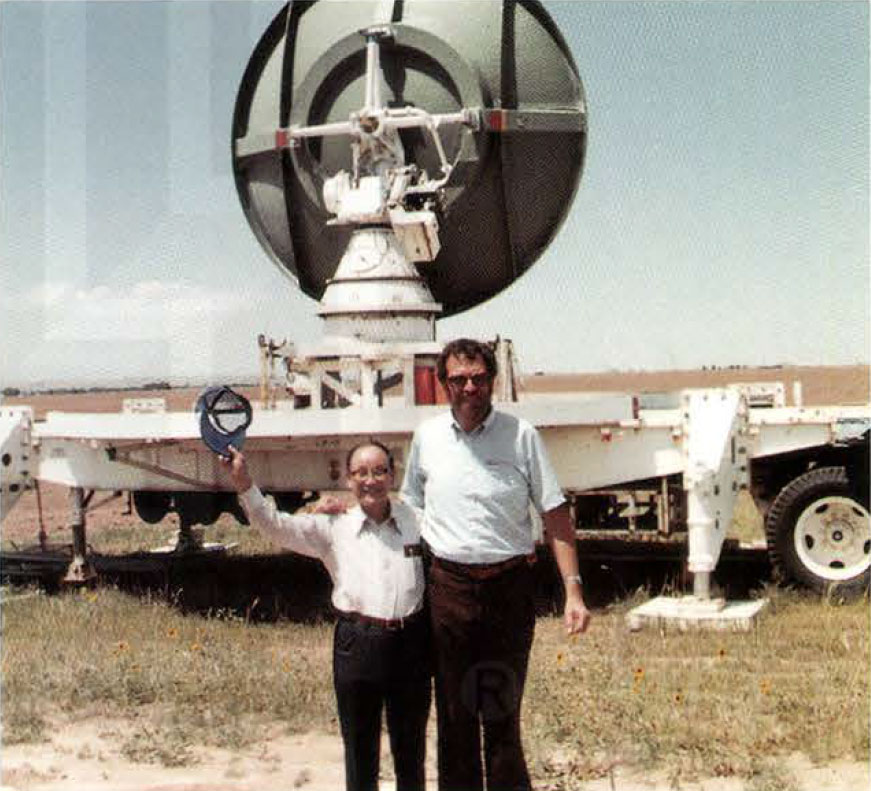
Fujita (left) with John McCarthy, Inaugural Director of NCAR-RAP/RAL, in 1982. After studying tornadoes for over two decades, Fujita had just seen his first one in person. Photo: Texas Tech, found in Fujita’s memoir, “Memoirs of an Effort to Unlock The Mystery of Severe Storms During the 50 Years, 1942–1992,” in the Texas Tech Southwest Collection/Special Collections Library.

But let’s take a step back. How did Fujita get interested in tornadoes in the first place? In part, his involvement was yet another legacy of the Manhattan Project: Fujita began his life’s work studying damage in Hiroshima and Nagasaki in the aftermath of the atomic bombs.

Fujita was working as assistant professor in physics at Meiji College of Technology in Tobata, exactly halfway between the two cities. A couple of years earlier, in compliance with his dying father’s wishes, he had opted to go to Tobata for his studies in mechanical engineering rather than Hiroshima. In the month following the bombings, Fujita and his team of students went on an observational mission to study the blast zones at both sites. At Nagasaki, through studying the burn marks of various objects, Fujita had the goal of estimating the position of the atomic bomb when it exploded. At ground zero, most trees, though scarred black by radiation, were still standing upright while buildings were in ruins. Seen from above, it looked like a giant starburst pattern.

After WWII ended, he joined the University of Chicago. By a stroke of genius, the Japanese American meteorologist was able to draw comparisons between severe weather and the nuclear shock waves he had studied some twenty-five years earlier at Hiroshima and Nagasaki, through studying the debris and damage of tornadoes before cleanup. He led the development of the Fujita Scale to categorize tornado intensity, a modified version of which remains in use today.

Following the Super Outbreak of 3–4 April, 1974, which covered over 2,600 miles and produced nearly 150 tornadoes in an 18-hour period, Fujita carried out aerial and ground damage surveys covering over 10,000 miles. Through meticulous analysis of the observational data, he demonstrated the existence of smaller tornadoes — suction vortices — within the parent tornado. The aerial surveys also led to the discovery of microbursts.

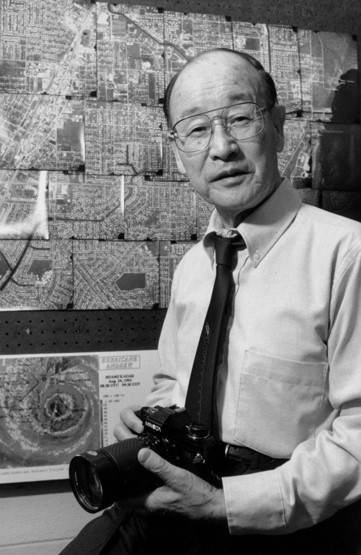
Photo: Dr. Fujita as a professor of Geophysical Sciences at the University of Chicago, photo taken in April 1961. Special Collections Research Center, University of Chicago Library.

You can read more about his discovery of the downburst and its contributions to aviation safety (including his work as a principal investigator for the National Intensive Meteorological Research On Downburst [NIMROD] project) here.

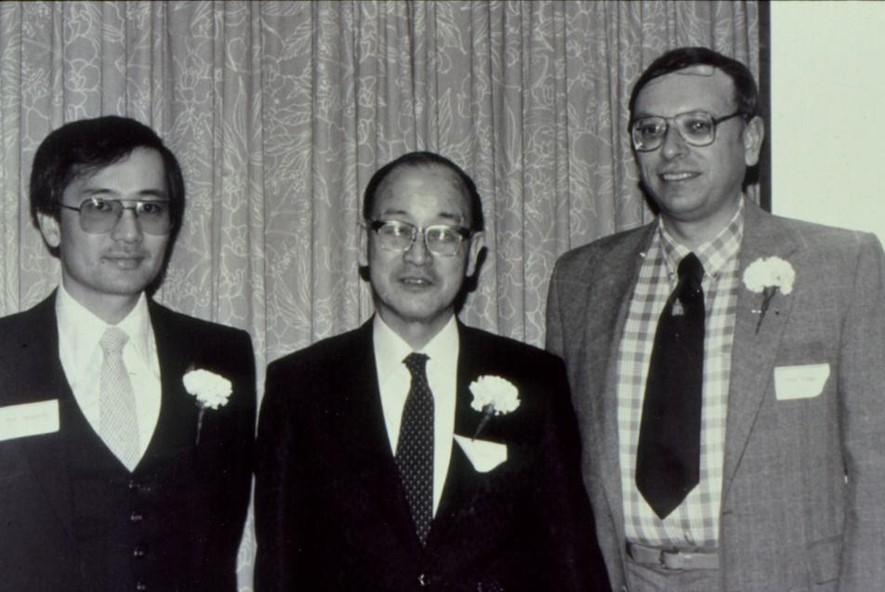
In 2000, two of his former students organized the “Symposium on the Mystery of Severe Storms: A Tribute to the work of T. Theodore Fujita,” held at the 80th AMS Annual meeting. They were none other than Gregory S. Forbes from The Weather Channel and Roger M. Wakimoto from UCLA, both distinguished meteorologists in their own right. Roger was of course our AMS President in 2017–2018. The photo below shows the three of them at an event at the University of Chicago from the early 1980s.

Dr. Roger Wakimoto (left), Dr. Ted Fujita (middle) and Dr. Gregory Forbes (right), taken in the early 1980s when all were at the University of Chicago. Photo Courtesy of Roger Wakimoto, honorary member of the AMS.

You can read the proceedings of the Symposium here to get a fuller sense of Fujita’s immense contributions to atmospheric science. In this short piece, I have barely scratched the surface.

You can also learn about Fujita through the PBS American Experience series, which describes events and people who have shaped the landscape over the course of history. Fujita is profiled in the episode titled, “Mr. Tornado.”

Featured image: Cherry blossoms surround the Tidal Basin in Washington, D.C. Photo: National Park Service, Kelsey Graczyk

Anjuli is grateful to Katherine ‘Katie’ Pflaumer for providing useful edits.

Wilder Weather: Data and Science in the Novel, The Long Winter

Even tall tales have their facts, but in historical fiction the myriad factual details often far outshine the story itself. In the ever popular books of Laura Ingalls Wilder, the telling details turn out to be the truly epic—and real—weather of the past. Barbara Mayes Boustead (University of Nebraska—Lincoln) and her coauthors show us in a recent BAMS article that Wilder’s, The Long Winter, isn’t just good history wrapped into a great novel–it’s also valuable climate data.

The cold, snowy season of 1880-81 featured in The Long Winter was strikingly difficult across much of the Plains and Midwest. A number of accounts have referred to it as the “Hard Winter” or “Starvation Winter.” Wilder’s story, set in De Smet, Dakota Territory (present-day South Dakota; 60 km west of Brookings), is fiction, but it contains many verifiable facts about the weather.

Clearing snowBoustead and co-authors Martha D. Shulski and Steven D. Hilberg set out to determine which parts of Laura’s stories are based in fact, and in the process, filled in the gap left by the absence of analysis or documentation in scientific literature about the Hard Winter of 1880-81. In the process, Boustead et al. show that the Hard Winter places recent severe winters, such as 2013-14, into context.
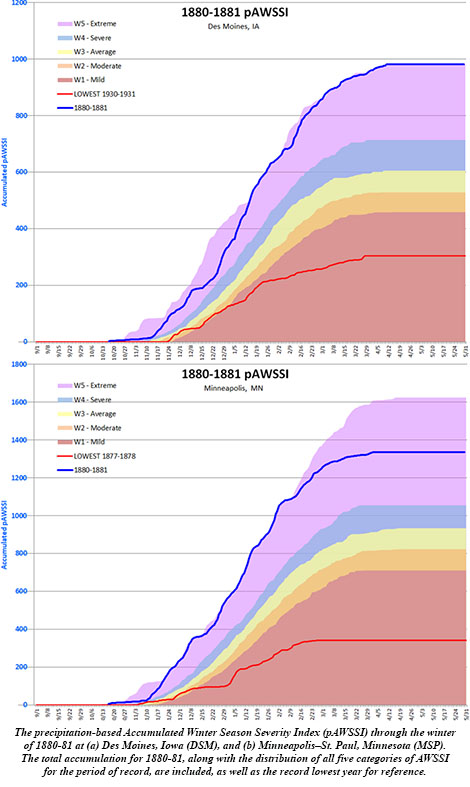
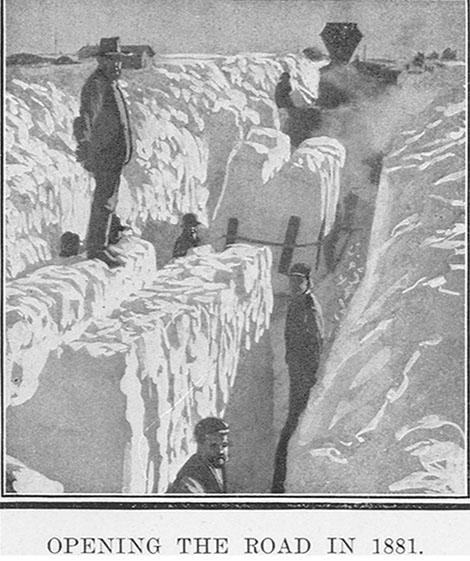
The winter began early, with a blizzard in eastern South Dakota and surrounding areas in mid October. Following a respite thereafter, wintry conditions returned by mid-November, followed by a number of snow and potential blizzard events in December. After a cold but relatively snow-free period, storm frequency increased from early January through February, producing snow almost daily in eastern South Dakota. In March, most days remained below freezing, though snowfall frequency decreased. Cold conditions continued into the first half of April. The BAMS article goes into detail describing why the winter of 1880-81 was so severe.

pAWSSIBAMS asked a few questions of Boustead to gain insight into her research. A sampling of answers are below:
BAMS: What would you like readers to learn from your article?

Barbara Mayes Boustead: Literature and other creative work can provide windows into past weather events and climates – including everything from documentary evidence to the impacts of those events on individuals and communities. We can connect those works to other historical weather data sources, from observations to reanalysis data, to reconstruct what occurred during these noted events, and why. By researching weather and climate related to a popular-interest subject like Laura Ingalls Wilder and the Little House stories, I have been able to reach audiences that otherwise might not have been so engaged, sparking interest in weather and climate by presenting it through Laura’s perspective.

BAMS: How did you become interested in investigating the weather of Wilder’s book?

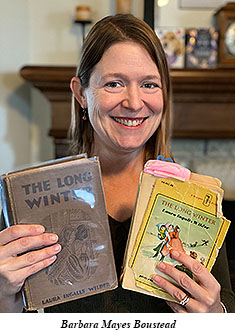
Boustead_PhotoBarbara Mayes Boustead: The Long Winter research began over a decade ago as I reread the book as a “comfort read” on the tail end of a winter, reminding myself that even the longest winters do eventually end. I’ve been reading Laura Ingalls Wilder’s books since I was in elementary school, and I had always wondered if the winter was really as Wilder had described it. And then I got to thinking – I am a meteorologist, and I have the tools to look it up! The deeper I dug, the more that my questions led to more questions. I especially got excited as I found data that verified much of the weather that Wilder had described. And I knew I had found a resonant topic when I presented the work at a conference called LauraPalooza in 2010 (it’s real and it’s serious!) and was overwhelmed with questions and discussion following my presentation.
BAMS: What got you initially interested in weather and, more importantly, these novels?

Barbara Mayes Boustead: It seems that many meteorologists started with either a memorable event or a fear of a weather phenomenon. I was in the latter group, afraid of thunderstorms in my preschool years. My mother and sister took me to the library so that I could read books about weather, hoping that understanding would help me conquer fear. I had plowed through all of the books in the library in about a year, and I was hooked! As for my interest in Laura Ingalls Wilder, I can again thank my mom and books. She purchased Little House on the Prairie for me at a garage sale when I was in first grade and ready for chapter books. I turned my nose up at it, but she encouraged me to give it a chance. I did, and of course, Mom knows best – I was hooked and plowed through the rest of the book series, too.

BAMS: What surprised you the most in doing this research?

Barbara Mayes Boustead: Laura Ingalls Wilder was an excellent weather observer. Having researched the winter of 1880-81 extensively, as well as the rest of the identifiable weather and climate phenomena throughout the Little House books, I found that while many elements of the books were fictionalized, she recounted weather and climate events with great accuracy. Almost every weather or climate detail in her books really did occur and usually occurred just as she described it. She occasionally moved some timelines around, but the events themselves were spot-on.

BAMS: What was the biggest challenge you encountered in the research?

Barbara Mayes Boustead: There were times during my research that I would have gone to great lengths to obtain true snowfall measurements from one of the observing sites near the area of interest, or to fill in the spatial gaps. Snowfall data just don’t exist for the central U.S. in the early 1880s.

BAMS: What’s next?

Barbara Mayes Boustead: Research into the weather and climate of Laura Ingalls Wilder’s books and life continues as I work to document other weather and climate events from her other books and stories. Given the popular interest in Laura Ingalls Wilder, some of the research is and will be written for broader audiences, providing a window into the world of science (meteorology and climatology) for non-specialists by standing on the shoulders of Laura Ingalls Wilder’s storytelling and characters. What began as a side project has transitioned into decades worth of research and storytelling! Her books include everything from tornadoes and hail storms to blizzards, droughts to floods, extreme cold to extreme heat. There is fodder for research for years to come!

“Decision-making under meteorological uncertainty” for D-Day’s Famous Forecast

The success of the D-Day Invasion of Normandy was due in part to one of history’s most famous weather forecasts, but new research shows this scientific success resulted more from luck than skill. Oft-neglected historical documentation, including audio files of top-secret phone calls, shows the forecasters were experiencing a situation still researched and practiced today: “decision-making under meteorological uncertainty.”

New research recently published in BAMS into that weather forecast for June 6, 1944, which enabled the Allies in World War II to gain a foothold in Europe, answers questions about three popular perceptions: were the forecasts, which predicted a break in the weather, that good? were the German meteorologists so ill-informed, missing that weather-break? and was the American analog system for prediction so great and better than what the Germans had?

The “alleged” weather break

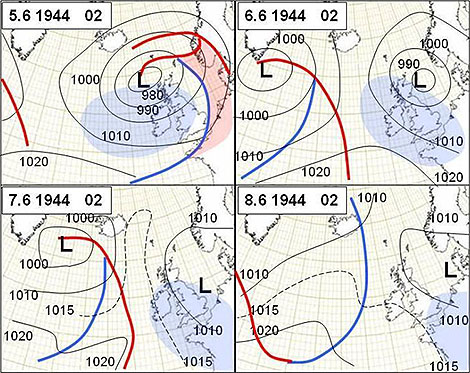
An expected ridge and fair weather between two areas of low pressure, one departing and one arriving over the area, didn’t materialize. The departing low instead lingered and created a lull in visibility and lifted the cloud ceiling height, but it didn’t slow winds much. They blew at Force 4-5 (~13-24 mph), creating very choppy seas that sickened many troops prior to the invasion.

Synoptic analyses at 00 UTC from 5 to 8 June 1944. The low that was supposed to move northeast to southern Norway remained over the North Sea for some days. On 6 and 8 June the observed winds in the Channel were force 4 and occasionally force 5.
Synoptic analyses at 00 UTC from June 5-8, 1944. The low that was supposed to move northeast to southern Norway remained over the North Sea for some days.


A blown German Forecast?

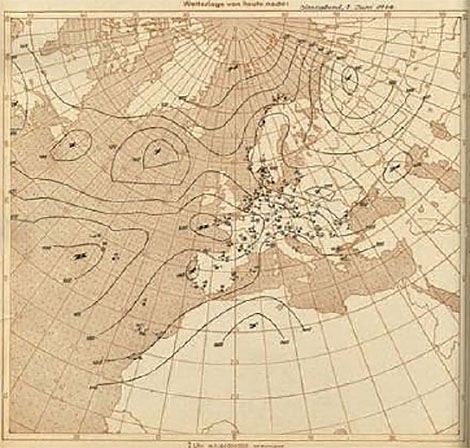
Because the invasion came as a complete surprise to the Germans it has been surmised their weather forecast for June 6 had to be bad. German forecasters prior to the war were the best at “extended” forecasts, and their synoptic maps and forecast for that day were more realistic than the Allies, with a less optimistic speculation of any break in the weather.

The German's European-Atlantic map at 00 UTC June 6, 1944, where the analysis over the North Atlantic appears not to be based on observations but intercepted American coded analyses.
The German’s European-Atlantic map at 00 UTC June 6, 1944, where the analysis over the North Atlantic appears not to be based on observations but intercepted American coded analyses.


A historically debated forecast

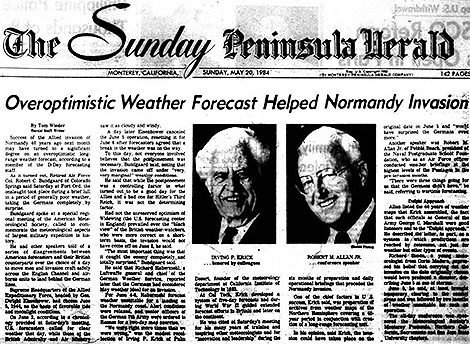
The analog weather prediction system employed by the Allies for the invasion was claimed by its creators to have correctly identified the weather break. But historical analysis and review doesn’t bear this out. What it does find, though, is that the system correctly identified a transition from zonal to meridional flow, which delivered the break the Allies needed for success. History’s finding: The forecast was “Overoptimistic.”

The 1984 Fort Ord meeting about the D-Day forecast got coverage in the local Monterey newspapers. The invasion was said to have occurred in a "break" or a period of a "brief lull" in the weather.
The 1984 Fort Ord, California, AMS meeting about the D-Day forecast got coverage in the local Monterey newspapers. The American forecasting group was led by Lt. Col. (Dr.) Irving Krick of Caltech. The president of the Naval Post Graduate School, Robert Allen, Jr., at the time an Air Force officer conducting high-level weather briefings at the Pentagon, also spoke at the meeting.


As a lesson learned from this most famous of weather forecasts, the paper’s author, Anders Persson of Swedin’s Uppsala University, concludes:

It was 75[+] years ago and the observational coverage has improved tremendously since then, both qualitatively and quantitatively. Our understanding of the atmosphere is much better,and the forecast methods have reached a standard that could hardly have been dreamt of in 1944. However, there’s one element that has a familiar ring to it and is of great interest today. That is when Air Marshall Tedder [Deputy Supreme Commander of the Invasion under General Eisenhower] asks about an assessment of the confidence in the forecast he has just heard … This illustrates that the D-day forecast is a significant early example of decision-making under meteorological uncertainty.

"Decision-making under meteorological uncertainty" for D-Day's Famous Forecast

The success of the D-Day Invasion of Normandy was due in part to one of history’s most famous weather forecasts, but new research shows this scientific success resulted more from luck than skill. Oft-neglected historical documentation, including audio files of top-secret phone calls, shows the forecasters were experiencing a situation still researched and practiced today: “decision-making under meteorological uncertainty.”
New research recently published in BAMS into that weather forecast for June 6, 1944, which enabled the Allies in World War II to gain a foothold in Europe, answers questions about three popular perceptions: were the forecasts, which predicted a break in the weather, that good? were the German meteorologists so ill-informed, missing that weather-break? and was the American analog system for prediction so great and better than what the Germans had?
The “alleged” weather break
An expected ridge and fair weather between two areas of low pressure, one departing and one arriving over the area, didn’t materialize. The departing low instead lingered and created a lull in visibility and lifted the cloud ceiling height, but it didn’t slow winds much. They blew at Force 4-5 (~13-24 mph), creating very choppy seas that sickened many troops prior to the invasion.

Synoptic analyses at 00 UTC from 5 to 8 June 1944. The low that was supposed to move northeast to southern Norway remained over the North Sea for some days. On 6 and 8 June the observed winds in the Channel were force 4 and occasionally force 5.
Synoptic analyses at 00 UTC from June 5-8, 1944. The low that was supposed to move northeast to southern Norway remained over the North Sea for some days.

 
A blown German Forecast?
Because the invasion came as a complete surprise to the Germans it has been surmised their weather forecast for June 6 had to be bad. German forecasters prior to the war were the best at “extended” forecasts, and their synoptic maps and forecast for that day were more realistic than the Allies, with a less optimistic speculation of any break in the weather.
The German's European-Atlantic map at 00 UTC June 6, 1944, where the analysis over the North Atlantic appears not to be based on observations but intercepted American coded analyses.
The German’s European-Atlantic map at 00 UTC June 6, 1944, where the analysis over the North Atlantic appears not to be based on observations but intercepted American coded analyses.

 
A historically debated forecast
The analog weather prediction system employed by the Allies for the invasion was claimed by its creators to have correctly identified the weather break. But historical analysis and review doesn’t bear this out. What it does find, though, is that the system correctly identified a transition from zonal to meridional flow, which delivered the break the Allies needed for success. History’s finding: The forecast was “Overoptimistic.”
The 1984 Fort Ord meeting about the D-Day forecast got coverage in the local Monterey newspapers. The invasion was said to have occurred in a "break" or a period of a "brief lull" in the weather.
The 1984 Fort Ord, California, AMS meeting about the D-Day forecast got coverage in the local Monterey newspapers. The American forecasting group was led by Lt. Col. (Dr.) Irving Krick of Caltech. The president of the Naval Post Graduate School, Robert Allen, Jr., at the time an Air Force officer conducting high-level weather briefings at the Pentagon, also spoke at the meeting.

 
As a lesson learned from this most famous of weather forecasts, the paper’s author, Anders Persson of Swedin’s Uppsala University, concludes:

It was 75[+] years ago and the observational coverage has improved tremendously since then, both qualitatively and quantitatively. Our understanding of the atmosphere is much better,and the forecast methods have reached a standard that could hardly have been dreamt of in 1944. However, there’s one element that has a familiar ring to it and is of great interest today. That is when Air Marshall Tedder [Deputy Supreme Commander of the Invasion under General Eisenhower] asks about an assessment of the confidence in the forecast he has just heard … This illustrates that the D-day forecast is a significant early example of decision-making under meteorological uncertainty.

Eight Decades: Mapping New England Catastrophe

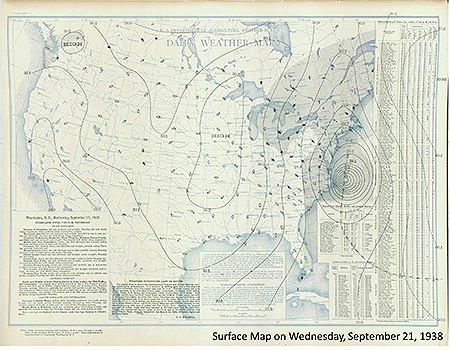
Eighty years ago today (September 21st), the Great New England Hurricane of 1938 ripped across New York’s Long Island and slammed into the Northeast, killing more than 600 people and clawing its way across New England and the record books. Every hurricane to strike the region since is compared to this behemoth, and none has come close to its devastating intensity.

U.S. Weather Bureau surface weather map for 7:30 a.m. ET Wednesday, September 21, 1938.

 
Ferocious winds gusting beyond category 5 intensity and an enormous storm surge that wiped out coastal Long Island and flooded into Rhode Island and Connecticut were its hallmarks. Copious rains also brought by the hurricane fell on soils swamped by heavy rain just days before the storm, leading to widespread flooding and thousands of landslides. Eight decades. And its imprint is still being realized.
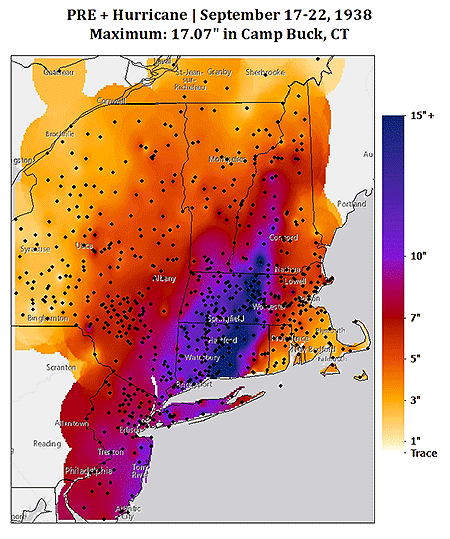
Recently, new precipitation data on the storm and a precursor heavy rain event—now understood to be ubiquitous before New England hurricanes—were found. This precipitation map (right) newly appears in the 2nd edition of Taken by Storm 1938: a comprehensive social and meteorological history of the Great New England Hurricane, by Lourdes B. Avilés, professor of meteorology at Plymouth State University.
Precipitation observed during the Great New England Hurricane and its predecessor rain event. (U.S. Geological Survey)
Precipitation observed during the Great New England Hurricane and its predecessor rain event.
(U.S. Geological Survey)

 
The map was created by a grad student Avilés was advising—Lauren Carter—who painstakingly digitized thousands of observations from more than 700 daily weather stations Avilés had unearthed, spanning the 6-day event. This unique updated rainfall map is just one of many new and interesting finds detailed in the new edition of her book, which is now available in the AMS Bookstore. The book’s website houses supplemental information, including more color rainfall maps, detailed reports, and photos.

1871 Hawaii Hurricane Strike Shows Lane's Imminent Danger Isn't Unprecedented

Powerful Hurricane Lane is forecast to skirt if not directly hit Hawaii as a slowly weakening major hurricane today and Friday. Its track is unusual: most Central Pacific hurricanes either steer well south of the tropical paradise or fall apart upon approaching the islands. But a recent paper in the Bulletin of the AMS reveals that such intense tropical cyclones menace Hawaii more frequently than previously thought.
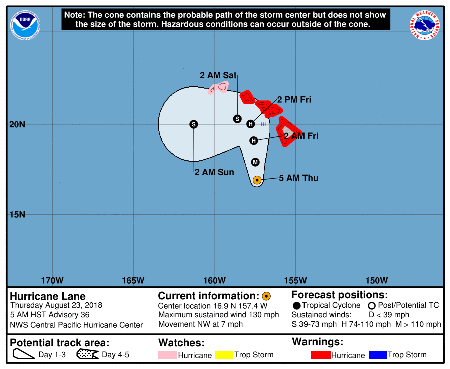
Hurricane Lane as of Thursday morning local time was packing sustained winds of 130 mph with gusts topping 160. Its expected track (below) is northward toward the middle islands today and early tomorrow, followed by a sharp left turn later Friday. When that left hook occurs will determine the severity of the impacts on Maui as well as Oahu, home to Hawaii’s capital and largest city, Honolulu. Although Lane is expected to slowly weaken due to increasing wind shear aloft, it appears that the Big Island of Hawaii, Maui, Molokai, and Oahu will be raked at a minimum by tropical storm winds gusting 55-70 mph, pounding surf, and heavy, potentially flooding rain. Hurricane conditions on these islands also are possible.

Three-day track forecast for Hurricane Lane's approach to Hawaii.
Three-day track forecast for Hurricane Lane’s approach to Hawaii (Central Pacific Hurricane Center).

The last major hurricane to affect the islands with more than swells and heavy surf was Hurricane Iniki in 1992. It was passing well south of the islands when an approaching upper-air trough brought in steering flow out of the south, and Iniki made a right turn toward the western islands while intensifying into a strong Category 4 hurricane. It slammed directly into the garden island of Kauai with average winds of 145 mph and extreme gusts that damaged or destroyed more than 90 percent of the homes and buildings on the island. Iniki obliterated  Kauai’s lush landscape, seen in its full splendor in such movies as Jurassic Park, which was filming there as the storm bore down.
The only other known direct hit on Hawaii was by 1959’s Hurricane Dot, which was a minimal Category 1 storm–the winds barely reaching threshold hurricane intensity of 74 mph when its center crossed Kauai. Without any prior record of major hurricane landfall, Iniki was not just rare, it was considered unprecedented.
Until now.
More than a century before Iniki, a major hurricane crashed into the Big Island, its intense right-front quadrant passing directly over neighboring Maui, causing widespread devastation on both islands. Its discovery is outlined in Hurricane with a History: Hawaiian Newspapers Illuminate an 1871 Storm, which details the narrative thanks to an explosion of literacy on the islands in the mid 19th century, which led to hundreds of local language newspapers that published eyewitness accounts of the storm.
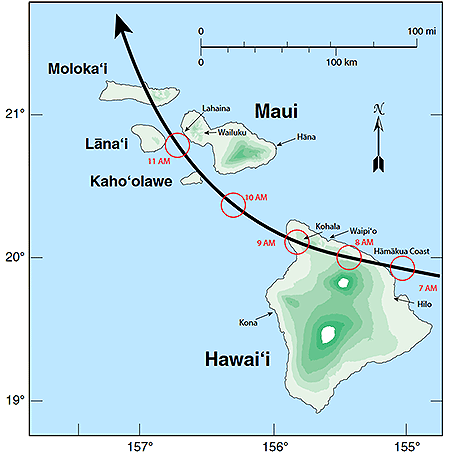
Map showing the reconstructed track of the Hawaii hurricane across the eastern islands of Hawaii and Maui on 9 Aug 1871. Labeled red circles indicate the approximate time and location of the core of the storm. Green shading shows terrain altitude every 2,000 ft (610 m).

The new historical research, published in the January 2018 BAMS, found unequivocal evidence of an intense hurricane that struck August 9, 1871, causing widespread destruction from Hilo on the eastern side of the Big Island to Lahaina on Maui’s west side. A Hawaiian-language newspaper archive of more than 125,000 pages digitized and now made publicly available along with translated articles contained account after account of incredible damage that led the paper’s authors to surmise that at least a Category 3 if not a Category 4 hurricane hit that day.
The paper’s analysis is put forth as “the first to rely on the written record from an indigenous people” of storms, droughts, volcanic eruptions, and other extreme natural events. Accounts published in Hawaiian newspapers create a living history of the 1871 hurricane’s devastation, as recounted in the paper:
“On the island of Hawaii, the hurricane first struck the Hāmākua coast and Waipi‘o valley. The following is from a reader’s letter from Waipi‘o dated 16 August 1871:”

At about 7 or 8 AM it commenced to blow and it lasted for about an hour and a half, blowing right up the valley. There were 28 houses blown clean away and many more partially destroyed. There is hardly a  tree  or  bush  of  any  kind  standing  in  the  valley (Pacific Commercial Advertiser on 19 August 1871).

“An eyewitness from Kohala on Hawaii Island wrote the following:”

The greatest fury was say from 9 to 9:30 or 9:45, torrents of rain came with it. The district is swept as with the besom of destruction. About 150 houses were blown down. A mango tree was snapped as a pipe stem, just above the surface of the ground. Old solid Kukui trees, which had stood the storms of a score of years were torn up and pitched about like chaff. Dr. Wright’s mill and sugarhouse, the trash and manager’s residence, were all strewn over the ground (Ke Au Okoa on 24 August 1871).

“On Maui, newspaper reports document that Hāna, Wailuku, and Lahaina were particularly hard-hit. A writer in Hāna described the storm:”

Then the strong, fierce presence of the wind and rain finally came, and the simple Hawaiian houses and the wooden houses of the residents here in Hāna were knocked down. They were overturned and moved by the strength of that which hears not when spoken to (Ka Nupepa Kuokoa on 26 August 1871).

“In Wailuku the bridge was destroyed:”

… the bridge turned like a ship overturned by the carpenters, and it was like a mast-less ship on an unlucky sail.” (Ka Nupepa Kuokoa on 19 August 1871).

“From Lahaina came the following report:”

It commenced lightly on Tuesday night, with a gentle breeze, up to daylight on Wednesday, when the rain began to pour in proportion, from the westward, veering round to all points, becoming a perfect hurricane, thrashing and crashing among the trees and shrubbery, while the streams and fishponds overflowed and the land was flooded (Pacific Commercial Advertiser on 19 August 1871).

The BAMS paper concludes that the 1871 hurricane was “a compact storm, similar to Iniki.” Honolulu escaped damaging winds or rain despite such a close encounter.
Because such historical records have been unnoticed for so long, the paper notes “a number of myths have arisen such as ‘the volcanoes protect us,’ ‘only Kauai gets hit,’ or ‘there is no Hawaiian word for hurricane.’”
Today’s powerful Hurricane Lane and the newfound historical records go a long way to dispelling these misconceptions about the threat of hurricanes in the Hawaiian Islands.
 

For Climate Science, Transitions Continue

The Inauguration of Donald Trump yesterday marked the end of the Transition. Yet, the end of the Transition with a big “T” marks the beginning of small “t” transitions for everyone else—political winners and losers alike.
According to Reed College historian Joshua Howe, climate science is particularly affected by such changes, absorbing and adapting to shifts in political winds for many decades. The continually transitioning relationship climate science has forged with politics—especially environmental politics—is chronicled in Howe’s book, Behind the Curve: Science and the Politics of Global Warming (Univ. of Washington Press, 2014).
As a past recipient of the AMS Graduate Fellowship in the History of Science, Howe presented the basics of his book at the 2009 AMS Annual Meeting. His dissertation was expanded into the book. In a recent interview at New Books Network (listen here), Howe explains how climate scientists have had to reinvent their approach to environmental advocacy. In Howe’s view, the approach politically active scientists took to triggering action on climate change simply didn’t work well, making the field ripe for further transition.
It was clear early on that climate change, as an environmental concern, was unprecedented in scale and complexity. Following on the debate in the 1970s over the nation’s Supersonic Transport program, atmospheric science had won a place at the environmental table. But environmentalists were used to dealing with local pollution and wilderness access—clear quality of life issues that resonated with their middle class constituency, Howe says. They were interested in concrete, simple, nontechnical issues they could rally around—and climate change was too complex to fit those parameters. Climate change wasn’t a low-hanging fruit ripe for political victories.
Meanwhile, the issue of nuclear winter provided a further, politically loaded impetus to the climate community, Howe said. But the result was a split, with some scientists becoming more politically outspoken within the environmental movement, while others became more entrenched within a conservative physical science community. As a result, the relationship of government funding to climate science became politically fraught.
Scientists initially reached out on climate change through the government agencies in the 1970s. Howe points out that “working within government bureaucracies left scientists vulnerable to political change.” The Carter administration shifted directions; Reagan then arrived with budget cuts and curtailed access to bureaucracy.
In response, many climate scientists sought a technical consensus that might force political action by the shear power of knowledge. The scientists attacking the problem in the 1970s onward had, as Howe puts it, a “naïve” attitude.
“Better knowledge, climate scientists believed, would lead to better policy,” Howe said in his 2009 AMS presentation. “Perhaps it is time for scientists to drop the false veil of political neutrality and begin discussing science and politics as two sides of the same coin.”
The AMS Annual Meeting in Seattle is an ideal opportunity to ponder the future of the atmospheric sciences during the next four years. Check out the Monday Town Hall on “Climate Change – How can we make this a national priority?” (12:15 p.m., Room 613). Then attend the panel session on priorities of the Trump Administration and Congress later that day (4 p.m., same room). The panelists include Ray Ban, Fern Gibbons, and Barry Lee Myers.

New AMS Book Remembers the Great New England Hurricane

It has been known by many names: the Yankee Clipper, the Great New England Hurricane, the Long Island Express . . . or simply the New England Hurricane of 1938. With fatalities estimated at between 500 and 700, it’s still the deadliest hurricane in modern New England history, and only Sandy last year was more costly (property damage from the ’38 storm amounted to almost $5 billion in 2013 dollars). Tomorrow is the 75th anniversary of the storm’s landfall as a Category 3 hurricane on Long Island, and to coincide with that occasion, the AMS has just released a new book about the event: Taken by Storm, 1938: A Social and Meteorological History of the Great New England Hurricane, by Lourdes B. Avilés. (To order the book, visit the AMS bookstore.) The first book to detail the science of the storm, it also delves into the Great Hurricane’s significant societal impacts. In the preface, Avilés discusses her motivation for writing the book:

My goal has not been to retell the story that has already been told, although there has to be some of that too, but to take a somewhat interdisciplinary approach to weaving together different aspects–different stories–of the 1938 Hurricane. This includes what happened before, during, and after the event, in the context of the meteorological history of the storm and its associated destruction and devastation; casualties, survival, and recovery in the affected population; environmental and geological changes caused by the storm; the science of hurricanes and of early-20th-century meteorology; and, finally, the added perspective of other intense hurricanes that have affected and no doubt will again affect the region.

AMS Director of Publications Ken Heideman, who wrote the foreword to Taken by Storm, 1938, recently talked to Avilés about the hurricane and her new book; the complete interview is below.