What’s the Value of a Weather Forecast?

"Colorado Flakes" by Henry Reges

Highlights from the CoFU2 study: Part 2

By Jeffrey K. Lazo

This is part two of my summary of the Communicating Forecast Uncertainty (CoFU) 2 study, a follow-up (based on a 2022 national survey) to the 2009 CoFU 1 study that examines how the U.S. public gets, perceives, uses, and values weather forecasts. In part one we discussed key findings and delved a bit deeper into who uses forecasts the most, what they use forecasts for, and where they get their forecasts from. Read part 1 here.

In this post, we’ll examine public satisfaction with weather forecasts, what people most want from a forecast, and how much money the general public thinks a forecast is worth.

How satisfied are people with weather forecasts?

As shown below, people are more satisfied with weather forecasts than before. Overall, satisfaction with weather forecasts on average was 4.03 on a 5-point scale (significantly higher than the 3.78 average in 2006). People with higher education, Latinos, those who use city-specific weather forecasts, and those who access forecasts purely out of interest were more satisfied. People who spent more leisure time outside or used forecasts to plan social activities, however, were less satisfied.

Interestingly, however, there has been a slight decrease when it comes to confidence in weather forecasts—specifically short-term (1-day) weather forecasts. Confidence in 3-day and longer forecasts increased between 2006 and 2022. We don’t know exactly why, and are curious to further explore this question. I am particularly interested in examining whether these changes in public perception actually track with differences in forecast performance.
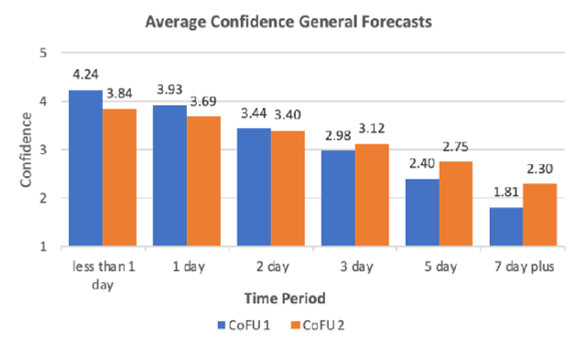
Average Confidence in Forecasts by Time Period and Survey Version 

Notes: The survey question asked, “How much confidence do you have in weather forecasts for the times listed below?” The times were listed as “Less than 1 day from now, “1 day from now,” and so on, out to “7 to 14 days from now.” (CoFU1 n = 1,465; CoFU2 n = 1,092). Source: CoFU2, Figure ES-5.

What weather factors matter most to people?

We asked survey respondents which components of a weather forecast were most important to them. In 2006, people most wanted to know when precipitation was going to occur. In 2022, however, high temperature took the top spot. This reflects an overall preference for precipitation information in 2006 vs. temperature information in 2022. That preference could be related to climate shifts, or it may simply be a reflection on when the surveys took place (November in 2006, May in 2022).
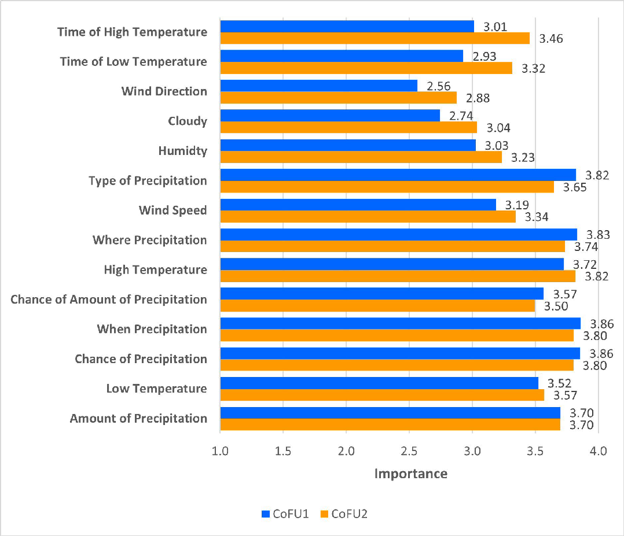
Mean Importance of Forecast Attributes Ranked by Difference between Surveys 

Notes: The survey question asked, “How important is it to you to have the information listed below as part of a weather forecast?” (CoFU1 n = 1,465; CoFU2 n = 1,092). Source: CoFU2, Figure ES-7.

How do people value weather forecasts?

We assigned each respondent a dollar value that they might hypothetically pay in taxes each year to support NWS products and services (including forecasts). We then asked whether NWS services were worth that amount, worth more, or worth less. Using those responses, we calculated the likelihood of saying it was worth that amount for each dollar value, and then calculated the median willingness to pay for weather forecasts as $898.50, with a 95% confidence interval of approximately $700-$1,300 per household per year as shown below.
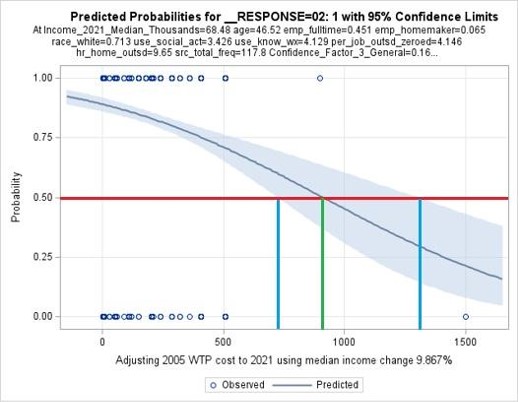
Fitted Demand Curve for Current Weather Forecast Information

Notes: The survey question asked “Do you feel that the services you receive from the activities of the NWS are worth more than, exactly, or less than $N a year to your household?” (CoFU2 data only n = 1,094). Source: CoFU2, Figure ES-10.

On average, people who were older, who were employed full time or were homemakers, who were white, who spent more recreational time outside, who used forecasts for social activities or just out of interest, and who highly valued knowing the daily high temperature were all less willing to pay for NWS forecasts. Those who spent more working time outside, used forecasts more frequently, placed more importance on NWS information, had more personal weather impacts, considered wind and cloud information more important, and who had greater total weather salience (a measure of attunement to and awareness of weather) were all more willing to pay for current forecasts. Related to the Cultural Theory of Risk, people who were identified as “individualists,” based on cultural risk theory, were significantly less likely to be willing to pay for forecasts. Individualists may perceive themselves to be less at risk from weather events.

If we can take the $898.50 median value as the average household willingness to pay, we can then aggregate this across the entire US population of about 120 million households. Accounting for the portion who say they don’t use forecasts, we calculate a total value to the US of about $102.1 billion for current weather forecast information. 

Like any large-scale study of human beings, this analysis has tried to be as representative and accurate as possible—and yet almost certainly has potential gaps. Hopefully CoFU2 provides a useful picture of weather forecasts and the U.S. public, but its results should be replicated and further studied if they are to be used to inform any real-world decisions. Access to weather information can be a life-and-death matter, and no decision about that should be taken lightly. Read the full study here.

Photo at top: “Colorado Flakes,” by Henry Reges, was a finalist in the 2022 AMS Weather Band Photo Contest.

How Does the U.S. Public Get its Weather Forecasts?

Photo, 'Striking Sunset'

Highlights from the CoFU2 Study: Part 1

By Jeffrey K. Lazo, PhD

In 2006, I, my National Center for Atmospheric Research (NCAR) colleagues Julie Demuth and Rebecca Morss, and Alan Stewart of The University of Georgia began designing and implementing a national study of weather forecast users. We wanted to understand how people are getting their forecasts, how they’re using them, and how much they’re worth to people. 15 years after that study was published, I have released the follow-up study: Communicating Forecast Uncertainty (CoFU) 2. Using essentially the identical 2022 survey, I replicate and extend the findings from the first survey for another look at the public’s relationship with weather forecasts. We believe that our 2022 survey reached a more representative proportion of the U.S. population, including younger adults and certain racial groups, compared with the survey in 2006. 

In this post–part one of two–I delve into a few of the key takeaways.

The big picture

This study estimates that members of the U.S. public access weather forecasts roughly 317 billion times per year—a 7.26% increase since 2006, driven largely by the increase in U.S. population. There was also a significant increase, however, in the number of survey respondents who said they never used weather forecasts. If this result is real, and not just an unusual result of the repeated survey implementation, it would be very important to understand why. Overall, people rated their satisfaction with weather forecasts high, but confidence in short-term (1-day) forecasts has decreased, while people were more confident in longer-term forecasts. 

To get their forecasts, people continue to shift toward sources like web pages and cell phones, from which they specifically seek out weather information, rather than more “passive” sources such as TV and public/private radio broadcasts. 

The estimated monetary value of forecasts to the U.S. public is $102.1 billion (which comes out to about 32 cents per forecast use). However, our approach to obtaining this value was limited, and we feel it should be used only as an estimate of the overall strength of people’s preferences for the information pending more rigorous studies.

Who’s using weather forecasts, and what for?

People with the following characteristics were more likely to say they used weather forecasts: Higher income, female, more highly educated, White, Black, Asian, Native, and those who spend leisure time outdoors.

The percentage of the surveyed population who said they never used weather forecasts increased from 3.62% in 2006 to 9.15% in 2022, a statistically significant difference. This was a basic yes/no question, so we don’t have good information about what people mean when they say they don’t use weather forecasts at all. It’s also possible that our latest survey did a better job of reaching people who don’t use weather forecasts. As noted above, if there has been a real decline in the number of people using forecasts this should be examined in more detail to determine why. 

According to the survey, the most common reason people checked a forecast was simply to know what the weather would be like (they may be simply monitoring the weather in case their plans change or the weather shifts dramatically). The next most common uses were for weekend activities, getting dressed, social activities, and travel. Job-related activities and commuting ranked last.

How and where are people getting their forecasts?

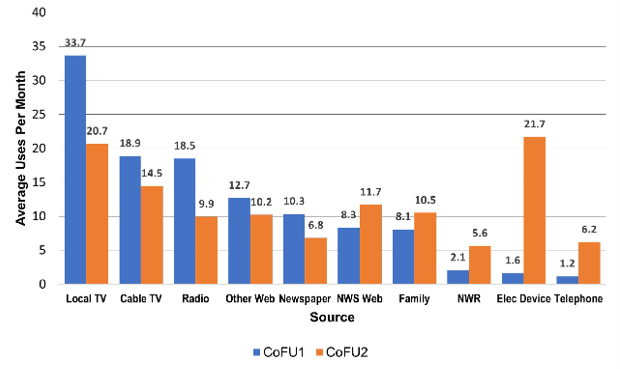
As shown in the figure below, usage of weather forecast sources such as TV, commercial and public radio, and newspapers has decreased since 2006. Notably, these are sources which tend to be more traditional and more “passive,” in that you may come across weather information without specifically looking for a forecast. Meanwhile, the use of more “modern” sources like NWS web pages, phones, and other electronic devices increased, along with the use of social connections and NOAA Weather Radio to find out about weather information. These days, people who use weather forecasts appear to be more likely to actively seek out this information.

Frequency of Use by Source by Survey Version 
Notes: The survey question asked, “How often do you get weather forecasts from the sources listed below?” Response options ranged from “Rarely or never” to “Two or more times a day,” and were conservatively recoded into times per month. (CoFU1 n = 1,465; CoFU2 n = 1,092). Source: CoFU2, Figure ES-2.

The number of times that the average person accessed weather information each month slightly increased between 2006 (115.4) and 2022 (117.8), but the difference was not statistically significant. Time of forecast access has shifted slightly earlier in the day on average, which we suspect may be related to the shift away from TV forecasts, or possibly an increase in people who work from home since the onset of the COVID pandemic.

Tune in for part 2 of this summary to learn more about what people are looking for from weather forecasts, and how we arrived at an economic value for those forecasts. Or, you can read the full study here.

Photo at top: “Striking Sunset,” by Liz Kemp, was an entry in the 2023 AMS Weather Band Photo Contest.

What’s the Future of Weather Decision-Making?

A 2024 AMS Summer Community Meeting highlight

Matt Corey

The AMS Summer Community Meeting drew exceptional attendance and engagement this year as people across sectors helped inform an upcoming report on the Weather Enterprise. The AMS Weather Enterprise Study will provide a comprehensive picture of the shifting landscape of weather-related fields to inform our joint future. At the 2024 SCM, working groups discussed what they’d found about key issues facing the enterprise, and asked for feedback from the community.

Here are a few takeaways from the Decision Support Services working group, as reported by Matt Corey (pictured at left) of Microsoft Weather. Decision support services (DSS) help stakeholders make weather-related decisions that are informed by the best available knowledge across fields. They are crucial for emergency managers and many other decision makers, as well as members of the public.

How has the decision support landscape shifted in the last decade or so?

Stakeholders for DSS range from an emergency manager making critical decisions about an entire community to an everyday citizen making a decision for themselves or their family. For decision support services, the last two decades have seen an abundance of technology changes which have allowed stakeholders easier access to information. However, this can be both a benefit and a challenge, as misinformation has also become more readily available.

What were the main themes that came out of your working group’s discussions?

The themes that emerged for us included:

  • The different sectors of the Weather Enterprise have become coupled, with less well-defined boundaries when it comes to providing decision support.
  • New players are entering the enterprise, with growing AI and novel ideas.
  • Developing and maintaining the necessary workforce is a concern.
  • There are increased opportunities for translating forecasts into easily understood language in order to support decisions.
  • There is a need for increased funding for quality observational datasets for many applications, especially in AI.
  • In a complex, misinformation-rich environment, there is still room for all sectors to tailor communications to stakeholders, but there is also concern about maintaining consistency in order to maintain trust.
  • Embracing user centric design to understand stakeholder concerns, technical levels, and understanding is important, including the use of probabilistic information.  Example:  “There is an 80% chance the flooding will happen this afternoon.”

What are the main challenges you have identified?

In our group, the discussion continues to be about who should be providing decision support services. As the NWS gets more involved in DSS, one concern is for increased friction from some private sector entities. Another key point is that DSS is not limited to a specific stakeholder type. DSS is important to all citizens who need to make decisions involving weather every day, thus there is a shared dimension and need for responsible and clear messaging to all stakeholders (including the tactical use of probabilistic information). 

A final recurring theme is around the workforce itself. Forecasters need to be taught communication skills, and social science is critical in helping to understand the needs and problems to be solved for the end users. With the focus shifting to newer tools including AI-infused capabilities, there is a concern that the new workforce will lose the necessary skills critical in conveying adequate decision support services.

What preliminary/tentative recommendations, solutions, or future directions have you discussed?

Some of the recommendations we’re working with right now focus on:

  • Integration of weather, water, and climate information with socioeconomic and biosphere information for earth system forecasts.
  • Cross-sector support of ecological forecasts and environmental early warning systems (for example, warnings of fishing industry impacts due to warmer water) to benefit society and facilitate impact-based action.
  • Improved communication about weather impacts, especially in a changing climate, using common terms and learnings based on stakeholder’s decision needs.
  • Embracing AI as a way to increase the velocity of forecasts, integrate probabilistic information into forecasts, and increase efficiency for both short-term services like nowcasting and long-term climate solutions for all.
  • Helping meteorologists to become the communicators that they should be. Leveraging AI solutions and tools to help make them more efficient at helping stakeholders with their decisions.
  • Expanding opportunities for smaller businesses/individuals to obtain specialized DSS.
  • Increased public awareness of changing weather patterns stimulating the need for better accuracy, earlier warnings, and long-range projections.
  • The need to smartly integrate probabilistic information to help stakeholders better understand forecasts and limitations.

Want to join a Weather Enterprise Study working group? Email policy@ametsoc.org.

About the Weather Enterprise Study

The AMS Policy Program, working closely with the volunteer leadership of the Commission on the Weather, Water, and Climate Enterprise, is conducting a two-year effort (2023-2025) to assess how well the weather enterprise is performing, and to potentially develop new recommendations for how it might serve the public even better. Learn more here, give us your input via Google Forms, or get involved by contacting policy@ametsoc.org.  

About the AMS Summer Community Meeting

The AMS Summer Community Meeting (SCM) is a special time for professionals from academia, industry, government, and NGOs to come together to discuss broader strategic priorities, identify challenges to be addressed and opportunities to collaborate, and share points of view on pressing topics. The SCM provides a unique, informal setting for constructive deliberation of current issues and development of a shared vision for the future. The 2024 Summer Community Meeting took place August 5-6 in Washington, DC, and focused special attention on the Weather Enterprise, with opportunities for the entire community to learn about, discuss, debate, and extend some of the preliminary findings coming from the AMS Weather Enterprise Study.

How Much Was That Forecast Worth?

Despite the general good fortune that the storm stayed out at sea, there are plenty of grumblings about the cost of Hurricane Earl and more specifically the cost of preparing for it:

Last week’s storm was forecast to be the strongest to hit Long Island’s East End in nearly twenty years. And to handle possible outages, the Long Island Power Authority brought in 1,600 workers from out of state, at an estimated cost of $30 million. LIPA’s budget — already reeling from combating four major storms earlier this year — is now even further in the red.

(Fortunately, LIPA wisely understands the risks that Earl posed:

However, because the storm was supposed to hit such a wide area, LIPA says if it had to do it all over again, it still would’ve brought in those extra workers.)

And further north:

Airlines canceled dozens of flights into New England, and Amtrak suspended train service between New York and Boston….Massachusetts officials estimated that Cape Cod lost about 10 percent of its expected Labor Day weekend business, but were hopeful that last-minute vacationers would make up for it. Gov. Deval Patrick walked around Chatham on Saturday morning, proclaiming, “The sun is out and the Cape is open for business.”

So, as a palliative while people continue to grouse about paying the costs of meteorological uncertainties, read Mike Smith’s post about the savings this time when 450 miles of coastal warnings were issued compared to the much broader-brush (1,500 coastline miles warned) for Hurricane Floyd in 1999.

Instead of warning the entire East Coast as we had to during Floyd, the science of meteorology correctly identified that only the two areas (outer banks and far east Massachusetts) were at risk and warned accordingly. The forecast change in Earl’s direction of movement and rate of weakening were both remarkably good considering this forecast was two days out.

Taking NOAA’s calculations for evacuation costs per mile of coastline, and a reduction of 1,050 miles of warnings in similar situations, and do the math:

OK, now take those 1,050 miles and multiply them by a conservative figure of $700,000 in savings for each mile that correctly was not warned = $735 million dollars! ….And, when you figure in the value-added private sector hurricane forecasts issued by companies like WeatherData and its parent company AccuWeather, the savings grow further, perhaps approaching a billion dollars in total when the correct landfall forecast for Canada is factored in.

Clearly this depends on whether people actually evacuated based on the warnings, but the progress is clear, nonetheless, as are the positive benefits of recent improvements in track forecasts.