What’s the Future of Weather Decision-Making?

A 2024 AMS Summer Community Meeting highlight

Matt Corey

The AMS Summer Community Meeting drew exceptional attendance and engagement this year as people across sectors helped inform an upcoming report on the Weather Enterprise. The AMS Weather Enterprise Study will provide a comprehensive picture of the shifting landscape of weather-related fields to inform our joint future. At the 2024 SCM, working groups discussed what they’d found about key issues facing the enterprise, and asked for feedback from the community.

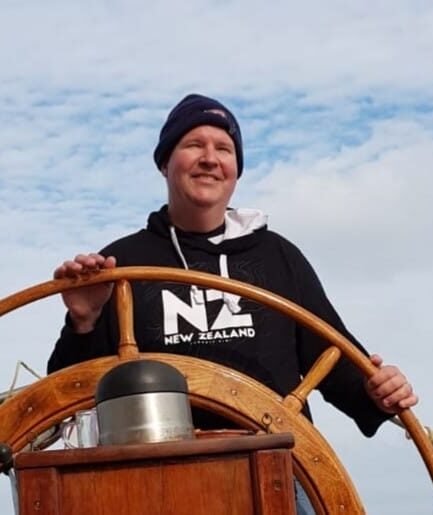
Here are a few takeaways from the Decision Support Services working group, as reported by Matt Corey (pictured at left) of Microsoft Weather. Decision support services (DSS) help stakeholders make weather-related decisions that are informed by the best available knowledge across fields. They are crucial for emergency managers and many other decision makers, as well as members of the public.

How has the decision support landscape shifted in the last decade or so?

Stakeholders for DSS range from an emergency manager making critical decisions about an entire community to an everyday citizen making a decision for themselves or their family. For decision support services, the last two decades have seen an abundance of technology changes which have allowed stakeholders easier access to information. However, this can be both a benefit and a challenge, as misinformation has also become more readily available.

What were the main themes that came out of your working group’s discussions?

The themes that emerged for us included:

  • The different sectors of the Weather Enterprise have become coupled, with less well-defined boundaries when it comes to providing decision support.
  • New players are entering the enterprise, with growing AI and novel ideas.
  • Developing and maintaining the necessary workforce is a concern.
  • There are increased opportunities for translating forecasts into easily understood language in order to support decisions.
  • There is a need for increased funding for quality observational datasets for many applications, especially in AI.
  • In a complex, misinformation-rich environment, there is still room for all sectors to tailor communications to stakeholders, but there is also concern about maintaining consistency in order to maintain trust.
  • Embracing user centric design to understand stakeholder concerns, technical levels, and understanding is important, including the use of probabilistic information.  Example:  “There is an 80% chance the flooding will happen this afternoon.”

What are the main challenges you have identified?

In our group, the discussion continues to be about who should be providing decision support services. As the NWS gets more involved in DSS, one concern is for increased friction from some private sector entities. Another key point is that DSS is not limited to a specific stakeholder type. DSS is important to all citizens who need to make decisions involving weather every day, thus there is a shared dimension and need for responsible and clear messaging to all stakeholders (including the tactical use of probabilistic information). 

A final recurring theme is around the workforce itself. Forecasters need to be taught communication skills, and social science is critical in helping to understand the needs and problems to be solved for the end users. With the focus shifting to newer tools including AI-infused capabilities, there is a concern that the new workforce will lose the necessary skills critical in conveying adequate decision support services.

What preliminary/tentative recommendations, solutions, or future directions have you discussed?

Some of the recommendations we’re working with right now focus on:

  • Integration of weather, water, and climate information with socioeconomic and biosphere information for earth system forecasts.
  • Cross-sector support of ecological forecasts and environmental early warning systems (for example, warnings of fishing industry impacts due to warmer water) to benefit society and facilitate impact-based action.
  • Improved communication about weather impacts, especially in a changing climate, using common terms and learnings based on stakeholder’s decision needs.
  • Embracing AI as a way to increase the velocity of forecasts, integrate probabilistic information into forecasts, and increase efficiency for both short-term services like nowcasting and long-term climate solutions for all.
  • Helping meteorologists to become the communicators that they should be. Leveraging AI solutions and tools to help make them more efficient at helping stakeholders with their decisions.
  • Expanding opportunities for smaller businesses/individuals to obtain specialized DSS.
  • Increased public awareness of changing weather patterns stimulating the need for better accuracy, earlier warnings, and long-range projections.
  • The need to smartly integrate probabilistic information to help stakeholders better understand forecasts and limitations.

Want to join a Weather Enterprise Study working group? Email [email protected].

About the Weather Enterprise Study

The AMS Policy Program, working closely with the volunteer leadership of the Commission on the Weather, Water, and Climate Enterprise, is conducting a two-year effort (2023-2025) to assess how well the weather enterprise is performing, and to potentially develop new recommendations for how it might serve the public even better. Learn more here, give us your input via Google Forms, or get involved by contacting [email protected].  

About the AMS Summer Community Meeting

The AMS Summer Community Meeting (SCM) is a special time for professionals from academia, industry, government, and NGOs to come together to discuss broader strategic priorities, identify challenges to be addressed and opportunities to collaborate, and share points of view on pressing topics. The SCM provides a unique, informal setting for constructive deliberation of current issues and development of a shared vision for the future. The 2024 Summer Community Meeting took place August 5-6 in Washington, DC, and focused special attention on the Weather Enterprise, with opportunities for the entire community to learn about, discuss, debate, and extend some of the preliminary findings coming from the AMS Weather Enterprise Study.
Tornado Risks: Perceptions and Realities

A session spotlight from the 31st Conference on Severe Local Storms

By Katie Pflaumer, AMS Staff

The session “Perception and Risk Associated with Severe Weather” at the 31st Conference on Severe Local Storms highlighted the interactions between severe weather and societal impacts. Here are a few takeaways.

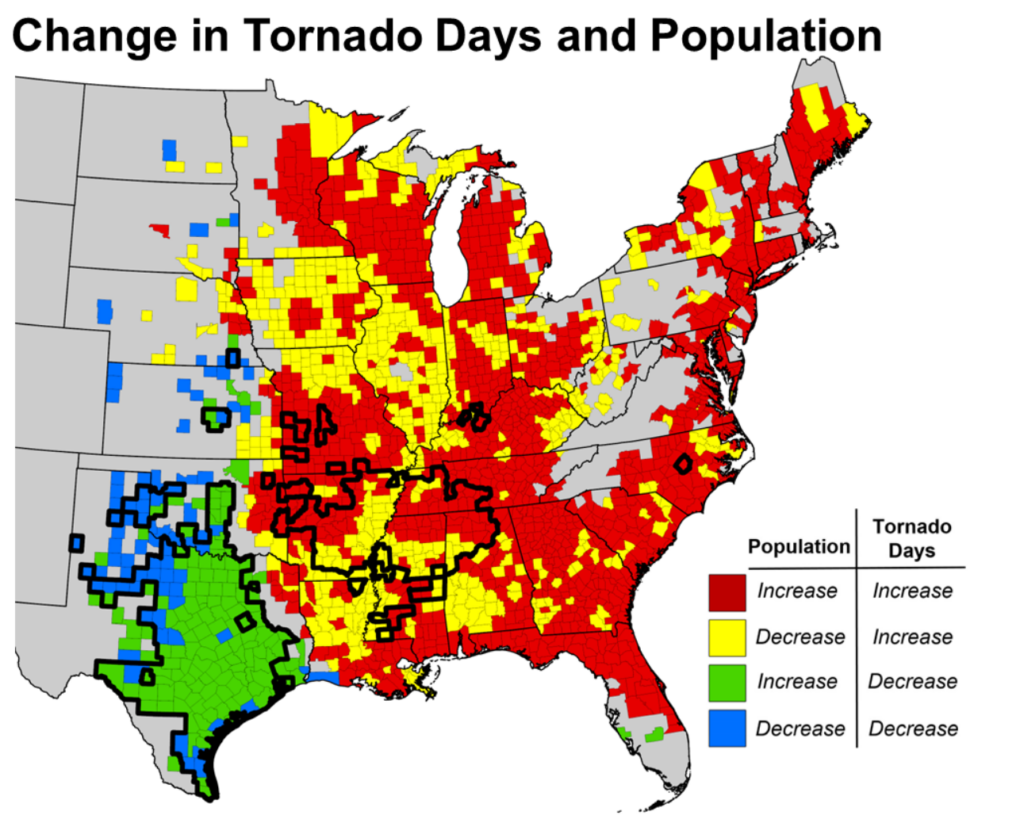
Tornado impacts are increasing across the United States–despite variation in where tornadoes hit. A presentation by Stephen Strader (Villanova University) highlighted the importance of considering all factors to understand tornado impacts, not just climate. Using 40 years of observational data, plus a statistical model depicting changes in societal factors, researchers found that increased housing and population growth in tornado-prone areas is a key driver of increased tornado damage/human risk. 

While the number of days with tornadoes is trending down in the U.S. Southern Plains and trending upward in the mid-South; the likelihood of tornado damage has increased in both regions due to increased human occupation. However, the combination of tornado increases with population growth and spread has tripled tornado impact potential in the mid-South since 1980, surpassing the Southern Plains. Strader noted that stricter enforcement of building codes, investments in tornado shelters and safe rooms, and public education could help mitigate tornado damages–if scientists can get across the message that human factors matter.


“We have to get away from this idea that climate change is a cause of a disaster … climate change is a contributor to a disaster, not a cause. [Disaster] is inherently linked to societal factors. … With environmental changes and exposure changes/housing growth, you see an increasingly disaster-prone society.”

—Stephen Strader

Graphic from: Strader, S.M., Gensini, V.A., Ashley, W.S., and A.N. Wagner (2024) “Changing Tornado Environments Vs. Changing Societal Vulnerability and Exposure.” (Poster presented at 31st Conference on Severe Local Storms, October 21.) Originally from Strader et al. (2024), “Changes in tornado risk and societal vulnerability leading to greater tornado impact potential.” NPJ Natural Hazards, 19 June. https://doi.org/10.1038/s44304-024-00019-6

Wireless Emergency Alerts are critical—and confusing—for Spanish speakers in the U.S. Southeast. A study presented by Joseph Trujillo-Falcón (University of Illinois) found that Spanish-language wireless emergency alerts (WEAs, phone notifications about severe weather) from the National Weather Service are crucial safety tools. For some tornado survivors in Kentucky, for example, the WEA had been their only trigger to get to safety. In-depth conversations with 27 Spanish speakers from across the U.S. found that WEAs were highly respected and useful, yet needed some redesign to avoid confusion. For example, the Spanish translation of the NWS acronym (SNM) called to mind medical conditions or kink. The word “proyectiles” (projectiles), used to warn about airborne debris, evoked war zone imagery rather than weather. Using the word “aviso” for “warning” struck many as less urgent than the term “alerta.” In addition, 360-word warnings (versus those of 90 words or less) helped readers better understand what was going on and what to do in response. This was especially important for people who hadn’t encountered a tornado in their country of origin. Direct links to information and instructions on how and where to shelter were also seen as key, especially in areas with many mobile or manufactured homes.

“The information source that I take most seriously as a recently arrived immigrant are WEAs. Since everyone gets it at the same time, if one ignores it, the other reads it.”

Gabriela, Venezuelan immigrant who has limited English proficiency (Trujillo-Falcón 2024).

People want different forecast information as a threat evolves. A study presented by Makenzie Krocak (National Severe Storms Laboratory) analyzed data from the Severe Weather and Society survey to determine what information members of the public want and need at different times in relation to weather threats. They found that respondents’ priorities changed over time. In longer time frames (e.g., three days in advance) survey respondents overwhelmingly ranked location information and event probability as the most valuable information; people wanted to know, ‘Should I prepare for severe weather to occur in my area?’ A day to an hour in advance, people wanted to know about the timing of the event, as well as its potential severity. In the warning time frame (60 minutes or less) their desire for information about potential impacts and necessary protective actions increased.

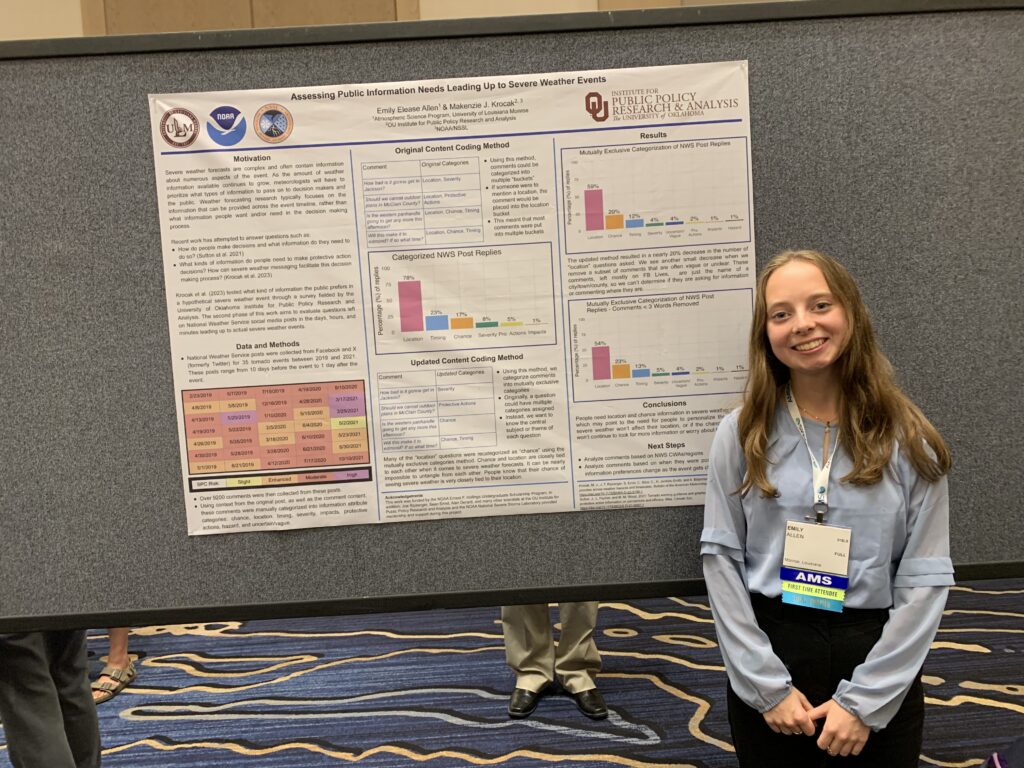
For additional insight, the researchers painstakingly categorized, geo-located, and analyzed 9000+ social media comments from the National Weather Service Facebook and Twitter/X accounts before and after severe weather events. A poster presented by undergraduate student Emily Allen (University of Louisiana Monroe) delved into this side of the equation.

Emily Allen with her poster, “Assessing Public Information Needs Leading Up to Severe Weather Events.” (E.A. Allen and M. Krocak, 2024)

Three days out from an event, commenters largely asked about the chance of an event happening, but for nearer time frames, location became the dominant question—i.e., ‘Will this hit my specific area?’ Krocak emphasized the need to include very clear landmarks in warning graphics to help people find their location. She also noted that certain groups still require information about protective actions to take—especially those with the least experience dealing with a particular hazard.

Making severe weather products usable and understandable. Two presentations dealt with public perceptions of evolving probabilistic weather forecast information—that is, communicating changes in severe weather risks across time and geography. 

Christopher Wirz (NSF NCAR) presented preliminary results of a study about public perceptions of evolving probabilistic tornado forecasts and warnings. On average, respondents’ sense of risk was about the same as for a deterministic (e.g., warning vs no-warning) forecast; most were likely to be on high alert during a tornado warning in any case, and not underestimate their risk. However, there were differences in how participants responded based on where they were located relative to a given warning polygon. For example, some felt they were in more danger if they were ‘in front’ of the warning polygon, despite the graphics showing equal tornado risk in other directions. Warn-on forecasts—alerts issued when a significant risk is predicted, often long before a tornado is detected by radar—were seen as less actionable by some, but others appreciated knowing to ‘keep an eye out.’ Overall, the study found that members of the public don’t take probabilistic information at face value—rather, they interpret it based on context, including existing local knowledge and other warning products they encounter. In addition, for half of the respondents, level of trust in a forecast didn’t change when they received more/updated information, because trust was instead based on how much they trusted the source of the forecast.

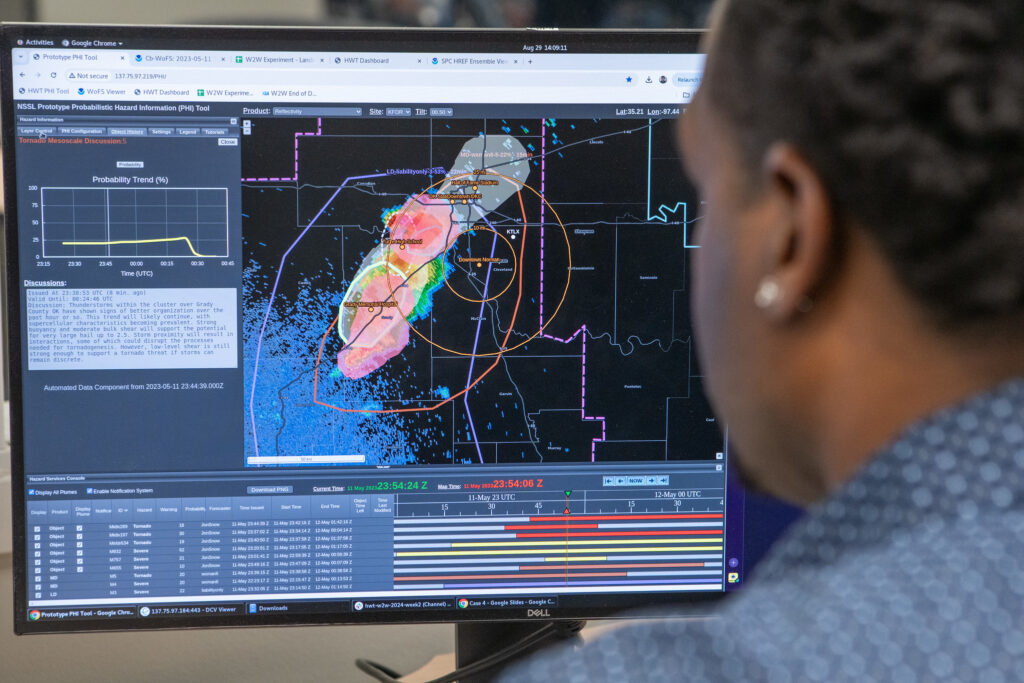
Kristin Calhoun (NOAA National Severe Storms Laboratory) presented about new products and communications that are in development to help NWS forecasters and emergency managers use storm-based probabilistic hazard information (PHI) in the severe weather watch-warning timeframe. These included PHI tools layered with threats-in-motion (TIM) information, in which warning polygons are moved (and removed) with the motion of the storm, helping downstream areas prepare sooner and allowing those for whom danger has passed to redeploy their resources more strategically; potential new protocols for the NOAA/NWS Storm Prediction Center, rather than local weather forecast offices, to add or remove an area from a watch/warning once the threat has passed; a blended PHI plus warn-on forecast product that can help emergency managers plan better by seeing storms in motion along with trends in likelihood and potential impact; and a new product based on SPC’s ‘Mesoscale Discussions,’ created by local NWS forecasters and called ‘Local Discussions,’ with an increased focus on potential impacts, timing, and location of hazards versus highly technical information.

Photo: National Severe Storms Laboratory, Watch-to-Warning Experiment.

Social pressure may impact campus tornado safety. Alicia Klees (University of Illinois at Urbana-Champaign) presented work conducted largely by undergraduate student Kyla Wolski that has implications for student safety. The University of Illinois’s Illini-Alert system warns students when tornado threats are approaching; most students are aware of the alerts, and most have experienced a tornado warning before. Students were asked in a survey what they would do if they were in a vulnerable location—such as a fourth-floor classroom with glass windows—and received a tornado warning. 75% said they would change their location to seek shelter. However, when a hypothetical professor kept teaching through a tornado warning (as some faculty reportedly did during the last real tornado warning on campus), 22% of students who had planned to seek shelter said they would probably stay in class. These students said they trusted the professor’s judgment—yet professors do not receive extensive formal training on tornado safety. Klees recalled an anecdote from a student in which one faculty member remarked, “I don’t hear the sirens anymore, so it’s fine.”

In addition, most students did not view tornadoes as a major risk, and most were unaware that tornadoes could happen at any time of year. Klees identified future collaborations with Emergency Management to survey faculty and TAs on tornado warning response, with the goal of keeping students safe.

If you are registered for the 31st Conference on Severe Local Storms, you can view the full session recording at this link.

About the 31st Conference on Severe Local Storms

The American Meteorological Society’s 31st Conference on Severe Local Storms takes place 21-25 October, 2024, in Virginia Beach, VA, and online. The conference is the premiere gathering for scientists, forecasters, educators, and communicators engaged in all aspects of work related to hazardous deep convective weather phenomena. Attendees present and discuss cutting-edge research regarding the analysis, prediction, communication, and theoretical understanding of the structure and dynamics of severe thunderstorms, including their associated hazards of tornadoes, damaging winds, large hail, lightning, and flash floods. View the conference program here.

Endangered Knowledge: Bird Nests Help Farmers Predict Rain in Rajasthan

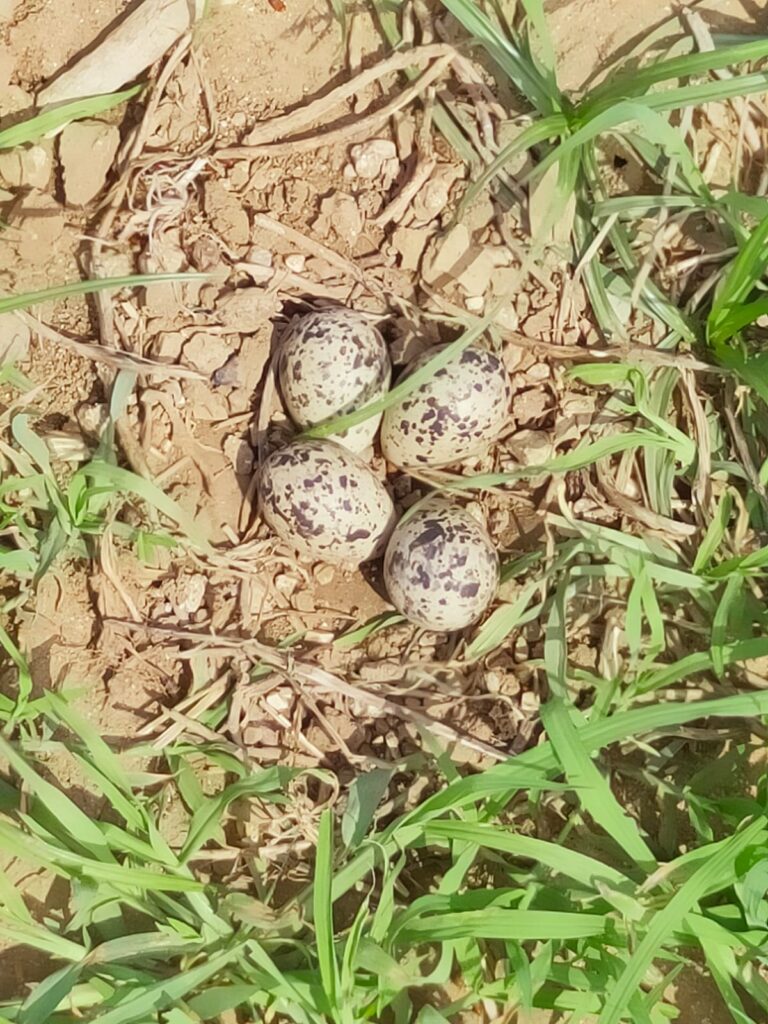
Lapwing nest with three eggs

A study in AMS journal Weather, Climate, and Society demonstrates the need to combine traditional and modern meteorological knowledge

A study published 20 August in the American Meteorological Society journal, Weather, Climate, and Society finds that traditional knowledge about nesting behaviors of the red-wattled lapwing (Vanellus indicus) is useful for helping farmers in Rajasthan, India predict seasonal rainfall—yet these nature-based indicators are less known among younger generations.

In areas like India’s southwestern Rajasthan, many farmers in tribal communities still lack access to accurate model-based weather forecasting applicable to their specific farm locations. In its place, older farmers often rely on traditional knowledge of the ecosystem around them. This includes predicting seasonal rains based on the nesting behavior of the red-wattled lapwing, a ground-nesting bird which lays its eggs near farm fields during the rainy season. For generations, some tribal farmers have used the positions of the birds’ nests and eggs for clues to help plant appropriate crops for upcoming weather conditions. But there has been relatively little scientific evidence gathered to back up this traditional knowledge, and younger farmers are less likely to rely on it—or even know about it.

A team of researchers from Agriculture University, Jodhpur and Maharana Pratap University of Agriculture and Technology studied the lapwings’ nesting behaviors at an average of 10–15 nests each year at agricultural research stations in southwestern Rajasthan. They related the behaviors to rainfall patterns and tested them against local traditional predictions.

The authors report that the field campaign supported many of the traditional predictions, especially those widely utilized indicators based on lapwing nest location, number of eggs, and the eggs’ position in the nest. For example, more eggs in the nest tended to correlate with more months of rain during the nesting season.

<< Red-wattled lapwing and (inset) a lapwing nest with four eggs. Figure 1 (a) from Bhardwaj et al. (2024).

[Note: The authors plan to publish additional data from the field study in an upcoming paper.]

“Integrating traditional knowledge with modern science can help in better understanding various climate-related parameters. Thus, our study suggests the need for a policy framework which will address the problem of the ineffective dissemination of information related to rainfall intensity and duration among local farmers, particularly in the remote rural areas, by traditional as well as modern meteorological announcements,” says Raju Lal Bhardwaj, lead author on the study.   

Weather patterns in southwestern Rajasthan are exceptionally variable, and will likely become more so with climate change. A survey conducted by the authors found that elder tribal farmers were less likely to plan their seasonal crops using “modern” meteorological forecasts. Instead, 70% used lapwing indicators to plan which fields to plant, and 85% used them to determine what crops to plant.

When nests were built at elevations higher than farm fields, farmers predicted high rainfall, planting water-tolerant monocultures like maize and sugarcane in fields with good drainage. When nests were built at elevations below farm fields and/or close to water bodies, they predicted low rainfall or drought—and therefore planted only hardy crops good for animal fodder. Years like 2017 supported such tactics: lapwings on average nested on higher ground that year; 797.5 mm of rain fell and crop yield was excellent.

Younger generations overlooked these traditional rain prediction indicators, with only 30% using lapwing indicators to help select planting locations. Younger farmers focused more on understanding data-based forecasting. In remote areas, however, they were sometimes unable to access those forecasts.

The authors suggest that lapwing nesting behaviors should be further studied and integrated into forecasting. “Modern meteorologist[s] should take advantage of the traditional knowledge of lapwing-based prediction methods that are not found in books but in the memories and experiences of elder tribal farmers,” they write. “Integrating this traditional knowledge with modern science can help in better understanding various climate-related parameters.”

Read the study:Red-Wattled Lapwing (Vanellus indicus): A Traditional Rain Forecaster for Tribal Farmers of South-Western Rajasthan.”

Photo at top: Lapwing nest with three eggs. Image courtesy of Raju Bhardwaj.

We May Be Able to Further Improve Hurricane Track Forecasts After All

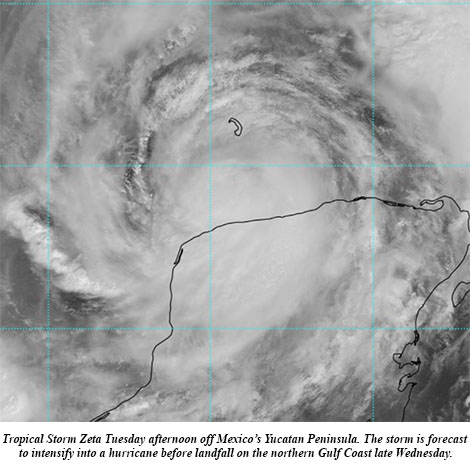
ZetaZeta blossomed into the 11th hurricane of this hyperactive season Monday and its forecast track takes it ashore on the Gulf Coast by midweek. The National Hurricane Center (NHC) on Monday said computer models had become more tightly clustered with the forecast in the Gulf, “resulting in an increase in track-forecast confidence,” and Hurricane Zeta is expected to become the United States’ record 11th storm landfall in a single season.
Such confidence is a reflection that NHC’s tropical storm and hurricane track forecasts, which go out 5 days, have substantially improved in the last 25 years. But, a 2018 essay in the Bulletin of the American Meteorological Society (BAMS) found that such improvements in track forecasts have slowed, raising concern about making them any better and extending them out beyond 5 days with any skill. While that study suggested improvements may have reached a limit, new research also published in BAMS finds a way to further refine them in the coming decades. Using a different interpretation of track position errors than the earlier article, the research moves the predictability limit for tropical cyclones out a day per decade to 6-8 days in the next 10-30 years.

Late Season Hurricanes Bring Research Opportunities, Too

After a veritable flurry of storms in the Atlantic since August, the basin has gone quiet following the landfalls of Tropical Storm Beta in Texas, and Post-Tropical Storm Teddy in Nova Scotia. But late-season storms are quite common in the Atlantic, and as this hyperactive hurricane season combines with confirmed La Niña conditions, this year it seems almost like an expectation. And that means people on the coast need to stay alert to what’s going on in the atmosphere, but it also means there’s still promise for additional hurricane research this year.

Recent Octobers have seen a couple of very intense and even catastrophic hurricanes develop and make landfall. The last big one was Hurricane Michael, which slammed the Florida Panhandle in 2018. In 2016, Hurricane Matthew roared to life in the Caribbean, reaching Category 5 intensity on the Saffir-Simpson scale before crashing into Hispaniola as a Cat. 4, and then menacing the Florida coast for days and eventually swirling into the Carolinas.

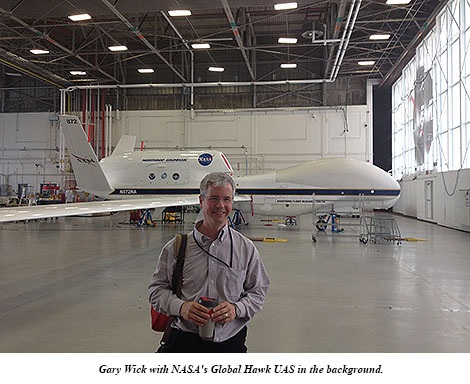
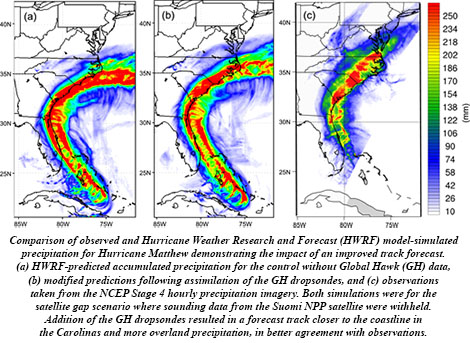
Matthew turned out to be a late-season success for NOAA’s Sensing Hazards with Operational Unmanned Technology (SHOUT) project.  SHOUT evaluated the ability of observations taken by the high-altitude, unmanned Global Hawk aircraft to improve forecasts of high-impact weather events, which are “one of the most critically needed capabilities of weather services around the world,” write lead author Gary Wick and his colleagues in their article on SHOUT in the Bulletin of the American Meteorological Society.

NASA’s Global Hawk flew 15 missions sampling Hurricane Matthew and 5 other tropical cyclones as well as 3 winter storms in 2015 and 2016. Instrumented with GPS dropwindsondes and remote sensors, Global Hawk’s data were examined in real time by forecasters, assimilated in operational weather prediction models, and applied to data impact studies, demonstrating positive results.

BAMS asked Wick a few questions about his work and SHOUT in particular (for the full answers, see the print or digital edition of the magazine):

BAMS: What would you like readers to learn from your article?

Gary Wick: The primary message we would like to convey is that Global Hawk can provide highly useful observations of high-impact weather events that would be very difficult to obtain with any other
existing aircraft or observing system.  It was possible to consistently see the potential for forecast benefit across a wide range of models.

Gary_Wick-and-Global_HawkBAMS: How did you get into this focus on improving operational hurricane forecasts with unmanned aircraft?
GW: I was fortunate to have participated in both the NASA-led Genesis and Rapid Intensification (GRIP) and Hurricane and Severe Storm Sentinel (HS3) campaigns and was able to observe the potential application of the Global Hawk to tropical cyclone research.  The distinct goals of those campaigns, however, didn’t allow for a real focus on the operational hurricane forecasting problem.  We in the NOAA UAS Program were extremely excited when support from the Disaster Relief Act of 2013 gave us the opportunity to conduct a dedicated campaign to examine the impact of observations from the Global Hawk on forecasts of high-impact weather.

BAMS: What got you initially interested in meteorology?

GW: My path to this project was really quite indirect.  My interests growing up really centered around planes, due in part to living close to the old Denver airport.  As a kid, I would frequently ride my bicycle out to the end of the runway and watch planes take off and land.  These interests led me to study Aerospace Engineering as an undergraduate where I just happened to take a class one year in environmental aerodynamics taught by a scientist from a predecessor of my current NOAA laboratory.  This class introduced me to remote sensing and I ended up pursuing graduate studies centered primarily around satellite-based remote sensing.  The work with UAS in general and this project in particular allowed me to come full circle, in a sense, combining my many interests in aircraft, remote sensing, and weather.

BAMS: What surprised you the most in the SHOUT project?

GW: As someone whose personal work hadn’t centered around atmospheric models, assimilation, and weather forecasting, it was surprising to me early on how providing weather models with more, high quality, direct observations wouldn’t necessarily improve the resulting forecasts and, in some cases, could actually degrade them.  One might naively think that better data could only lead to a better final product.  After gaining an appreciation of how challenging it is to achieve meaningful forecast improvements through addition of any data to our current observing and assimilation systems, I was
very pleasantly surprised that it does appear that the highly unique observations enabled by the Global Hawk still have the potential to help us improve our forecasts of high-impact weather events.

BAMS: What was the biggest challenge you encountered in the experiment?

GW: As with seemingly any field project, our biggest challenge was probably obtaining the weather events we were hoping to study during the necessarily limited duration of the campaign.  Through the multiple years of the GRIP, HS3, and SHOUT campaigns, the Global Hawk developed almost a reputation as a “hurricane repellent” due to the limited number of storms during the experimental periods.  Perhaps the most interesting storm sampled during the SHOUT campaign, Hurricane Matthew in 2016, actually occurred after the scheduled end of the experiment.  Fortunately, we were able to extend the campaign and collect some very valuable additional observations.

Matthew_GHBAMS: What’s next? How will you follow up?
GW: Several additional studies are underway to better evaluate the impact of all the different observations collected in different and the most recent models. NOAA is still working to evaluate and increase the number of UAS observations (particularly from smaller platforms) to help conduct our mission.

Red Proverb at Morning, Meteorologists Take Warning

Sunset4_IMG_0813 copy

Weather proverbs can be useful indicators of real correlations observed over the centuries, but they can also show unwelcome persistence. The phenomenon is well known: for example, a December 1931 BAMS article referred to a Columbia University study that revealed most high school students had heard the proverb, “When squirrels gather an unusual supply of nuts, it indicates a severe winter”—and 61% of them believed it.

Efforts to confirm or debunk proverbs are also an old tradition. As recorded in the October 1896 Monthly Weather Review, members of the Meteorological Society of France discussed the merits of the popular proverb: ” When it rains on St. Medard’s day it will rain for forty days unless fine weather returns on the day of St. Bernabe.” They found no confirmation of the saying in their data.

In recommending W.J. Humphrey’s 1923 book sorting proverb fact from fiction, Robert deCourcy Ward of Harvard University wrote in BAMS,

There have been several such collections, but there have been practically no serious attempts to separate the “good” from the “bad” proverbs. Many proverbs are merely the relics of past superstitions. Many are useful in one climate and of no use in another land into which they have been imported. Most of our own proverbs came from Europe, or even still farther away, and do not fit into our climatic environment.

Along comes an unusually thorough verification study of Polish weather proverbs in the July 2020 issue of Weather, Climate and Society. Lead author Piotr Matczak (of the Adam Mickiewicz University in Poznań, Poland) and colleagues set their article in the context of the recent, increased interest in integrating traditional knowledge with scientific findings in order to enrich overall climate databases.

The authors searched through 1,940 sayings, mostly looking for if-then logical structure (such as “hot July leads to January frosts”) that suggested predictive power, and narrowed the list to 28 specific enough about temperature to be verified by decades of weather data from observing stations in and around Poland. In many cases, this meant turning subjective descriptions into quantitative categories. For instance, “If Saint Matthew (February 24) does not melt ice, peasants will long puff to warm their cold hands]” was recast as a test: the correlation of maximum air temperature on February 24 below 0°C to mean air temperature for the following two weeks below 0°C.

This proverb proved to be the most accurate of the bunch, fulfilling its predictions 83% of the time. The rest of the sayings were–not so much fantastical as just plain unhelpful. Only 16 of the 28 proverbs showed any forecast skill, and usually quite low skill, which wasn’t necessarily unexpected, since many of the proverbs were essentially extended range forecasts that wouldn’t have been skillful even with modern techniques. Three proverbs, like “If the Marek day (April 25) is threatening with the swelter the Boniface (May 14) freezes” never predicted accurately in the data record. Most of the time the predictive condition occurred, the predicted consequence did not occur (false alarm ratios for most proverbs greatly exceeded 50%).

Including the St. Matthew’s day prediction, only three verified more than 43% of the time: “When Zbigniew and Patrick (March 17) are freezing people’s ears, two more Sundays of winter freezing and snows,” and another for St. Matthew’s day: “If the Matthew day is warm there is a hope for spring.”

There were some interesting shifts in the proverbs’ success rate however that may warrant follow-up research. They did better earlier in the record than in later years, and better in eastern Poland and formerly Polish lands further east. Matczak et al. note,

following the Second World War, Poland was displaced by some 200 km westward, with the population displaced accordingly. Thus, the proverbs may refer to the climate of areas that are more eastward when compared with the current borders of Poland, that is, the areas nowadays in Belarus, Lithuania, and Ukraine.


“Decision-making under meteorological uncertainty” for D-Day’s Famous Forecast

The success of the D-Day Invasion of Normandy was due in part to one of history’s most famous weather forecasts, but new research shows this scientific success resulted more from luck than skill. Oft-neglected historical documentation, including audio files of top-secret phone calls, shows the forecasters were experiencing a situation still researched and practiced today: “decision-making under meteorological uncertainty.”

New research recently published in BAMS into that weather forecast for June 6, 1944, which enabled the Allies in World War II to gain a foothold in Europe, answers questions about three popular perceptions: were the forecasts, which predicted a break in the weather, that good? were the German meteorologists so ill-informed, missing that weather-break? and was the American analog system for prediction so great and better than what the Germans had?

The “alleged” weather break

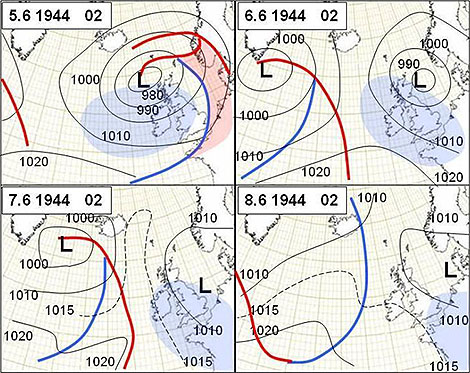
An expected ridge and fair weather between two areas of low pressure, one departing and one arriving over the area, didn’t materialize. The departing low instead lingered and created a lull in visibility and lifted the cloud ceiling height, but it didn’t slow winds much. They blew at Force 4-5 (~13-24 mph), creating very choppy seas that sickened many troops prior to the invasion.

Synoptic analyses at 00 UTC from 5 to 8 June 1944. The low that was supposed to move northeast to southern Norway remained over the North Sea for some days. On 6 and 8 June the observed winds in the Channel were force 4 and occasionally force 5.
Synoptic analyses at 00 UTC from June 5-8, 1944. The low that was supposed to move northeast to southern Norway remained over the North Sea for some days.


A blown German Forecast?

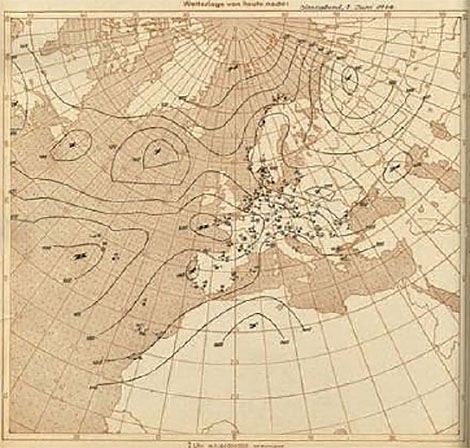
Because the invasion came as a complete surprise to the Germans it has been surmised their weather forecast for June 6 had to be bad. German forecasters prior to the war were the best at “extended” forecasts, and their synoptic maps and forecast for that day were more realistic than the Allies, with a less optimistic speculation of any break in the weather.

The German's European-Atlantic map at 00 UTC June 6, 1944, where the analysis over the North Atlantic appears not to be based on observations but intercepted American coded analyses.
The German’s European-Atlantic map at 00 UTC June 6, 1944, where the analysis over the North Atlantic appears not to be based on observations but intercepted American coded analyses.


A historically debated forecast

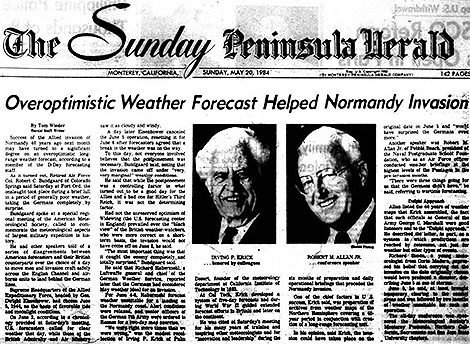
The analog weather prediction system employed by the Allies for the invasion was claimed by its creators to have correctly identified the weather break. But historical analysis and review doesn’t bear this out. What it does find, though, is that the system correctly identified a transition from zonal to meridional flow, which delivered the break the Allies needed for success. History’s finding: The forecast was “Overoptimistic.”

The 1984 Fort Ord meeting about the D-Day forecast got coverage in the local Monterey newspapers. The invasion was said to have occurred in a "break" or a period of a "brief lull" in the weather.
The 1984 Fort Ord, California, AMS meeting about the D-Day forecast got coverage in the local Monterey newspapers. The American forecasting group was led by Lt. Col. (Dr.) Irving Krick of Caltech. The president of the Naval Post Graduate School, Robert Allen, Jr., at the time an Air Force officer conducting high-level weather briefings at the Pentagon, also spoke at the meeting.


As a lesson learned from this most famous of weather forecasts, the paper’s author, Anders Persson of Swedin’s Uppsala University, concludes:

It was 75[+] years ago and the observational coverage has improved tremendously since then, both qualitatively and quantitatively. Our understanding of the atmosphere is much better,and the forecast methods have reached a standard that could hardly have been dreamt of in 1944. However, there’s one element that has a familiar ring to it and is of great interest today. That is when Air Marshall Tedder [Deputy Supreme Commander of the Invasion under General Eisenhower] asks about an assessment of the confidence in the forecast he has just heard … This illustrates that the D-day forecast is a significant early example of decision-making under meteorological uncertainty.

"Decision-making under meteorological uncertainty" for D-Day's Famous Forecast

The success of the D-Day Invasion of Normandy was due in part to one of history’s most famous weather forecasts, but new research shows this scientific success resulted more from luck than skill. Oft-neglected historical documentation, including audio files of top-secret phone calls, shows the forecasters were experiencing a situation still researched and practiced today: “decision-making under meteorological uncertainty.”
New research recently published in BAMS into that weather forecast for June 6, 1944, which enabled the Allies in World War II to gain a foothold in Europe, answers questions about three popular perceptions: were the forecasts, which predicted a break in the weather, that good? were the German meteorologists so ill-informed, missing that weather-break? and was the American analog system for prediction so great and better than what the Germans had?
The “alleged” weather break
An expected ridge and fair weather between two areas of low pressure, one departing and one arriving over the area, didn’t materialize. The departing low instead lingered and created a lull in visibility and lifted the cloud ceiling height, but it didn’t slow winds much. They blew at Force 4-5 (~13-24 mph), creating very choppy seas that sickened many troops prior to the invasion.

Synoptic analyses at 00 UTC from 5 to 8 June 1944. The low that was supposed to move northeast to southern Norway remained over the North Sea for some days. On 6 and 8 June the observed winds in the Channel were force 4 and occasionally force 5.
Synoptic analyses at 00 UTC from June 5-8, 1944. The low that was supposed to move northeast to southern Norway remained over the North Sea for some days.

 
A blown German Forecast?
Because the invasion came as a complete surprise to the Germans it has been surmised their weather forecast for June 6 had to be bad. German forecasters prior to the war were the best at “extended” forecasts, and their synoptic maps and forecast for that day were more realistic than the Allies, with a less optimistic speculation of any break in the weather.
The German's European-Atlantic map at 00 UTC June 6, 1944, where the analysis over the North Atlantic appears not to be based on observations but intercepted American coded analyses.
The German’s European-Atlantic map at 00 UTC June 6, 1944, where the analysis over the North Atlantic appears not to be based on observations but intercepted American coded analyses.

 
A historically debated forecast
The analog weather prediction system employed by the Allies for the invasion was claimed by its creators to have correctly identified the weather break. But historical analysis and review doesn’t bear this out. What it does find, though, is that the system correctly identified a transition from zonal to meridional flow, which delivered the break the Allies needed for success. History’s finding: The forecast was “Overoptimistic.”
The 1984 Fort Ord meeting about the D-Day forecast got coverage in the local Monterey newspapers. The invasion was said to have occurred in a "break" or a period of a "brief lull" in the weather.
The 1984 Fort Ord, California, AMS meeting about the D-Day forecast got coverage in the local Monterey newspapers. The American forecasting group was led by Lt. Col. (Dr.) Irving Krick of Caltech. The president of the Naval Post Graduate School, Robert Allen, Jr., at the time an Air Force officer conducting high-level weather briefings at the Pentagon, also spoke at the meeting.

 
As a lesson learned from this most famous of weather forecasts, the paper’s author, Anders Persson of Swedin’s Uppsala University, concludes:

It was 75[+] years ago and the observational coverage has improved tremendously since then, both qualitatively and quantitatively. Our understanding of the atmosphere is much better,and the forecast methods have reached a standard that could hardly have been dreamt of in 1944. However, there’s one element that has a familiar ring to it and is of great interest today. That is when Air Marshall Tedder [Deputy Supreme Commander of the Invasion under General Eisenhower] asks about an assessment of the confidence in the forecast he has just heard … This illustrates that the D-day forecast is a significant early example of decision-making under meteorological uncertainty.

In Celebration: American Weather Enterprise Collaborating to Protect Lives and Property

By Mary M. Glackin, AMS President-Elect, and Dr. Joel N. Myers, Founder and CEO, AccuWeather

In his acclaimed book, The Signal and the Noise, noted statistician Nate Silver examines forecasts of many categories and finds that most forecast types demonstrate little or no skill, and most predictive fields have made insignificant progress in accuracy over the past several decades.  The one exception, Silver concludes, is weather forecasting, which he singles out as a “success story.” We quite agree.

The benefit of improved weather forecasting on human activity over the last 60 years cannot be overstated. As we approach in January the 100th Annual Meeting of the American Meteorological Society, the nation’s premier scientific organization dedicated to the advancement of meteorological science, it seems a fitting time to celebrate all that we have accomplished for the protection of life and property and the substantial benefits to people and business and contemplate the challenges ahead and the path forward to conquer them.

With technology and human knowledge increasingly transforming both weather forecasting and our relationship with it, our success will rest squarely on our ability to embrace transformational change and to recognize and welcome opportunities for collaboration between key facets of the weather enterprise – academic, government and the private weather industry.

The publicly funded National Oceanic and Atmospheric Administration plays a critical role in supporting the entire infrastructure of weather forecasting, which government organizations, such as the National Weather Service, the U.S. military, and privately held organizations rely on. This infrastructure includes observational systems, maintenance and support of numerical weather prediction models, and providing life-saving weather warnings.  Warnings, arguably, are the biggest payoff of weather forecasting with lives and property on the line.

The NWS analyzes and predicts severe weather events and issues advisories and warnings to the general public for their safety and protection. Warning services provided by NWS have improved over the decades. By design, NWS weather warnings cover a broad territory, intended for the widest possible public audience in a region.

While all government weather warnings reaching the public are produced by the NWS, increasingly in today’s digital age they are tailored and delivered almost entirely by private weather providers through news broadcasts and free, advertising-supported mobile phone apps and other digital sources of convenience.  The greatest challenge the weather enterprise faces is ensuring these life-saving weather warnings reach the greatest number of people potentially impacted by hazardous weather with enough advance notice to take proactive steps to remain safe and out of harm’s way. When seconds count in a weather-related emergency, this partnership example significantly extends the reach of the government for greater public safety.

What some may not realize is that when severe weather threatens, companies, such as AccuWeather, pair a deep understanding of client operations with their team of meteorologists to provide vital services, such as custom site and operation specific weather warnings, to clients tailored to their risk thresholds.

recent Washington Post article mistakenly conflated warning services provided by NOAA with custom warning services provided to private clients.

In fact, with example after example, there is no doubt private companies, such as AccuWeather, which has received many AMS accolades for its warnings and expertise, can and do provide valuable warnings and services to private clients. It was unfortunate that a comment said on the fly was taken out of context. Both AccuWeather and AMS view the incident in this light and are continuing to build on their shared history of partnership. AccuWeather works closely with NOAA and NWS to make sure communities and businesses have the best information and warnings they need to stay safe. This partnership has never been stronger.

In fact, there has been a long history of cooperation between the public and private weather sectors.  National Meteorological and Hydrological Services (NMHS), including the NWS, readily source data and intellectual property from private companies to support their mission of saving lives, protecting property, and enhancing the national economy.  This trend is likely to continue in the world of shrinking government budgets and resource allocation.  In turn, private companies leverage technologies, such as the many forecast models provided by NMHS, as the foundation to their own products and services.

As we look ahead to the next 100 years, many challenges impacting the future of the weather enterprise loom large, such as cost and financial pressures, the hyperbolic increasing rate of the capture, storing, processing and analyzing of data, emerging challenges of health and climate change and new accelerating technologies and platforms in the digital age, some of which we cannot yet even conceive.

These sectors of the weather enterprise have their own advantages and efficiencies and together we can most certainly succeed in furthering meteorological advancement if we capitalize on each other’s strengths and work cooperatively and decisively to achieve our larger mission of safety and protection.

All partners in the weather enterprise –government, commercial and academia —  in addition to the support and stewardship of important professional organizations, such as the AMS, the National Weather Association and the American Weather and Climate Industry Association – are essential to meteorological progress, and the sum of our value to the public and business can be far greater than the individual parts.

In the last six decades, each component of the weather enterprise has learned to better understand and appreciate one another and to communicate more effectively and to respect the important contributions of each in the true spirt of cooperation. The greatest example of this is the AMS-championed Fair Weather Report, a study funded by the federal government to generate more harmony across the entire weather enterprise.

Since we began our careers, we have had the privilege of seeing amazing progress in our ability to provide more specific, more accurate, and more useful weather forecasts and warnings, which extend further ahead and have saved tens of thousands of lives and prevented hundreds of billions of dollars in property damage.

With even more and better collaborations between the various facets of the weather enterprise, there is no question the public and our nation stand to benefit from greater safety and better planning. We look forward to continuing our work together to bring about more exciting innovations and enhancements to advance public safety.

Editor’s note: Mary M. Glackin is President-elect, American Meteorological Society. She was formerly the Deputy Under Secretary for Oceans and Atmosphere at National Oceanic and Atmospheric Administration (NOAA) and a Senior Vice President of Science and Forecast Operations at The Weather Company (IBM). Dr. Joel N. Myers is Founder and CEO of AccuWeather

The Trouble with Harvey: Hurricane Intensification Dilemmas

Hurricanes like rapidly-changing Harvey are still full of surprises for forecasters.
The remnants of Caribbean Tropical Storm Harvey made a startling burst Thursday from a tropical depression with 35 mph winds to an 85 mph hurricane in a little more than 12 hours. It has been moving steadily toward a collision with the middle Texas coast and landfall is later Friday. If intensification continues at the same rate, Harvey is likely to be a major hurricane by then, according to a Thursday afternoon advisory from the National Hurricane Center, with sustained winds of 120-125 mph and even higher gusts.
That’s a big “if.”
The drop in central pressure, which had been precipitous all day—a sign of rapid strengthening—had largely slowed by Thursday afternoon. Harvey’s wind speed jumped 50 mph in fits during the same time, but leveled off by late afternoon at about 85 mph. Harvey was a strong Category 1 hurricane on the Saffir-Simpson Hurricane Wind Scale by dinner time.
The intensifying process then slowed. But it turns out this was temporary.
Many signs pointed to continued rapid intensification: a favorable, low-shear environment; expanding upper-air outflow; and warm sea surface temperatures. Overnight and Friday morning, Harvey continued to traverse an eddy of water with high oceanic heat content that has detached from the warm Gulf of Mexico loop current and drifted westward toward the Texas coast. Its impact is apparent as the pressure resumed its plunge and winds have responded, blowing Friday morning at a steady 110 mph with higher gusts.
Further intensification is possible.
In fact, the SHIPS (Statistical Hurricane Intensity Prediction Scheme) Rapid Intensification indices “are incredibly high,” Hurricane Specialist Robbie Berg wrote in the Thursday morning forecast discussion. Guidance from the model then showed a 70 percent chance of another 50 mph jump in wind speed prior to landfall. The afternoon guidance lowered those odds a bit, but still showed a a 64 percent probability.of a 35 mph increase.
It wouldn’t the first time a hurricane has intensified rapidly so close to the Texas coast. In 1999 Hurricane Bret did it, ramping up to Category 4 intensity with 140 mph winds before crashing into sparsely populated Kennedy County and the extreme northern part of Padre Island.
Hurricane Alicia exploded into a major hurricane just prior to lashing Houston in 1983. And 2007’s Hurricane Humberto crashed ashore losing its warm water energy source and capping its intensity at 90 mph just 19 hours after being designated a tropical depression that morning off the northern Texas Coast, a similar boost in intensity as Hurricane Harvey.
Rapid intensification so close to landfall is a hurricane forecasting nightmare. An abundance of peer-reviewed papers reveal that there’s a lot more we need to learn about tropical cyclone intensity, with more than 20 papers published in AMS journals this year alone. Ongoing research into rapidly intensifying storms like Harvey, is helping solve the scientific puzzle, including recent cases such as Typhoon Megi  and Hurricane Patricia. Nonetheless, despite strides in predicting storm motion in past decades, intensification forecasting remains largely an educated guessing game.