Changing Coasts and Culture

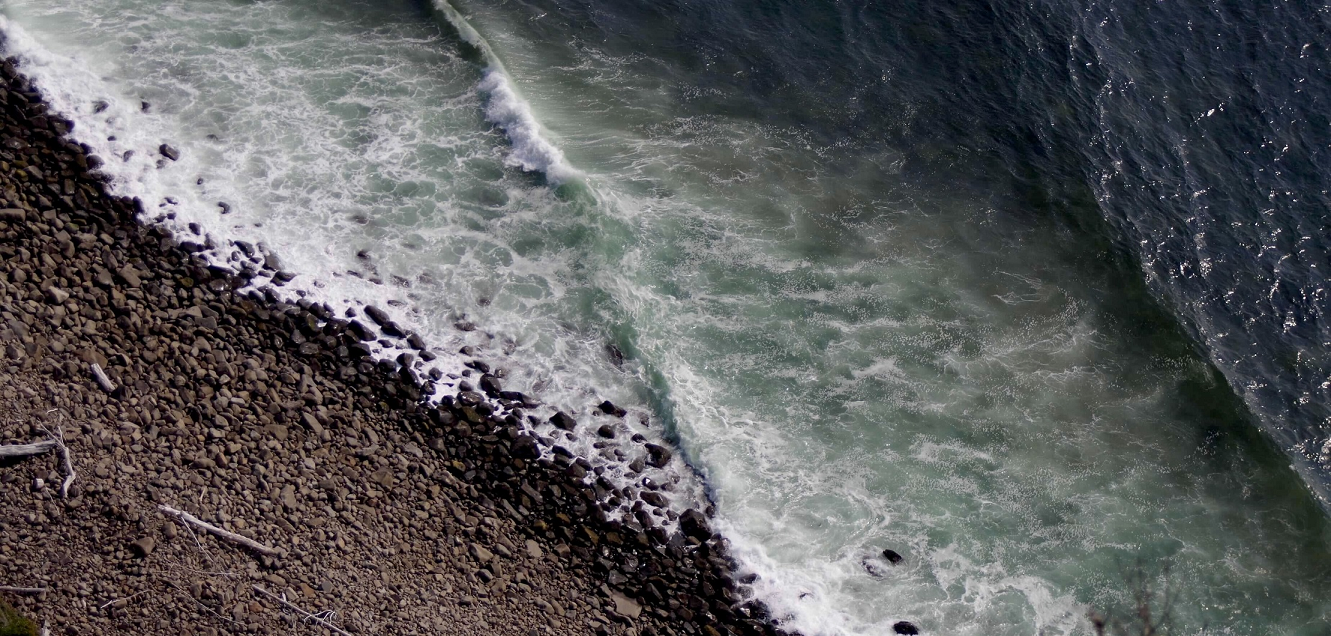
Image of wave washing over a rocky beach

AMS 2024 Session Highlight: “Convergence Science in the Context of Integrating Weather and Climate Science with Studies of Marine and Coastal Resources and Geophysical Processes”

By Isabella Herrera, AMS Policy Program

One of the most challenging parts of planning out my week at the AMS Annual Meeting was choosing which symposia and sessions to attend in person, and which to catch on my laptop after leaving Baltimore. Convergence Science: Indigenous Weather, Water and Climate Knowledge Systems, Practices, and Communities was one of the symposia for which I knew I wanted to bein the room where it happens.” In this case, “the room” was in the Baltimore Convention Center, and unlike many scientific and political discussions throughout the history of the United States, these discussions focused on Indigenous voices and the need for the scientific community to more meaningfully engage with Indigenous science and Native peoples. 

The symposium centered on the work of the Rising Voices Center for Indigenous and Earth Sciences (co-administered by NCAR|UCAR and the Livelihoods Knowledge Exchange Network), including the Rising Voices: Changing Coasts (RVCC) research hub. As Lead Investigator Daniel Wildcat said in an opening address for the symposium, RVCC is “catalyzing efforts to bring Indigenous knowledge holders [together] with some of the best university-trained [physical] scientists in the world … to model what convergence science looks like if you include Indigenous wisdom and knowledge.” A short film was played during the morning session to honor the late Dr. Heather Lazrus, Rising Voices co-founder, and her work with Rising Voices. 

A panel discussion during the symposium, Convergence Science in the Context of Integrating Weather and Climate Science with Studies of Marine and Coastal Resources and Geophysical Processes, featured a variety of speakers working at the various intersections of weather, water, climate, marine, and Indigenous science. Here are some of the experiences and perspectives shared during this session.

The Convergence of Science and Identity: Being Native in Scientific Spaces

Robbie Hood, a citizen of the Cherokee Nation and atmospheric scientist, started off the session describing her experience having worked for both NASA and NOAA, and mentioned that although she’d been to many AMS Annual Meetings throughout her career, this was her first time being able to represent herself as a Cherokee. Hood emphasized the immense opportunity of convergence science in practice.

“To me, it’s just science,” said Kekuʻiapōiula (Kuʻi) Keliipuleole, a Native Hawaiian and researcher at the University of Hawaiʻi. Native peoples’ knowledge of and connection to their lands is expansive, and deep, and intimate, Keliipuleole explained to us as she introduced herself by naming her mountain (Makanui), her waters (Wai‘ōma‘o and Pūkele), her rain (Lililehua), and her winds (Lililehua and Wai‘ōma‘o). She spoke about being a Native person who studies native organisms in their environment, in Hawaiʻi for Hawaiʻi, and the complexities of merging her identity of being Native and a scientist – of integrating “western” science into her culture.
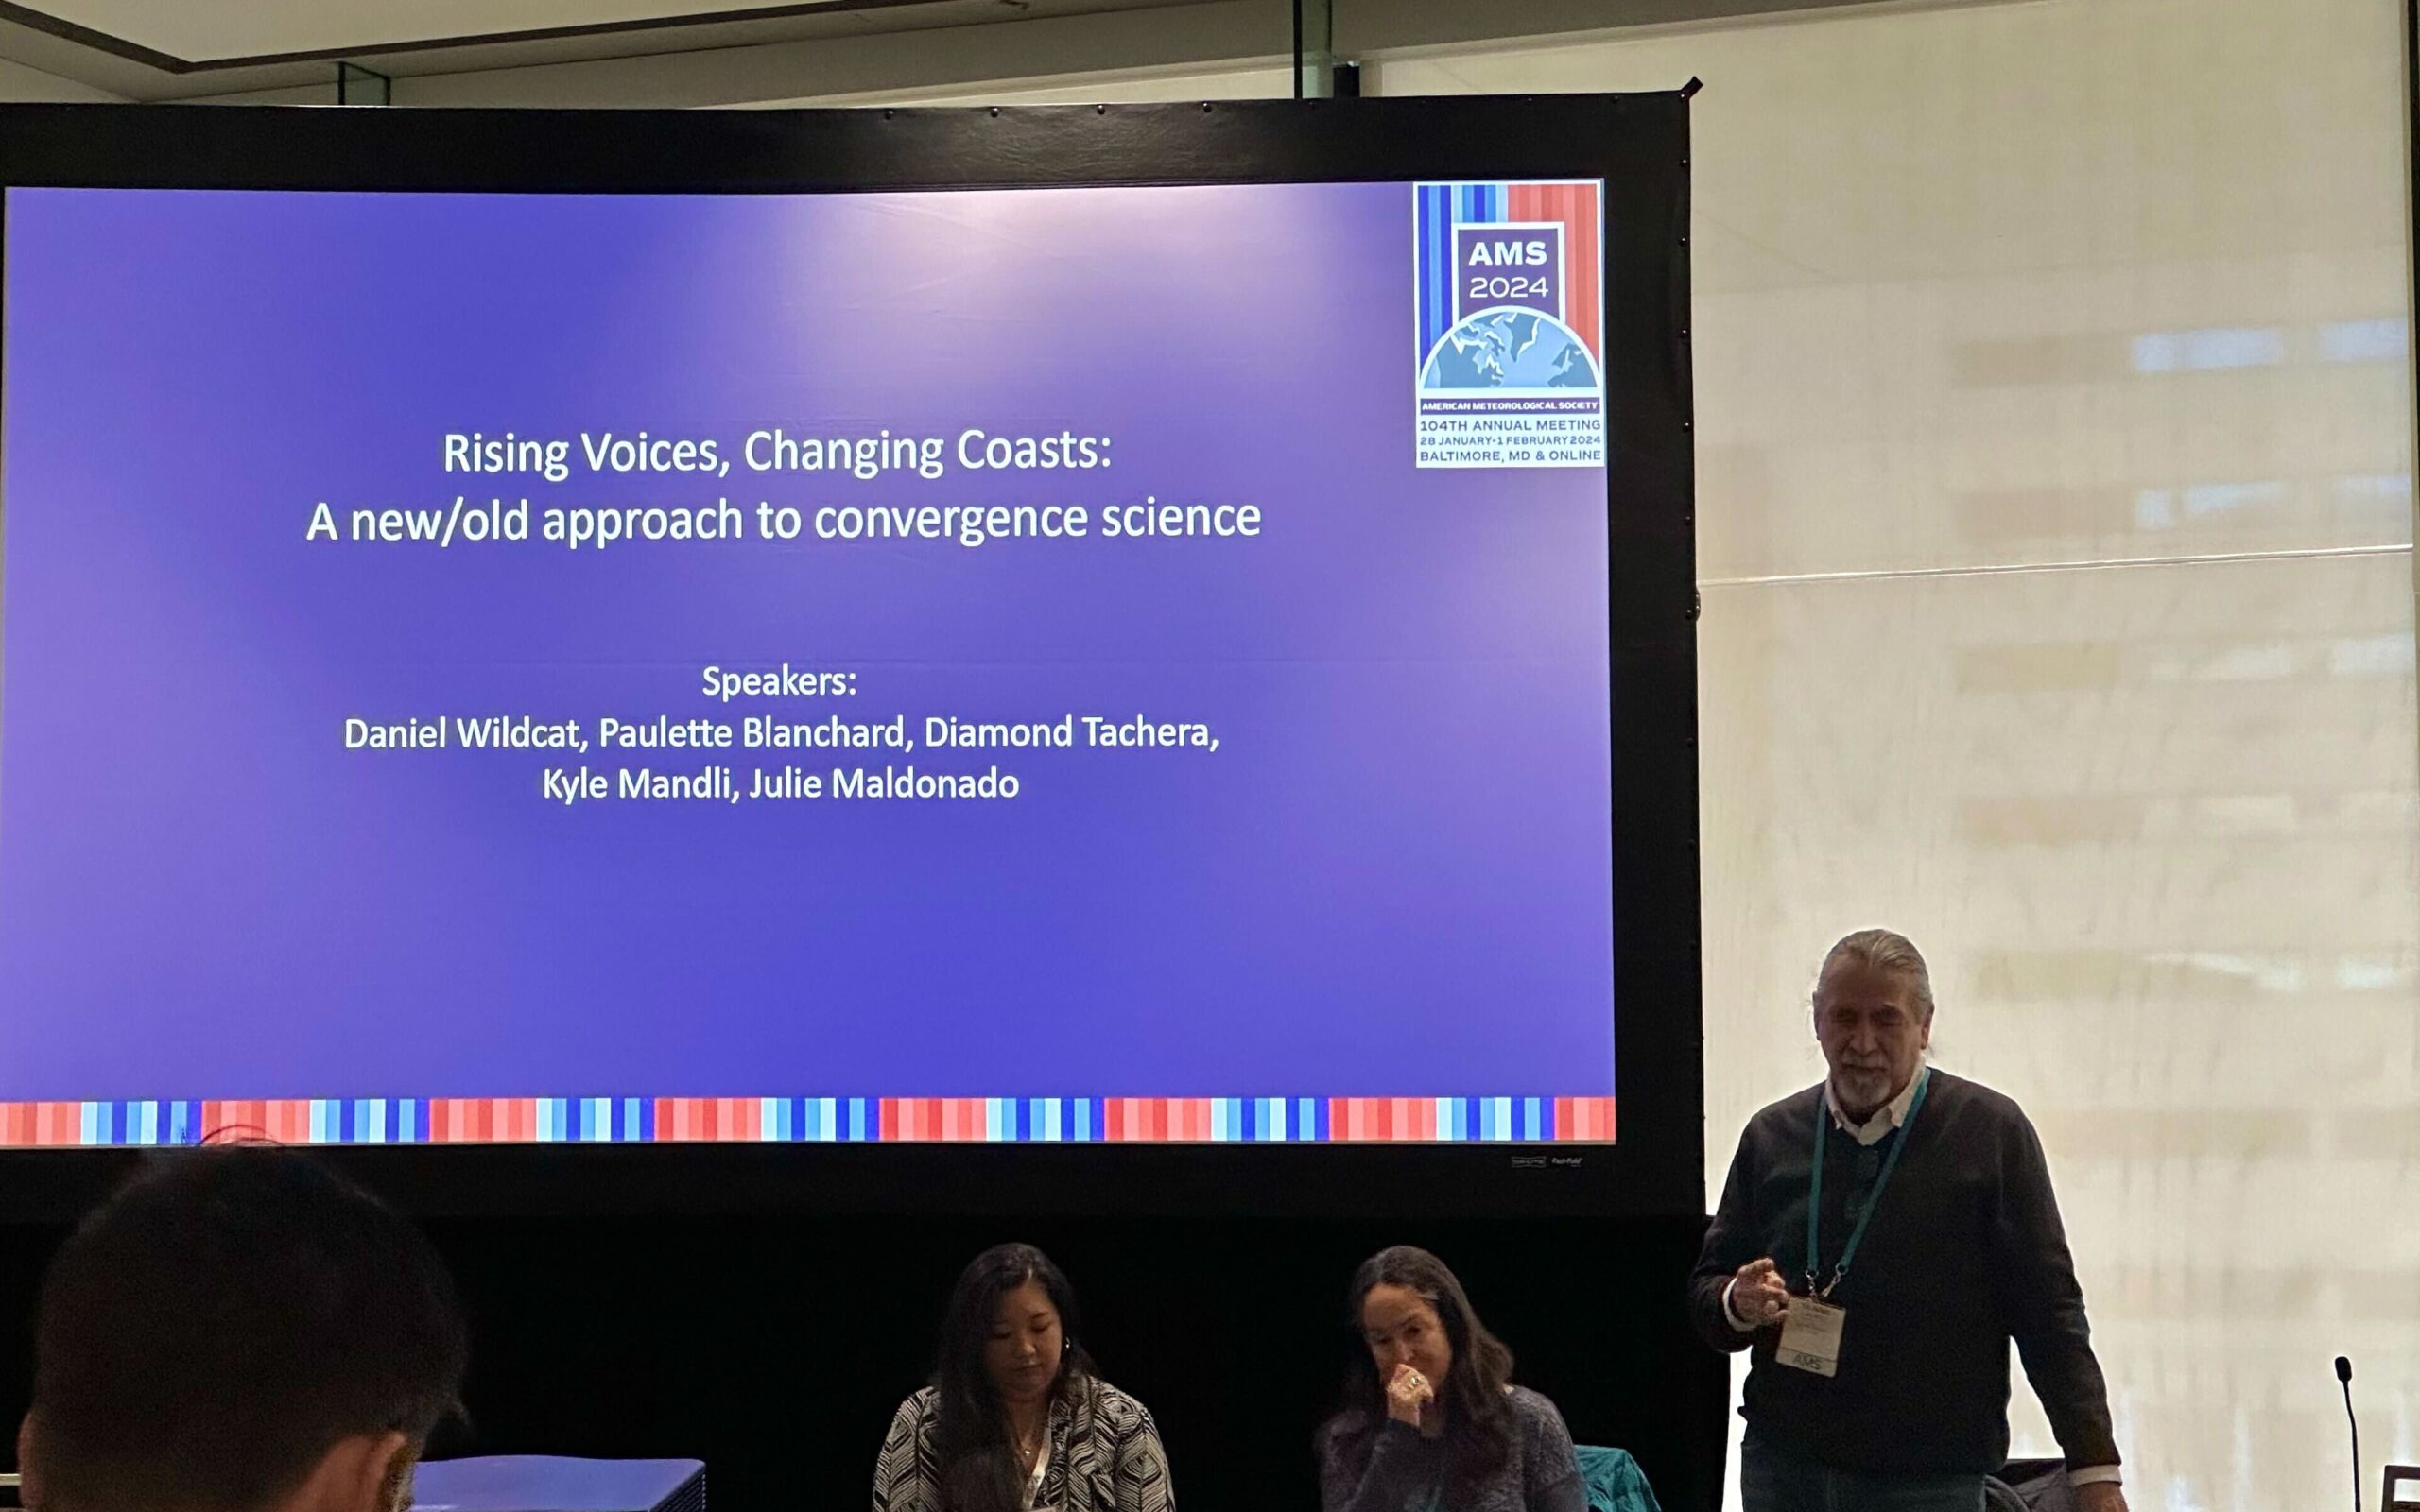
Photo of Daniel Wildcat speaking in front of a screen on which is displayed the words, "Rising Voices, Changing Coasts: A new/old approach to convergence science. Speakers: Daniel Wildcat, Paulette Blanchard, Diamond Tachera, Kyle Mandli, Julie Maldonado." Two people are sitting in front of the screen while Dr. Wildcat is standing.
RVCC Lead Investigator Daniel Wildcat giving an opening address during the first session of the Convergence Science symposium, “Rising Voices, Changing Coasts: A New/Old Approach to Convergence Science.” Photo credit: Isabella Herrera.

“From when we are babies, we are learning this method of kilo [a Hawaiian word literally translated as “observations,” but with much deeper meaning in practice] … It’s being able to know the rains and the winds,” she said. “I could tell you that this one tiny section in a road over from my road is constantly flooding … because the government paved a road over an old spring … I see this [particular microbial mat], and I know that comes from groundwater, so I know that that was a spring because I have this kilo, this observational experience.”

Historically, Indigenous scientists have often had to navigate the supposed duality of their identities – of being a scientist and a Native person – and have not been able to include their Indigenous knowledge in their work in the same way they can with the science taught to them through academic institutions. The convergence of western scientific knowledge and Indigenous knowledge is integral to the future of the WWC enterprise.

Suzanne Van Cooten, a citizen of the Chickasaw Nation and Regional Administrator of the USGS South Central Climate Adaptation Center (SC CASC), highlighted the importance of inviting Tribal nations and other groups that have historically been dismissed from climate and water conversations to scientific spaces. She shared her enthusiasm about the first time she was able to forecast for her homelands as a hydrologist.

Respectful Engagement, Not Exploitation

“I think a lot of the Tribes kind of feel like they get talked at more than they get talked with.”

-Daniel Wildcat
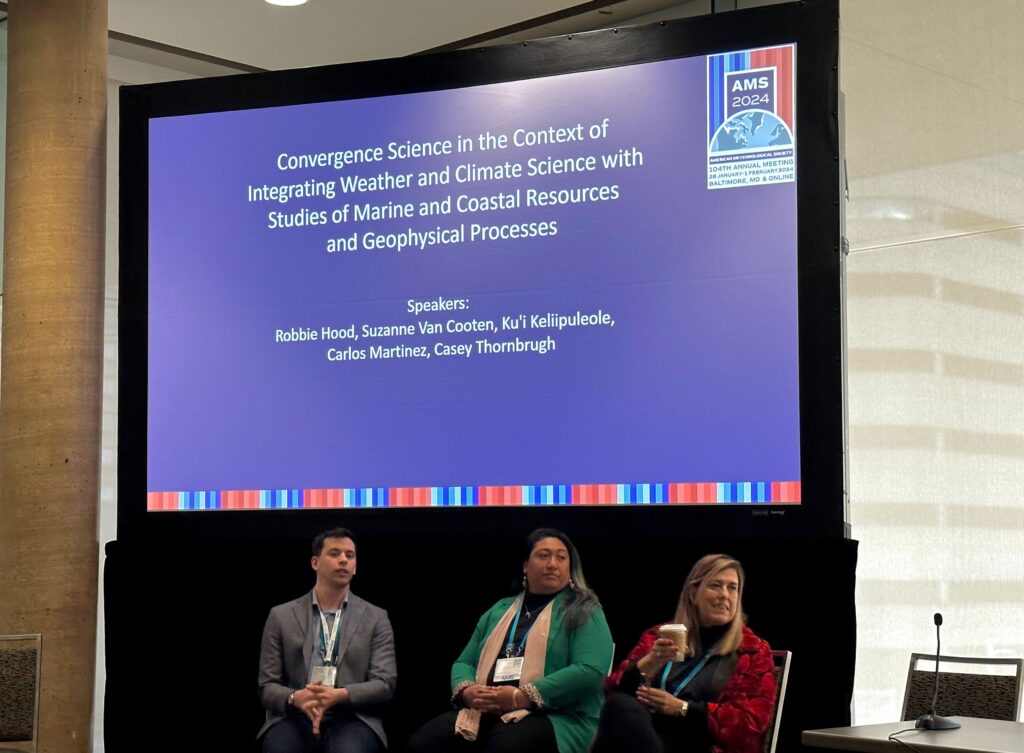
Three people sit in front of a screen (their names are listed in the caption below). The screen is displaying the words, "Convergence Science in the Context of Integrating Weather and Climate Science with Studies of Marine and Coastal Resources and Geophysical Processes.
Speakers: Robbie Hood, Suzanne Van Cooten, Ku'i Keliipuleole, Carlos Martinez, Casey Thornbrugh."
(left to right) Speakers Carlos Martinez, Kekuʻiapōiula (Kuʻi) Keliipuleole, and Suzanne Van Cooten during the panel session. Photo credit: Isabella Herrera.

The session also featured discussions of how to go about entering Indigenous spaces from the world of western (or, as Van Cooten prefers to say, colonial) science.

Carlos Martinez, a climate scientist, AAAS Science and Technology Policy Fellow, and program coordinator for the National Science Foundation Coastlines and People Program (CoPe), also serves as a board member of the AMS Board of Representation, Accessibility, Inclusion, and Diversity (BRAID). He talked about his experience working with communities on convergence science.

“One of the things I have learned [is] knowing my place in the room … understanding that what I share is through my lived experiences, and not imposing what other people’s experiences are,” Martinez told us. 

A humble, listening approach is important for effective engagement, yet non-Indigenous groups often fail to employ this approach when entering Indigenous spaces. “I think a lot of the Tribes kind of feel like they get talked at more than they get talked with,” Daniel Wildcat said. “This is systemic.”

“When immersing in a space with convergence science in mind, [one thing I learned is] actively listening; for example … listening to what the communities are interested in learning, what their needs and concerns are, and then if willing, provide resources or information in communication with one another,” Martinez said. “I always take criticism and feedback as a way for growth, as a way that I can be … a better scientist and a better human being.” 

Non-Indigenous scientists should consider their intent versus impact when working with Indigenous communities. Historically, the scientific community has engaged with Indigenous peoples in a way that has been exploitative and continues to perpetuate colonialism, even if the work itself was initially intended to benefit those same communities. 

“If you want to work with Indigenous people, then you’ve got to change how you think about what that work requires,” Wildcat told us. 

Aspects of science and academia can become obstacles to building trusting relationships – something that is deeply important in working with Indigenous people. Most researchers and policymakers aren’t able to spend the time to establish meaningful and authentic relationships with the tribes they may want to work with, and appropriated dollars can’t be spent on food to host community gatherings. 

“[Working with Indigenous people] requires time, it requires meetings where you don’t have an agenda,” Wildcat explained. “You go meet with people, find out what they’re doing, find out what their issues are. . .and then [consider ways you] could assist.”

One of the main challenges Tribes face when it comes to federal funding opportunities, Van Cooten explained, is having the capacity to co-produce applications for funding and then administer the funds. Tribal leaders and program officers are already spread far too thin within their own communities to dedicate any more of their time applying for, let alone managing, large grants. “Yes . . . it’s a huge amount of money, but it will also take a huge amount of management. And so that capacity in the Tribe to manage that, with all the reporting, with everything that’s going to go along with that funding . . . they don’t have that.”

Many of the challenges faced by Tribal Nations are intersectional, and the approaches taken to address them must be, as well. This also rings true for challenges in weather, water, and climate science. Communication is key to both building meaningful relationships and to realizing the full potential of convergence science.

“It’s not much different than trying to put a weather forecaster in the same room with a weather researcher,” Hood told us. “. . .they talk a different language and they’ve got different metrics for what’s important, but if you give them that chance to talk, they’ll work it through. … We just need to open our minds and think about it from both points of view.”

A Change in Culture

These discussions made me consider the profound impacts that this shift in worldview could have on science and society as a whole.

Physical and biological sciences are intrinsically linked, and the need to integrate these two broad disciplines sparked the usage of the term “convergence science” in the first place. Does “western science” continue to limit itself by viewing the Earth and its systems (including biological systems) as entirely separate entities? How is that restriction reinforced by rigid academic and scientific institutions? How can we realize the full potential of convergence science (across various scientific disciplines, and across cultures and communities)?

As Keliipuleole told us, the scientific community “needs more of us to see the world the way that [Native people] see it, and not the way academia raised us to see it.”

There needs to be a culture change. There needs to be capacity building for and within Tribal Nations so that non-Indigenous scientists can engage with Indigenous science, and at universities and Tribal Colleges so students holding this Indigenous knowledge can be a part of the future of the scientific enterprise. There needs to be more of an effort to not just include but to amplify Indigenous voices in spaces like the AMS. The convergence of the western and Indigenous weather, water, and climate sciences must address the ongoing role of colonialism in modern scientific practices, and acknowledge the value of Indigenous science in and of itself.

As Van Cooten said at the start of the discussion:  

“[Science] should be inclusive to all communities, not just primarily those that have the loudest voice.”

Header photo credit: Isabella Herrera.

Recordings of all Convergence Science symposium sessions are available now to registered attendees of the AMS 104th Annual Meeting (log in and find each session through the online program). All recordings will be available to the public beginning three months after the meeting.

About the AMS 104th Annual Meeting

The American Meteorological Society’s Annual Meeting brings together thousands of weather, water, and climate scientists, professionals, and students from across the United States and the world. Taking place 28 January to 1 February, 2024 at the Baltimore Convention Center, the AMS 104th Annual Meeting explored the latest scientific and professional advances in areas from renewable energy to space weather, weather and climate extremes, environmental health, and more. In addition, cross-cutting interdisciplinary sessions explored the theme of Living in a Changing Environment, especially the role of the weather, water, and climate enterprise in helping improve society’s response to climate and environmental change. Learn more at annual.ametsoc.org.
AMS 2024 Session Highlight: Transition to Carbon-Free Energy Generation

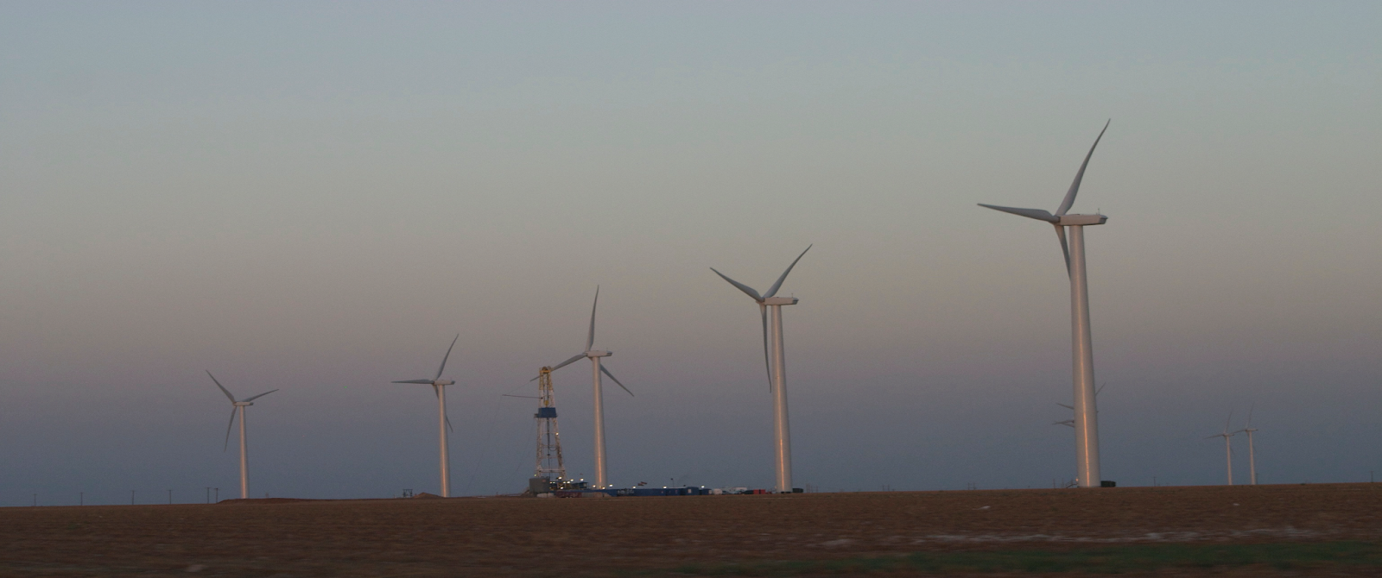
A line of wind turbines

The AMS 2024 Presidential Panel Session “Transition to Carbon-Free Energy Generation” discusses crucial challenges to the Energy Enterprise’s transition to renewables, and the AMS community’s role in solving them. Working in the carbon-free energy sector on research and development including forecasting and resource assessment, grid integration, and weather and climate effects on generation and demand, the session’s organizers know what it’s like to be on the frontlines of climate solutions. We spoke with all four of them–NSF NCAR’s Jared A. Lee, John Zack of MESO, Inc., and Nick P. Bassill and Jeff Freedman of the University at Albany–about what to expect, and how the session ties into the 104th Annual Meeting’s key theme of “Living in a Changing Environment.” Join us for this session Thursday, 1 February at 10:45 a.m. Eastern!

What was the impetus for organizing this session?

Jared: With the theme of the 2024 AMS Annual Meeting being, “Living in a Changing Environment,” it is wonderfully appropriate to have a discussion about our in-progress transition to carbon-free energy generation, as a key component to dramatically reduce the pace of climate change. But instead of merely having this be yet another forum in which we lay out the critical need for the energy transition, we organized this session with these panelists (Debbie Lew, Justin Sharp, Alexander “Sandy” MacDonald, and Aidan Tuohy) to shine a light on some real issues, hurdles, and barriers that must be overcome before we can start adding carbon-free energy generation at the pace that would be needed to meet aggressive clean-energy goals that many governments have by 2040 or 2050. The more that the weather–water–climate community is aware of these complex issues, the more we as a community can collectively focus on developing practical, innovative, and achievable solutions to them, both in science/technology and in policy/regulations. 

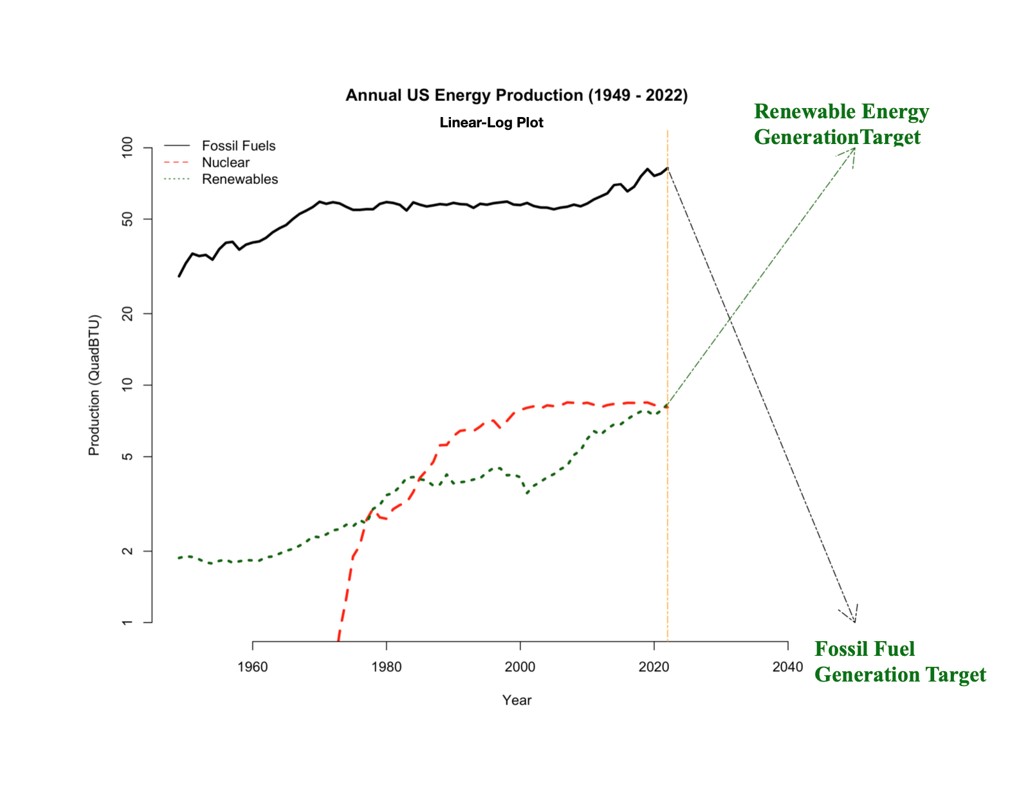
Jeff: We are at an inflection point in terms of the growth of renewable energy generation, with hundreds of billions of dollars committed to funding R&D efforts. To move forward towards renewable energy generation goals requires an informed public and providing policy makers with the information and options necessary.

Required fossil fuel and renewable energy production trajectories to meet renewable energy goals. Graphic by Jeff Freedman, using data from USEIA.

Since now both energy generation and demand will be dominated by what the weather and climate are doing, it is important that we take advantage of the talent we have in our community of experts to support these efforts. We are only 16 years out from a popular target date (2040) to reach 100% renewable energy generation. That’s not very far away. Communication and the exchange of ideas regarding problems and potential solutions are key to generating public confidence in our abilities to reach these goals within these timelines without disruption to the grid or economic impacts on people’s wallets.

What are some of the barriers to carbon-free energy that the AMS community is poised to help address?

Jeff and John: From a meteorological and climatological perspective, we have pretty high confidence in establishing what the renewable energy resource is in a given area. .. We have, for the most part, developed very good forecasting tools for predicting generation out to the next day at least. But sub-seasonal (beyond a week) and seasonal forecasting for renewables remains problematic. We know that the existing transmission infrastructure needs to be upgraded, thousands of miles of new transmission needs to be built, siting and commissioning timelines need to be shortened, and we need to coordinate the retirement of fossil fuel generation and its simultaneous replacement with renewables to insure grid stability. This panel will discuss some of the potential solutions we have at hand, and what is/are the best pathway(s) forward. 

On the other hand, meeting the various state and federal targets regarding 100% renewable energy generation also implicates other unresolved issues, such as:  how will we accelerate the necessary mining, manufacturing, and construction and operation by a factor of nearly five in order to achieve these power generation goals? Not to mention how all this is affected by financing, the current patchwork of … regulatory schemes, NIMBY issues, and a constantly changing landscape of policy initiatives (depending on how the political wind is blowing–sorry for the pun!). And of course, there is the question of the “unknown unknowns!”

What will AMS 104th attendees gain from the session?

Nick: Achieving the energy transition is fundamental for the health and success of all societies globally, and indeed, may be one of the defining topics of history books for this time. With that said, the transition to carbon-free energy will not be a straight line, and many factors are important for achieving success. This session should provide an understanding of the current status of our transition, and what obstacles and key questions need to be overcome and answered, respectively, to complete our transition.

Header photo: Wind turbines operating on an oil patch in a wind farm south of Lubbock, Texas. Photo credit: Jeff Freedman.

About the AMS 104th Annual Meeting

The American Meteorological Society’s Annual Meeting brings together thousands of weather, water, and climate scientists, professionals, and students from across the United States and the world. Taking place 28 January to 1 February, 2024, the AMS 104th Annual Meeting will explore the latest scientific and professional advances in areas from renewable energy to space weather, weather and climate extremes, environmental health, and more. In addition, cross-cutting interdisciplinary sessions will explore the theme of Living in a Changing Environment, especially the role of the weather, water, and climate enterprise in helping improve society’s response to climate and environmental change. The Annual Meeting will be held at the Baltimore Convention Center, with online/hybrid participation options. Learn more at annual.ametsoc.org

Be There: The Kuo-Nan Liou Symposium

Highlighting Key Sessions at AMS 2024

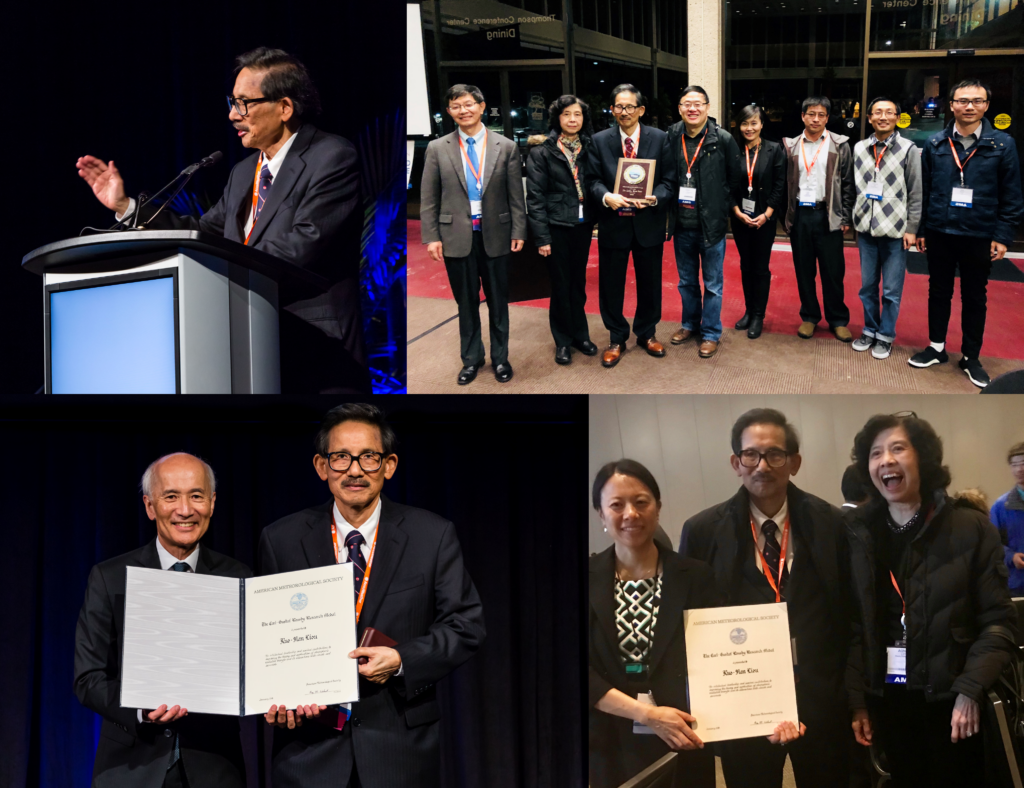
The Kuo-Nan Liou Symposium at the 104th AMS Annual Meeting will celebrate Dr. Kuo-Nan Liou (1943-2021), a giant in the field of atmospheric physics who made crucial contributions in the areas of atmospheric radiation, remote sensing, and the greenhouse impacts of clouds and aerosols. Liou (pictured at right, image courtesy of Penny Jennings), received numerous accolades during his career, including the AMS’s Carl-Gustaf Rossby Research Medal and Charney Award, and he was part of the Intergovernmental Panel on Climate Change team who received the Nobel Peace Price in 2007.

We asked Symposium Co-Chair Ping Yang, University Distinguished Professor and David Bullock Harris Chair in Geosciences at Texas A&M University, about the Symposium and Dr. Liou’s impact. Here are some of his answers:

Dr. Kuo-Nan Liou (image credit: Penny Jennings)

Why are the areas of Dr. Liou’s research so important to understand right now?

As one of the most accomplished atmospheric scientists in the world, Dr. Liou made seminal contributions to atmospheric and climate sciences in many areas, particularly in atmospheric radiation. His radiative transfer model has been widely used in weather and climate models and satellite remote sensing implementations, and thus plays a central role in determining the radiation budget of the earth-atmosphere system and cloud-aerosol-radiation interactions and feedback in a changing world.

Radiative transfer is important because almost all the energy that drives the Earth’s atmosphere and ocean currents originates from the sun. Therefore, the climate of the Earth-atmosphere system is mainly determined by the radiation balance at the top of the atmosphere and the surface since radiation is the only mechanism by which the Earth-atmosphere system gains or loses energy.

What can attendees expect from the Symposium?

This symposium honors the legacy of Dr. Kuo-Nan Liou by bringing together researchers to share knowledge, foster collaborations and address current challenges in the fields where Dr. Kuo-Nan Liou left a lasting impact. Attendees, both in-person and virtual, can benefit from gaining insights into the latest research and advancements in these areas. Session topics include “Interactions Among Climate, Radiation, Clouds, Aerosols, and Surface”, “Radiative Transfer Theory & Spectroscopy,” “Remote Sensing of Clouds, Aerosols, and Surface Properties,” and “Light Scattering and Applications.” The Symposium will provide a platform for networking and engaging with experts and a forum for disseminating cutting-edge research findings.

The Symposium will delve into the forefront issues within these research areas. Noteworthy presentation topics include the lidar remote sensing of snow depth and density, sub-millimeter-wave remote sensing of ice clouds, Tibetan Plateau snowpack loss and its connection to extreme events, and more.

The first session aligns with the central focus of the 2024 AMS Annual Meeting, “Living in a Changing Environment.” It features invited speakers Drs. Ruby Leung, Dennis Hartmann, V. Ramaswamy, Zhanqing Li, Jonathan Jiang, and Yongkang Xue. 

How did Dr. Liou influence the fields of atmospheric and climate science?

Dr. Liou’s work left a profound mark on the atmospheric and climate sciences due to his seminal contributions to radiative transfer, atmospheric optics, cloud-aerosol-radiation-climate interactions, and remote sensing. He was a pioneering researcher who demonstrated that atmospheric radiation should no longer be consigned to the fringes of meteorology, but instead should take a central place in the new world of climate science.

His book, “An Introduction to Atmospheric Radiation,” now in its second edition (with the first edition published in 1980), has been an invaluable resource for students and researchers around the world studying atmospheric radiation and its applications in climate science and remote sensing. Accepting the Rossby Medal in 2018, Prof. Liou talked about how his own early-career exposure to books like Chandrasekhar’s “Radiative Transfer” and Born & Wolf’s “Principles of Optics” spurred his innovations. For example, his simplified solutions for understanding solar and heat energy transfer problems, and his application of geometric optics to understand the scattering, absorption, and polarization properties of soot aerosols and irregular ice crystals.

He also humbly thanked his graduate students at the University of Utah and UCLA, saying, “They deserve to share, in equal measure, any recognition I have received, including this great honor from AMS.” We, the organizers of the Symposium, in turn are grateful to Dr. Liou. Along with his exceptional impact on the atmospheric sciences, he was a true role model as a leader and educator.

Kuo-Nan Liou receiving the Carl-Gustaf Rossby Research Medal at the 2018 AMS Annual Meeting and celebrating with his family, students, and colleagues. Photos provided by Liou Symposium co-chairs.

The Kuo-Nan Liou Symposium will be held Tuesday, 30 January, 2024 at the AMS 104th Annual Meeting, in Baltimore and online; it will feature invited presentations and a poster session, along with a special luncheon. Learn more about the Symposium and view the program.

A Few Takeaways from the “State of the Climate in 2022”

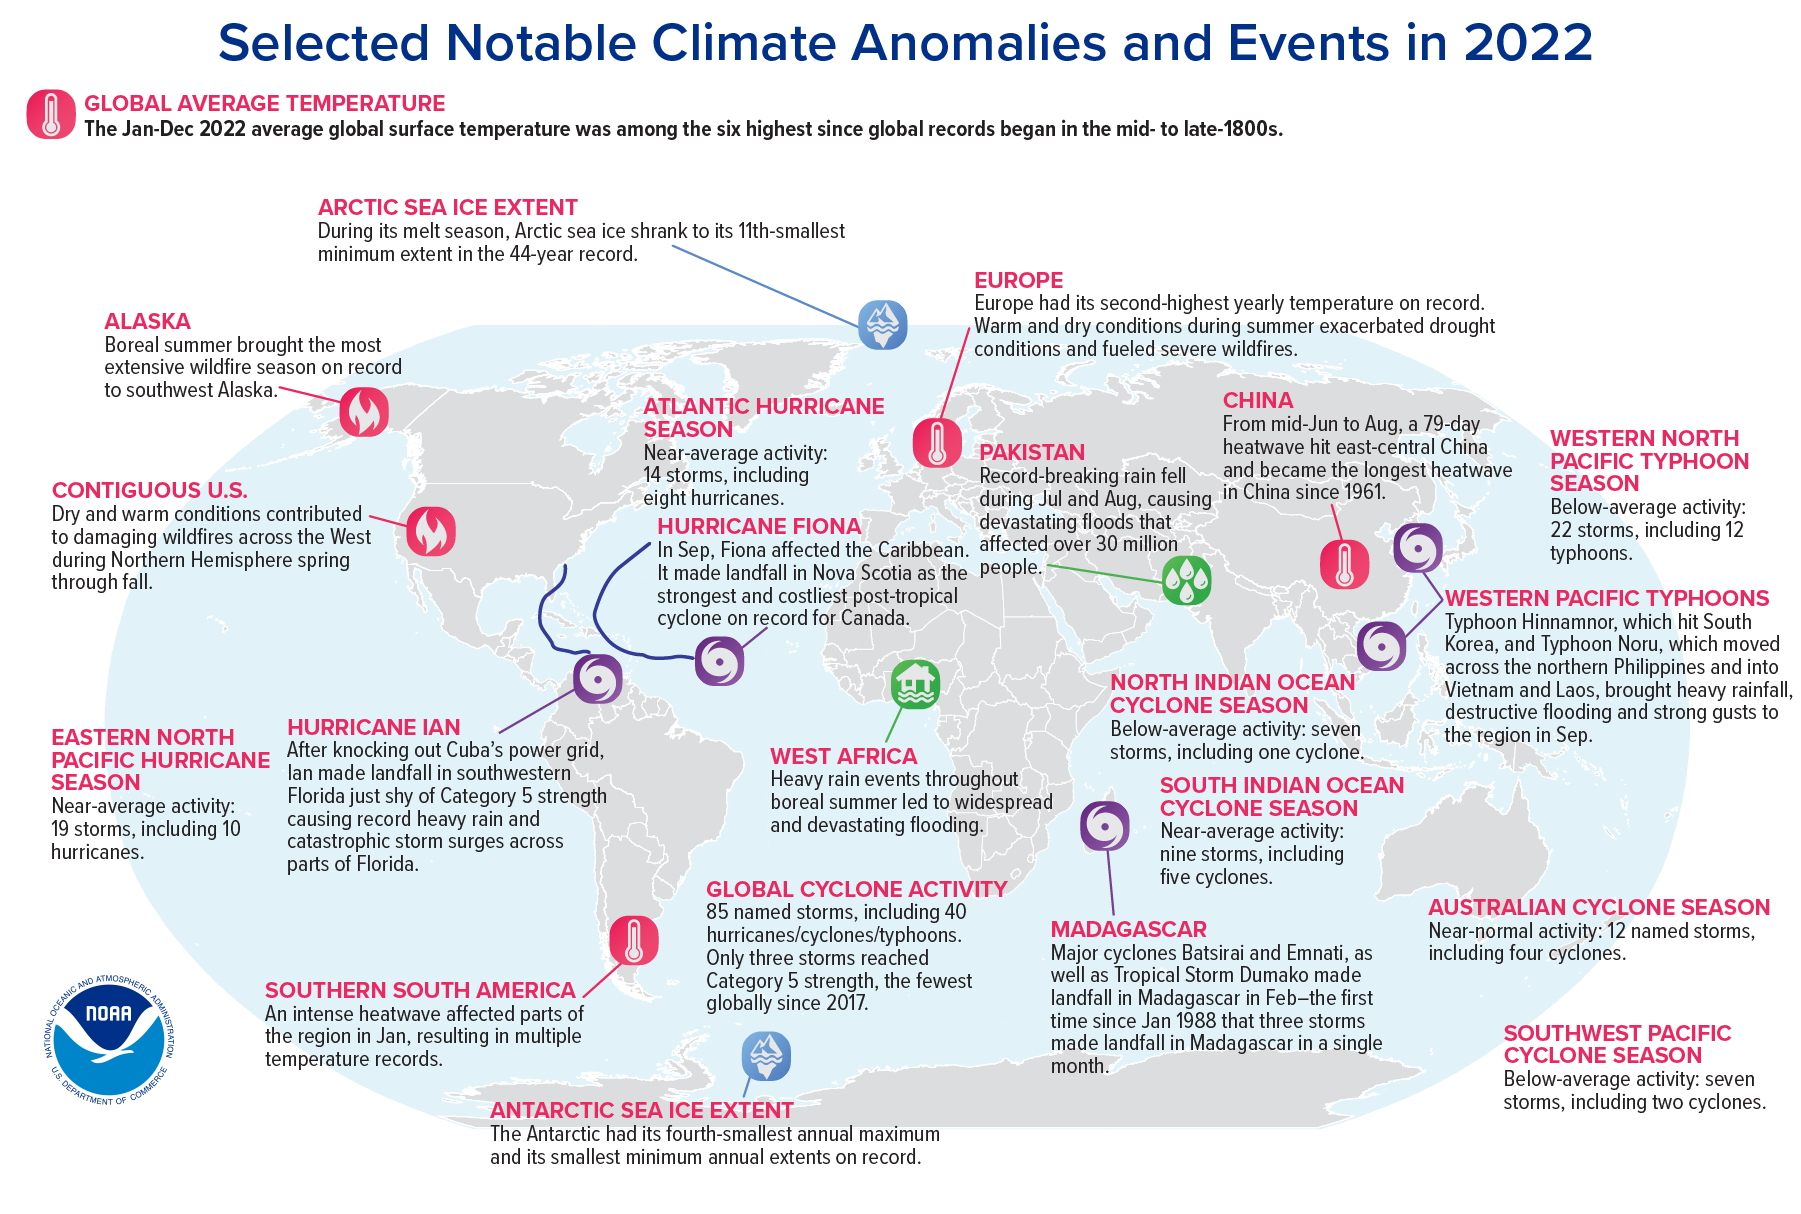
Map of significant global weather and climate anomalies and events of 2022.

Record-high greenhouse gases, sea levels, monsoons, and droughts—and a volcanic vapor injection

By Michael Alexander, Lead, Atmosphere Ocean Processes and Predictability (AOPP) Division, NOAA, and BAMS Special Editor for Climate

The annual NOAA/AMS State of the Climate report has just been released, with a comprehensive global look at the climate in 2022. Produced by the NOAA National Centers for Environmental Information (NCEI) and the American Meteorological Society, the State of the Climate Report maps out the complex, interconnected climate phenomena affecting all parts of the globe. It also charts global progress in observing and understanding our climate system. 570 scientists from 60 countries contributed to this year’s report, including a rigorous peer review, making it a truly global endeavor. 

As the senior editor on this project, I wanted to share with you a few highlights. Click here to read the full report, published as a supplement to the Bulletin of the American Meteorological Society.

New record-highs for atmospheric greenhouse gases CO2, methane, and nitrous oxide.

It was yet another record-setting year for atmospheric carbon dioxide and other greenhouse gases. 2022 saw an average concentration of 417.1 ± 0.1 ppm for atmospheric CO2; methane and nitrous oxide also reached record highs. 

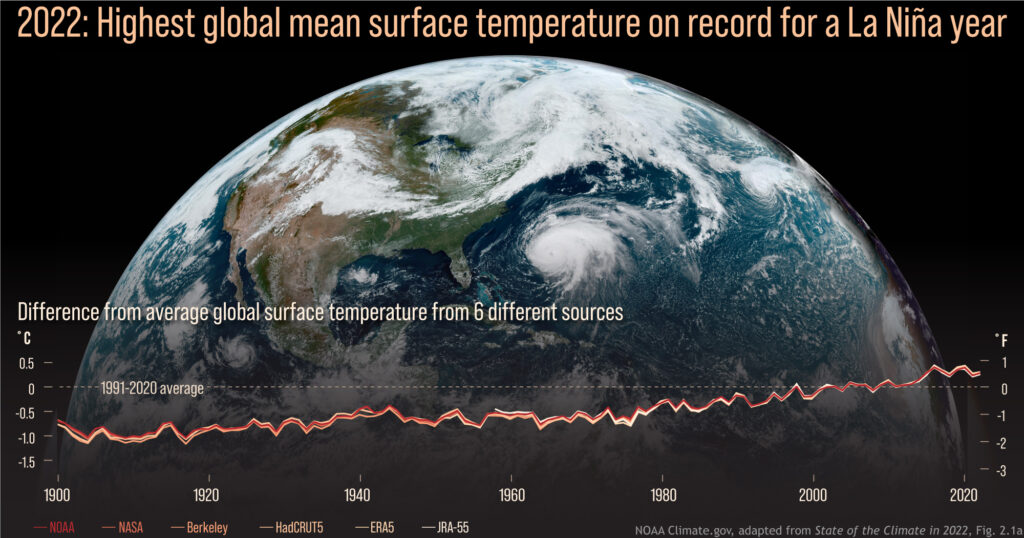
Graphs of yearly global surface temperature compared to the 1991-2020 average for each year from 1900 to 2022, from 6 data records, overlaid on a GOES-16 satellite image from September 22, 2022.  Image credit: NOAA Climate.gov.

Warmest La Niña year on record.

Despite being in the typically cooler La Niña phase of ENSO, 2022 was among the six warmest years on record, and was the warmest La Niña year ever recorded. Summer heat waves left annual temperatures at near-record highs in Europe, China, the Arctic, and Antarctica (parts of Europe set daily or seasonal heat records), and New Zealand experienced its warmest year ever. High-pressure “heat domes” helped elevate local temperatures in many areas, including parts of North America and Europe. 

Record-high global mean sea level and ocean heat.

Global mean sea level reached 101.2mm above 1993 levels, setting a new record for the 11th year in a row. 2022 also saw record-high global ocean heat content (as measured to 2000 meters below the surface), although La Niña moderated sea-surface temperatures.

Image credit: NOAA

Complex climate picture.

Global warming trends continued apace, but of course numerous large-scale climate patterns complicated the picture. In 2022 we saw the first “triple-dip” La Niña event (third consecutive La Niña year) of the 21st century. The Indian Ocean Dipole had one of its strongest negative events since 1982, which led to increased temperatures and precipitation in the eastern Indian Ocean. Along with La Niña, this contributed to record-breaking monsoon rains in Pakistan that caused massive flooding and one of the world’s costliest natural disasters. We also had a positive-phase winter and summer North Atlantic Oscillation affecting weather in parts of the Northern Hemisphere. 

A bad year for drought.

For the first time ever, in August 2022, 6.2% of the global land surface experienced extreme drought in the same month, and 29% of global land experienced at least moderate drought. Record-breaking droughts continued in equatorial East Africa and central Chile. Meanwhile, parts of Europe experienced one of their worst droughts in history, and China’s Yangtze River reached record-low levels.

Warmth and high precipitation at the poles.

2022 was the firth-warmest year recorded for the Arctic, and precipitation was at its third-highest level since 1950. The trend toward loss of multi-year sea ice continued. Meanwhile, Antarctic weather stations recorded their second-warmest year ever, including a heatwave event that collapsed the Conger Ice Shelf, and two new all-time record lows in sea-ice extent and area set in February. On the other hand, record snow/icefall due to atmospheric rivers led to the continent’s highest recorded snow/ice accumulation since 1993.

Image credit: NOAA

Notable storms: Ian and Fiona.

85 named tropical cyclones were observed across all ocean basins, an approximately average number. Although there were only three Category 5 storms, and the lowest recorded global accumulated cyclone energy, the year produced Hurricane Ian, the third-costliest disaster in U.S. history, as well as Hurricane Fiona, Atlantic Canada’s most destructive cyclone.

Massive volcanic injection of atmospheric water vapor.

The Hunga Tonga-Hunga Ha’apai submarine volcano in the South Pacific injected a water plume into the atmosphere of unprecedented magnitude (146+/-5 Terragrams, about 10% of the stratosphere’s total water) and height (reaching into the mesosphere). We don’t yet know what, if any, long-term effects this will have on the global climate, although the increase in water vapor has interfered with some earth system observations. 

The full report is a comprehensive and fascinating analysis of our climate system in the previous calendar year. I urge you to read it and communicate your own takeaways from the State of the Climate in 2022. You can read the press release here.

Infographic at top: World map showing locations of significant climate anomalies and events in 2022. Credit: NOAA.

An Anticipated Increase in Earth's Strongest Storms

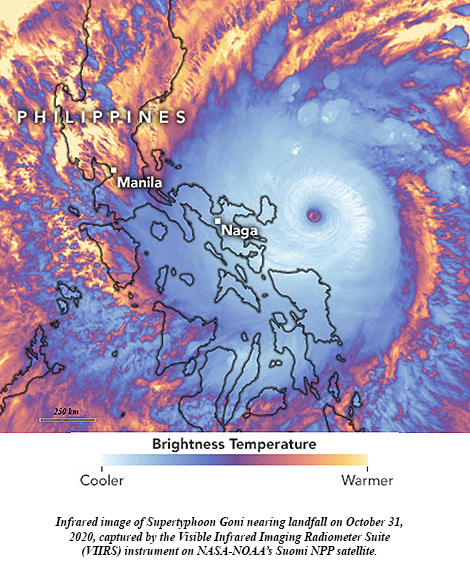
GoniA little more than two weeks ago, Supertyphoon Goni blasted ashore in the Philippines with top sustained winds of 195 mph, becoming the strongest landfalling tropical cyclone on record. It topped STY Haiyan’s 190 mph land strike just seven years ago. With Hurricane Iota in the Caribbean explosively intensifying 100 mph in under 24 hours to reach Category 5 intensity Monday, it set a new record of five consecutive years of Cat 5 hurricanes in the North Atlantic tropical cyclone basin. Among the seven catastrophic hurricanes, starting with Matthew in 2016, were Dorian and Irma, packing 185 mph and 180 mph steady winds, respectively, with peak gusts well over 200 mph.
Goni is the latest formidable example of an increasing trend in tropical cyclone intensity. While Goni established a new landfall wind intensity record, Iota and other recent major hurricanes Eta, Zeta, and Delta set or challenged records for most intense hurricanes so late in the season.
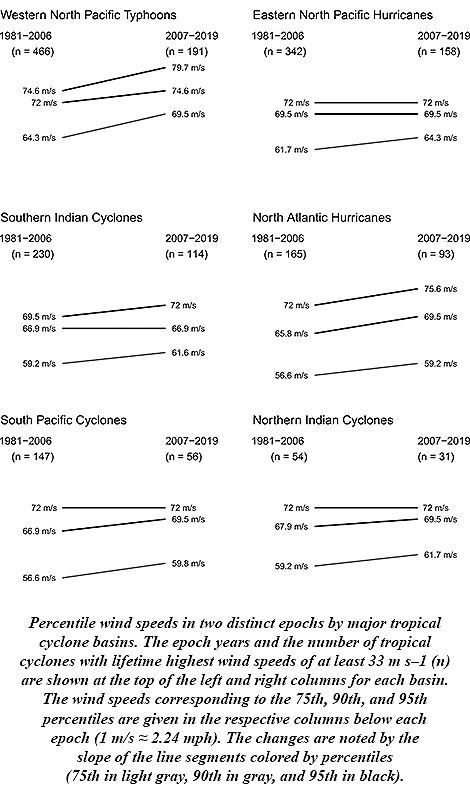
PercentilesJames Elsner of Florida State University says this is to be expected. His research stated in 2008 that there was an upward trend in the intensity of the most intense tropical cyclones. Rising ocean temperatures, as theory predicted, were driving the trend. And with oceans continuing to warm along with Earth’s climate since then, Elsner anticipated the continuing upward trend. New research published in the Bulletin of the American Meteorological Society confirms his prediction, finding that another 3.5 to 4.5 percent increase in intensity has occurred with the strongest tropical cyclones during the period 2007-19.
Globally, all basins show upward trends, Elsner says, with the North Atlantic and Western North Pacific revealing the steepest and most consistent upticks.

An Anticipated Increase in Earth’s Strongest Storms

GoniA little more than two weeks ago, Supertyphoon Goni blasted ashore in the Philippines with top sustained winds of 195 mph, becoming the strongest landfalling tropical cyclone on record. It topped STY Haiyan’s 190 mph land strike just seven years ago. With Hurricane Iota in the Caribbean explosively intensifying 100 mph in under 24 hours to reach Category 5 intensity Monday, it set a new record of five consecutive years of Cat 5 hurricanes in the North Atlantic tropical cyclone basin. Among the seven catastrophic hurricanes, starting with Matthew in 2016, were Dorian and Irma, packing 185 mph and 180 mph steady winds, respectively, with peak gusts well over 200 mph.

Goni is the latest formidable example of an increasing trend in tropical cyclone intensity. While Goni established a new landfall wind intensity record, Iota and other recent major hurricanes Eta, Zeta, and Delta set or challenged records for most intense hurricanes so late in the season.

PercentilesJames Elsner of Florida State University says this is to be expected. His research stated in 2008 that there was an upward trend in the intensity of the most intense tropical cyclones. Rising ocean temperatures, as theory predicted, were driving the trend. And with oceans continuing to warm along with Earth’s climate since then, Elsner anticipated the continuing upward trend. New research published in the Bulletin of the American Meteorological Society confirms his prediction, finding that another 3.5 to 4.5 percent increase in intensity has occurred with the strongest tropical cyclones during the period 2007-19.
Globally, all basins show upward trends, Elsner says, with the North Atlantic and Western North Pacific revealing the steepest and most consistent upticks.

Online Climate Science Course Keys Success to Frequent Forum Discussions

While colleges pre-COVID-19 were already designing and implementing courses for online instruction, the pandemic has pushed entire academic course offerings into this rapidly evolving virtual environment. A new article in the Bulletin of the AMS about an online climate science course for undergraduates, which was developed, offered, and honed to near-perfection based on postcourse surveys before coronavirus, provides this tip for virtual success: Have students engage each other often, one-on-one, in a discussion forum. The result, the instructors are finding, is improved comprehension, with a high percentage of students successfully absorbing and accurately communicating course material.

The online course is titled, “Climate and Climate Change,” and has been offered through the Department of Atmospheric and Oceanic Sciences (AOS) at the University of Wisconsin—Madison since 2013. “Students enrolled in this course learn the physical principles governing Earth’s climate and climate change within the broader context of societal impacts and global political considerations,” writes lead author Andrew M. Dzambo and colleagues in the article.

The goal, they write, is to improve student science literacy and address misconceptions by implementing a key learning tool: “the weekly discussion forum where students engage with each other while testing their own knowledge.” The result is an increased knowledge of climate science and the Earth-climate system, as the surveys showed.

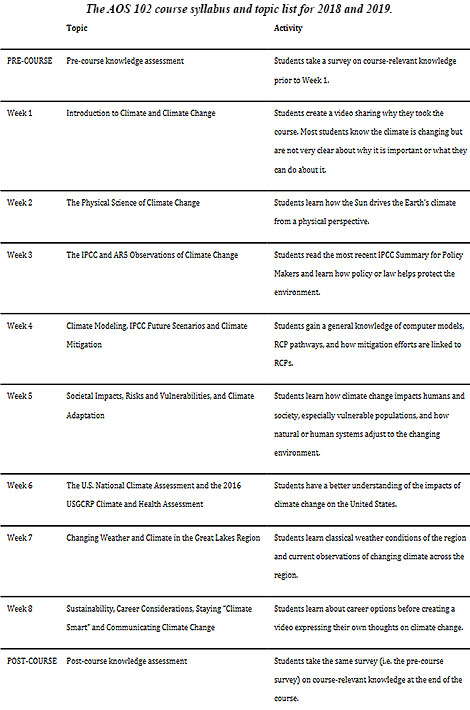
The course—AOS 102—has been improved since its inception, and it grew in popularity when it was moved to summer semester in 2016. It expanded its capacity in 2018 to accommodate a growing waitlist of interested students. The course is delivered through weekly worksheets, quizzes, and a final project, but it’s the weekly forum discussions that instructors credit with students’ retaining and being able to discuss climate science.

In their article, the authors present a template of the course for implementation with other atmospheric or Earth-related science coursework:

Although the discussion forums were monitored by course instructors, every student engaged other students at least once a week and freely expressed their own fact-based feedback to one another. By having the majority of the weekly course grade centered around discussion forums and worksheet assignments, complemented with weekly quizzes and an independent final project, the majority of students leave the class with a fundamental understanding of climate science (as evidenced by the course surveys) and with the confidence that they feel well informed about climate change.

Syllabus

Welcome to the Sticky Skies: Costlier Air Travel in a Warmer, Wetter World

COVID-19 has upended air travel for now, but if the growth in global aviation resumes, one real drag on flying is going to be increasing energy needs due to global warming. New research published in the Bulletin of the American Meteorological Society by Diandong Ren (Curtin University, Perth) et al. shows that Earth’s warming climate is going to have an often overlooked—but costly—impact on the fuel consumption of airplanes. The reason: increased viscosity, or “stickiness,” of the air.

For starters, a warming atmosphere will expand and become less dense, reducing the lift produced by aircraft wings, which means planes must increase speed and burn more fuel to maintain carrying capacity. This disadvantage counteracts any fuel advantages of flying in thinner (less resistant) air. There are other small effects on engine efficiency. In all, there is some ambiguity about the direct effect of the warming atmosphere on fuel needs at cruising altitudes. But Ren et al. point to a much larger fuel impact due to increasing atmospheric viscosity.

In a warmer world, more water can evaporate into the air. The extra molecules of water increase the drag on aircraft and that in turn will cause planes to fight harder to cruise through the air, requiring additional fuel. The increasing drag turns out to be the dominant issue—and could become very expensive.

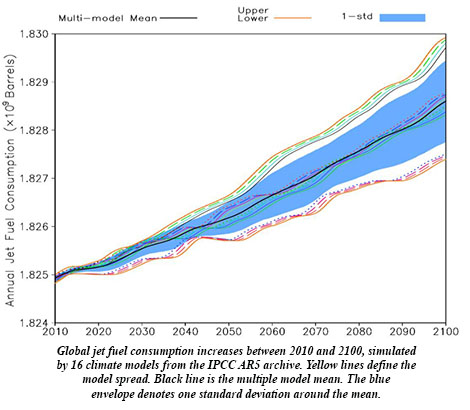
Fuel increaseRen et al. use an ensemble of 34 climate models to project that aviation fuel requirements by the end of the century could be an extra 160 million gallons per year due to viscosity, approaching an extra $1 billion per year in costs more than today in a scenario in which fossil fuel use is basically unabated.
The findings take account of regional and altitudinal variations in warming for different projections based on different amounts of emissions predicted. They also take into account the most trafficked flight paths, based on recent airline data. For example, some high altitude cooling at high latitudes would mitigate the effects of drag in near-polar routes, but few jets fly these paths. Flights at mid- to low-latitudes experience the biggest increases in drag—less than 2% per century, but enough to have  consequences in fuel usage. Overall, an air viscosity increase leads to about a 0.22% increase in fuel consumption by the year 2100 over 2010.

While these costs are still a small fraction of the total aviation fuel usage, they are yet another incentive for the industry to mitigate global warming through emissions reductions, as well as to pursue adaptations and efficiencies in aviation technology.

Keeping Score When Temperature Records Are the Expectation

Through July, 2020 has been on almost the same track as 2016: the two years had the hottest first seven months in NOAA’s 141 year dataset of global surface temperatures (land and ocean combined). Since 2016 turned out to be the hottest year on record, it might seem as if this fast start puts 2020 on track to set a new record, too, or to be a near miss. NOAA says it’s already “very likely” 2020 will be among the five hottest years on record.

But in the strange reality of ever rising global temperatures, it’s not so much the first half of the year that puts 2020 on the verge of a record. It’s the underlying trend of warming: 2020 was already on the verge on New Year’s Day.

As the new State of the Climate in 2019 released last week points out, the six hottest years in the last century and a half were…exactly the last six years, 2014-2019. Due to global warming, practically every year’s surface temperature is going to be a hot one. Just by showing up at the starting line, every year is a serious threat to set a new standard.

A paper recently published in the Bulletin of the American Meteorological Society puts this relentless streak of rising temperature expectations in terms of probabilities. There’s a greater than a 99% chance that most of the next 10 years through 2028 will be ranked among the top 10 warmest.

The study, by Anthony Arguez (NOAA/NCEI) et al. also finds an 82% chance that all years in the next decade will rank in the top 15 warmest years as global warming continues. Its authors suggest that record warm years are already “baked into the cake” of Earth’s global climate and that it would take “an abrupt climate shift for even a few years within the next decade to register outside the top 10 warmest years.”

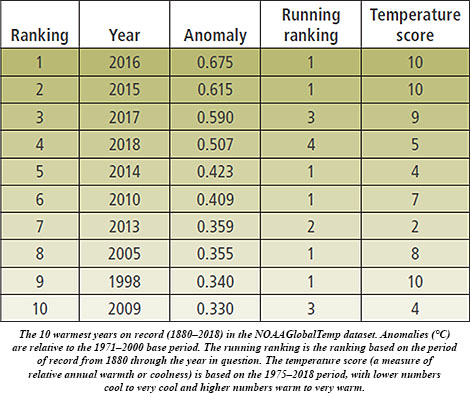
To determine these odds, the researchers analyzed the monthly version of NOAA’s Merged Land Ocean Global Surface Temperature Analysis Dataset (NOAAGlobalTemp) to project annual global temperature rankings in the future. The ever-shifting expectations for global temperatures render the usual way of keeping tabs on the data—by comparing to 30-year normals—inadequate. So Arguez et al. formulated a new way to compare each year to surrounding years:

We introduce a “temperature score”  to help NOAA communicate the coolness or warmth of a given year relative to the long-term trend. We believe this is the first such projected ranking and temperature score currently produced operationally. Our objective is to use this tool to improve the communication of climate change impacts to the general public.

Top 10The temperature score from 1 (a very cold year) to 10 (very warm) is useful to distinguish between warmer and colder years relative to the long-term trend. As examples, the authors note that 2008 and 2011 were considerably cooler than surrounding years and below the overall trend, whereas 1998 and 2016 were not only the warmest years on record but were also notably warmer than surrounding years.

The study only includes average annual global temperatures through 2018. But as reported in the annual State of the Climate, 2019 ranks as the second or third warmest year on record (depending on your favored dataset), adding another year to the recent string of those warmer than any years back to the mid 1800s. The report notes that each successive decade since 1980 has been warmer than the previous. Arguez’ research suggests that not only will this continue but it will worsen dramatically.

This is a testament to the exceptional warmth experienced over the last few decades, punctuated by the last [5] years [2015–19], which have separated themselves from “the pack.”

We asked Arguez a few questions (more found in the latest print/digital issue of BAMS) about this work as well as about his background and what sparked his interest in meteorology.

Anthony_ArguezBAMS: What would you like readers to learn from your study of record global temperatures?
Anthony Arguez: I would like the general public to know that there is not a great deal of suspense that most years—if not all—over the next decade will likely register as top 10 years. In fact, the data suggest we should expect this, as it would likely take a pretty abrupt change to get us off this trajectory.

BAMS: How did you become interested in finding new ways to analyze the global temperatures and their trend?

AA: I feel like I’ve been staring at the annual global temperature time series continually over the past 15 years or so because it is just so interesting in many ways. I find it challenging and rewarding to develop methods to translate volumes of data into answers to specific questions posed by the general public. I’ve drawn inspiration from Nate Silver, whose penchant for expounding on and communicating the “signal” hidden in the “noise” informs the way I would like to see myself and fellow climate scientists communicate to the general public more effectively.

BAMS: What surprised you most in doing this work?

AA: I was very surprised that the ranking errors we found were so small! Before calculating the results, I had a gut feeling that these errors would be modest, but the mean absolute ranking error of ~2 spots a full 10 years out was well below anything I could have imagined. I clearly under-appreciated the predictability inherent in the observed upward trend when it comes to annual global temperature rankings.

BAMS: What was the biggest challenge?

AA: I think the biggest challenge we faced was that we were not aware of any similar operational products in existence (neither for projected rankings or global annual temperature scores), or of any papers that had characterized ranking errors in a similar fashion, so we were in uncharted territory to some extent.

BAMS: This isn’t the biggest climate challenge, or surprise, you’ve ever faced…

AA: I became interested in meteorology as a teenager in 1992 when Hurricane Andrew totaled my parents’ home in Miami, Florida.


New Assessment Is Confident Global Warming Brings Stronger, Wetter Tropical Cyclones

Even with a modest amount of global warming, future hurricanes will become nastier. They’ll push ashore higher storm surges, grow into superstorms like Hurricanes Dorian and Irma more often, and unleash inundating rains similar to Hurricanes Harvey and Florence more frequently.

That’s the assessment of published, peer-reviewed research in the past decade, according to an assessment by Thomas Knutson (NOAA) and colleagues, recently published in the Bulletin of the American Meteorological Society. It’s the second in a two part study conducted by the author team, 11 experts in climate and tropical cyclones (TCs). Part 1 found there are indeed already detectable changes in tropical cyclone activity attributable to human-caused climate change. Part 2, in the March 2020 BAMS online, project changes in the climatology of these storms worldwide due to human-induced global warming of just 2°C.

Highest confidence among the experts was in storm surge flooding. Rising sea levels due to warming and expanding oceans, responding to atmospheric warming and glacial ice melt, are already making it easier for hurricanes and even tropical storms to drive greater amounts of seawater ashore at landfall. And this will only worsen.

With CO2 levels climbing to about 414 ppm in March, as measured atop Mauna Loa in Hawaii, Earth is on track to reach a 2°C average global temperature increase by mid century. Already global average surface temperature has risen 1.2°C since the Industrial Revolution began.

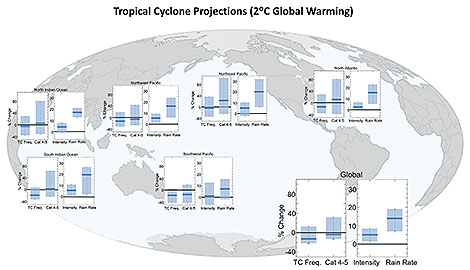
In the assessment the authors have medium-to-high-confidence that rainfall rates in tropical cyclones will increase globally by 14% due to the increasing amount of water vapor available in a warmer atmosphere. They project a 5% global increase in tropical cyclone intensity along with an increase in the number of Category 4 and 5s ̶ although the range of opinions among the experts involved is 1-10%. In the Atlantic Basin, which includes the Caribbean Sea and Gulf of Mexico, the number of storms is projected to decrease while intensity as well as the number of intense hurricanes increases.

Other studies found that hurricanes will slow down, making them even more prolific rainmakers, among other changes. Authors of the new assessment discussed these additional changes, but cited less confidence in general and that different tropical basins around the world had different projections:

Author opinion was more mixed and confidence levels generally lower for some other TC projections, including a further poleward expansion of the latitude of maximum intensity of TCs in the western North Pacific basin, a decrease of global TC frequency, and an increase in the global frequency (as opposed to proportion) of very intense (category 4–5) TCs. The vast majority of modeling studies project decreasing global TC frequency (median of about −13% for 2°C of global warming), while a few studies project an increase. It is difficult to identify/quantify a robust consensus in projected changes in TC tracks across studies, although several project either poleward or eastward expansion of TC occurrence over the North Pacific. Projected TC size metric changes are on the order of 10% or less, and highly variable between basins and studies. Confidence in projections of TC translation speed is low due to the potential for data artifacts in the observed slowdown and a lack of model consensus. Confidence in various TC projections in general was lower at the individual basin scale than for the global average.

 Summary of TC projections for a 2°C global anthropogenic warming. Shown for each basin and the globe are median and percentile ranges for projected percentage changes in TC frequency, category 4–5 TC frequency, TC intensity, and TC near-storm rain rate. For TC frequency, the 5th–95th-percentile range across published estimates is shown. For category 4–5, TC frequency, TC intensity, and TC near-storm rain rates the 10th–90th-percentile range is shown. Note the different vertical-axis scales for the combined TC frequency and category 4–5 frequency plot vs the combined TC intensity and TC rain rate plot. See the supplemental material for further details on underlying studies used.
Summary of TC projections for a 2°C global anthropogenic warming. Shown for each basin and the globe are median and percentile ranges for projected percentage changes in TC frequency, category 4–5 TC frequency, TC intensity, and TC near-storm rain rate. For TC frequency, the 5th–95th-percentile range across published estimates is shown. For category 4–5, TC frequency, TC intensity, and TC near-storm rain rates the 10th–90th-percentile range is shown.