Ozone Transport to the San Joaquin Valley

Uncontrollable sources of ozone from stratospheric intrusions, wildfires, and intercontinental transport are complicating efforts in California to further reduce this pollutant, which is particularly harmful to our health.

Scientists measured daily fluctuations in ozone in the air across Northern and Central California in 2016 during a coordinated field campaign known as the California Baseline Ozone Transport Study. They particularly focused on ozone crossing the shoreline and accumulating in low level air over the San Joaquin Valley.

Ian Faloona (University of California, Davis) and colleagues summarize the measurements and unique meteorological context for this novel dataset in a recent article published in the Bulletin of the American Meteorological Society. Faloona et al. draw attention to the dataset’s potential for future modeling studies of the impacts of long-range transport on regional air quality.
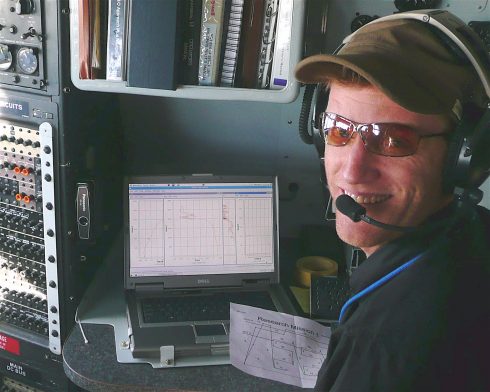
FaloonaIaninCockpit

Falloona, in his cockpit perch during aerial measurements for CABOTS.

We asked lead author Faloona to help us understand CABOTS and his motivations for this work.

BAMS: What would you like readers to learn from this article?

Faloona: I think this article presents a nice overview of the mesoscale flow over the complex terrain of Central and Northern California, and I would like readers to become more appreciative of the global nature of air pollution. The field of air quality was once considered in terms of emissions and receptors within “air basins” but as our knowledge of the global nature of greenhouse gases in terms of climate change has developed, I believe that we have similarly become more and more aware of the global aspects of many air pollutants in general.
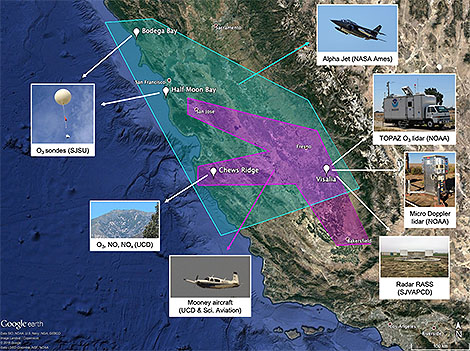
The CABOTS study domain and measurement platforms ranged from daily ozonesondes launched at the two coastal sites (Bodega Bay and Half Moon Bay) to the NOAA TOPAZ lidar in Visalia. The green and purple polygons represent the approximate domains surveyed by the NASA Alpha jet and Scientific Aviation, Inc., Mooney air-craft, respectively.


How did you become interested in the topic of this article?

Some colleagues from the UC Davis Air Quality Research Center and I became interested in long-range transport of air pollution to California and how it might be best sampled along the coastal mountains where local emissions might be minimal and the surface was well above the strong temperature inversion of the marine boundary layer. We eventually found the site on Chews Ridge where a group of renegade astronomers had been operating an off-the-grid observatory with the Monterey Institute for Research in Astronomy. They allowed us to build a climate monitoring site collocated with their observatory (the Oliver Observing Station) and then some airborne work for the San Joaquin Valley Air Pollution Control District allowed us to link the inflow at the coast to air quality issues within the leeward valley.

What got you initially interested in meteorology or in the related field you are in?

While an undergraduate studying physical chemistry I wrote a term paper on acid rain for a chemical oceanography class. I was floored by how few details were thoroughly understood about the chemical mechanisms of an environmental problem that at the time was considered quite serious. I figured I should throw whatever brainpower heft I could into this type of atmospheric oxidation chemistry.  But then, while working for a private consulting company in Colorado after college, many of my colleagues there were trained in meteorology and I knew there would be little progress without a fundamental understanding that field.  So I went to Penn State to do chemistry research but get trained in all aspects of meteorology.

What surprises/surprised you the most about the work you document in this article?

The first thing that surprised me about the data we collected for CABOTS was how deep the daytime up-valley flow was (~1.5 km), but how shallow the convective boundary layers tended to be (~0.5 km).  The scale interactions that need to be taken into account when analyzing boundary layers among the complex terrain of California make it a great place to study in meteorology. But the other major discovery that came out of this work was the evidence we found of significant NOx emissions from certain agricultural regions in the San Joaquin Valley. For instance, we found that the agricultural region between Fresno and Visalia was responsible for as much NOx emitted to the valley atmosphere as from all the mobile sources in the CARB inventory across the three county region.

What was the biggest challenge you encountered while doing this work?

The sensible heat at the Fresno airport.  Our airborne deployments attempted to target high ozone episodes, which are best forecast by their correlation with ambient temperatures. I like to tell my students that I am a chaser of extreme weather. It just so happens that the weather features most important to air quality are heat waves. Heat waves are extremely easy to catch, and can be brutal in their persistence.  Some days we observed temperatures in the plane on the tarmac of >115 ºF, which made it challenging to keep the equipment up and running. I remember dragging bags of ice in and out of the plane covered in sweat, and still having the instruments give up in heat exhaustion before one of our midday flights.

What’s next? How will you follow up?

I would like to continue studying the various scales at play in the transport of intercontinental pollution to North America, and my preferred tools are aircraft laboratories. I would like to follow up with a study of wintertime stagnation events that lead to particulate matter air quality problems – an entirely different meteorological beast.  But I would also like to follow up with a study of agricultural NOx emissions in the Imperial Valley of Southern California. This region is expected to have the largest soil emissions and the lowest urban sources to confound the measurements. It is also a region of important environmental justice issues being made up largely of migrant agricultural workers who have to bear the burden of the air quality problems engendered by agriculture.



What a Launch!…and More GEMS to Follow

Nothing quite like watching lift-off…here’s the video sequence from Arianespace showing the flight of the rocket carrying South Korea’s GEMS satellite instrument into space earlier this week.

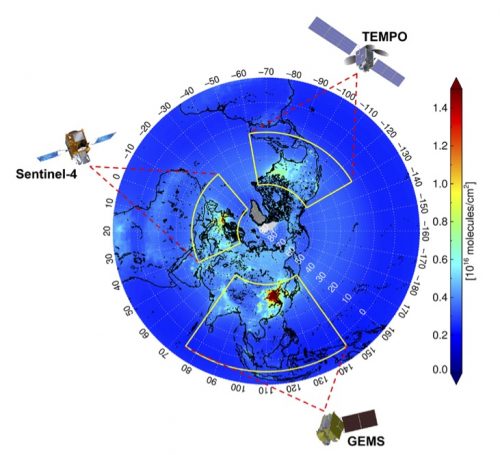
GEMS–the Geostationary Environment Monitoring Spectrometer–is a centerpiece of the Asian contribution to a triad of geostationary satellite missions watching air quality in some of the most pollution-prone urban centers of the world. The other similar missions to be launched are Sentinel-4 over Europe and TEMPO over North America.

GEMScoverage

The image above superimposes the field of view for each of the satellites over an image of nitrogen dioxide concentrations averaged over the 10 years 2005-2014 from the Ozone Mapping Instrument aboard NASA’s Aura satellite. Aura is part of the “afternoon-train” or A-train of international satellites focused on anthropogenic aerosols. But these satellites pass over any given spot on Earth the same time each day.

With GEMS, such information is now going to be 24/7 for Asia. As a geostationary eye on air quality, the new South Korean satellite watches meteorology and atmospheric chemistry continuously. In addition to GEMS, which uses spectrometers to track ozone, nitrogen dioxide, sulfur dioxide, aerosols, ultraviolet index, and other health-related factors in the atmosphere, the satellite includes meteorological and ocean color sensors. This gives a synergy to Earth observing at faster sampling rates and higher resolution over the region, advancing investigations of air pollution for a large portion of the world’s population.

The push for geostationary satellite monitoring of air quality that led to the launch of GEMS has been long in the making. In an article 8 years ago in BAMS, W.A. Lahoz explained that geostationary satellites give

an improved likelihood of cloud-free observations …with continuous observations of a particular location during at least part of the day. This “stare” capability …makes it very effective for the retrieval of the lowermost troposphere information for capturing the diurnal cycle in pollutants and emissions, and the import/export of pollutants or proxies for pollutants.

You can read more about the new capabilities in the BAMS article on GEMS by Jhoon Kim (Yonsei Univ.) and colleagues. The article, appropriately, posted online within an hour of the launch of the satellite.

BAMS cover outline 2This is actually a twin launch: The GEMS article is among the first of the new-look BAMS in AMS Journals Online. You’ll find highly readable typefaces with a simple layout easier for scrolling on screen. You’ll also note that we’re starting to publish articles as soon as they’re ready for launch, rather than waiting for them to collect into issues in print.

Also about to launch into the mail is a whole new approach BAMS is taking to print as well. The magazine is much more dense with important and exciting new information. The printed features (mirrored as well in the digital edition for AMS members) are short, highly accessible versions of the peer-reviewed research articles. We’re expanding our focus on new and important articles to relay the authors’ thoughts—in their own words—about their work and the challenges they’re solving in their next articles as well. This blog and AMS social media will reflect such thought-provoking new BAMS content in all sorts of ways—for reading, listening, and watching.

So GEMS is our partner in launch: a new era of air quality monitoring for Asia is paired with a new era of communications for AMS. As they say in the media..stay tuned, more to follow!

Oh Say Can You Breathe? The Impact of Fireworks on Air Quality in the United States

[Photo by Mike Enerio on Unsplash]
[Photo by Mike Enerio on Unsplash]

by Perry Samson, Climate and Space Science and Engineering, University of Michigan
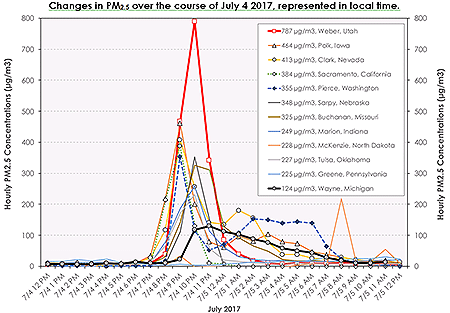
On July 4th last year, in an attempt to entertain my two grandchildren, I set off what I felt was a modest display of fireworks in our front yard. A monitor that measures the concentration of particles (PM2.5) in the air was mounted there and my colleague, Jeff Masters of Weather Underground, noticed that the concentrations being recorded were remarkably high that evening. This led us to review hourly concentrations of PM2.5 that night across the United States, collected both by state agencies and an independent network available from PurpleAir.org.  Results showed widespread increases in particulate concentrations that evening, with increases varying across the country.
Nationally, about 80% of all sites saw a doubling of particulate matter during the evening of July 4, 2017 with several sites producing exceedances of the National Ambient Air Quality Standard of 150 µg/m3 3-hour standard. These results were presented at the AMS Annual Meeting in January in a talk entitled “Oh Say Can You Breathe.”
Average hourly particle concentration increases from background levels seen in 2017 for multiple sites across the United States.

Average hourly particle concentration increases from background levels seen in 2017 for multiple sites across the United States.


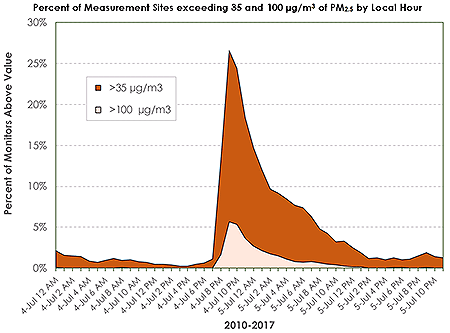
Moreover, the increase in PM2.5 seen in 2017 is consistent with other years. The increase in PM2.5 from background levels was compiled for the eight-year period 2010-2017. Over that time over 25% of measurement sites in the United States reported a rise of at least 35 µg/m3 with about 5% reporting a rise of greater than 100 µg/m3.
Percent of all measurement sites reporting an hourly increase in PM2.5 from background conditions exceeding both 35 µg/m3 and 100 µg/m3.

Percent of all measurement sites reporting an hourly increase in PM2.5 from background conditions exceeding both 35 µg/m3 and 100 µg/m3.


These results are compelling as they point out how, for at least one evening a year, we are willing to subject ourselves (and even our grandchildren) to high concentrations of particulate matter. According to the EPA, concentrations above 150 µg/m3 are considered “Unhealthy” and can cause widespread coughing and other increased respiratory effects.
While it is unlikely that there will be much political will to legislate against fireworks displays in the United States, these results should be of interest to people suffering from asthma who may want to protect themselves from outdoor air during this year’s July 4th celebrations.
As for me, and despite evidence of risk, I’m doubling down on the fireworks this year to REALLY impress the kids.
I just moved the PM2.5 monitor away from my home.
[Photo by Sang Huynh on Unsplash]
[Photo by Sang Huynh on Unsplash]

Walking through Problems of Urban Air Quality

Doctors tell us to get more exercise—walking is as good for the body as for the environment. But is it healthy to take a walk in neighborhoods where walking is actually practical? If Vancouver, British Columbia, is representative of most urban areas, then the answer is “no.”
A recent study in Environmental Health Perspectives found that areas that rate highly for both walkability and air quality house only about 2% of the city’s population (they tend to be high-income regions a few miles from downtown).
The nitric oxide and the resulting ozone from auto emissions tend to concentrate in different parts of the city: nitric acid is more pervasive downtown, because ozone takes longer to form and has often drifted from its city sources before reaching its greatest concentrations in the suburbs.
The authors suggest that living in high-rises have an unintended health benefit: they are usually in a walkable environment and also allow most residents to spend much of their time farther away from street-level emissions.
These roadway air quality problems can be quite serious. A new study of the Los Angeles area connects asthma in children with proximity to heavy-traffic areas, with 9% of all childhood asthma cases in Long Beach and 6% in Riverside attributable to living within 75 meters of a major road.
“The impact of roadway proximity on the overall burden of asthma-related illness is remarkable,” said principal investigator Rob McConnell of the University of Southern California. “Air pollution is a more important contributor to the burden of childhood asthma than is generally recognized, especially to more severe episodes requiring visits to a clinic or emergency room.”
The study in the American Journal of Public Health also highlighted the impact of shipping in the region—the Los Angeles-Long Beach port is the largest in the United States—by estimating that 21% of asthma-related bronchitis episodes in Long Beach (about 1,400 cases total) and 8% in Riverside (3,400 cases) were caused by nitrogen dioxide emitted by ships.
If the air is the problem, then meteorology may offer some of the solutions. In a poster to be presented Monday (2:30 pm; Environment and Health Symposium) at the AMS Annual Meeting, David Quesada will report on correlations between weather—including humidity, rain, and winds—and asthma in Miami, Florida, where residents suffer above-average asthma incidence.
With pollen and particulate data in hand, the project may identify ways to help residents live well in an urban environment—without necessarily building more high-rises.