After a veritable flurry of storms in the Atlantic since August, the basin has gone quiet following the landfalls of Tropical Storm Beta in Texas, and Post-Tropical Storm Teddy in Nova Scotia. But late-season storms are quite common in the Atlantic, and as this hyperactive hurricane season combines with confirmed La Niña conditions, this year it seems almost like an expectation. And that means people on the coast need to stay alert to what’s going on in the atmosphere, but it also means there’s still promise for additional hurricane research this year.
Recent Octobers have seen a couple of very intense and even catastrophic hurricanes develop and make landfall. The last big one was Hurricane Michael, which slammed the Florida Panhandle in 2018. In 2016, Hurricane Matthew roared to life in the Caribbean, reaching Category 5 intensity on the Saffir-Simpson scale before crashing into Hispaniola as a Cat. 4, and then menacing the Florida coast for days and eventually swirling into the Carolinas.
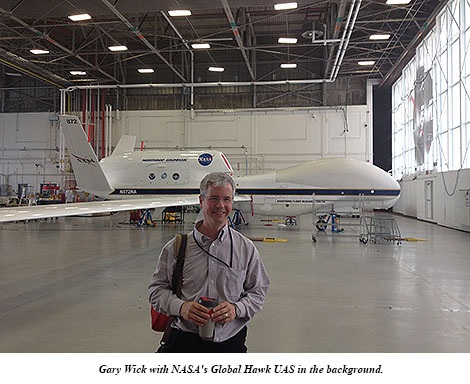
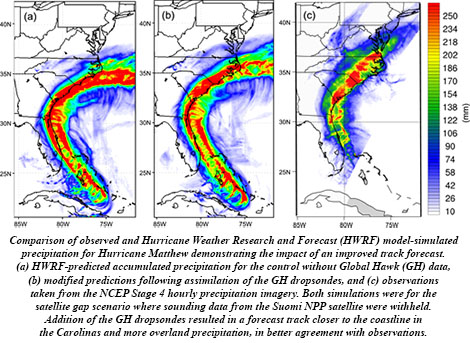
Matthew turned out to be a late-season success for NOAA’s Sensing Hazards with Operational Unmanned Technology (SHOUT) project. SHOUT evaluated the ability of observations taken by the high-altitude, unmanned Global Hawk aircraft to improve forecasts of high-impact weather events, which are “one of the most critically needed capabilities of weather services around the world,” write lead author Gary Wick and his colleagues in their article on SHOUT in the Bulletin of the American Meteorological Society.
NASA’s Global Hawk flew 15 missions sampling Hurricane Matthew and 5 other tropical cyclones as well as 3 winter storms in 2015 and 2016. Instrumented with GPS dropwindsondes and remote sensors, Global Hawk’s data were examined in real time by forecasters, assimilated in operational weather prediction models, and applied to data impact studies, demonstrating positive results.
BAMS asked Wick a few questions about his work and SHOUT in particular (for the full answers, see the print or digital edition of the magazine):
BAMS: What would you like readers to learn from your article?
Gary Wick: The primary message we would like to convey is that Global Hawk can provide highly useful observations of high-impact weather events that would be very difficult to obtain with any other
existing aircraft or observing system. It was possible to consistently see the potential for forecast benefit across a wide range of models.
 BAMS: How did you get into this focus on improving operational hurricane forecasts with unmanned aircraft?
GW: I was fortunate to have participated in both the NASA-led Genesis and Rapid Intensification (GRIP) and Hurricane and Severe Storm Sentinel (HS3) campaigns and was able to observe the potential application of the Global Hawk to tropical cyclone research. The distinct goals of those campaigns, however, didn’t allow for a real focus on the operational hurricane forecasting problem. We in the NOAA UAS Program were extremely excited when support from the Disaster Relief Act of 2013 gave us the opportunity to conduct a dedicated campaign to examine the impact of observations from the Global Hawk on forecasts of high-impact weather.
BAMS: What got you initially interested in meteorology?
GW: My path to this project was really quite indirect. My interests growing up really centered around planes, due in part to living close to the old Denver airport. As a kid, I would frequently ride my bicycle out to the end of the runway and watch planes take off and land. These interests led me to study Aerospace Engineering as an undergraduate where I just happened to take a class one year in environmental aerodynamics taught by a scientist from a predecessor of my current NOAA laboratory. This class introduced me to remote sensing and I ended up pursuing graduate studies centered primarily around satellite-based remote sensing. The work with UAS in general and this project in particular allowed me to come full circle, in a sense, combining my many interests in aircraft, remote sensing, and weather.
BAMS: What surprised you the most in the SHOUT project?
GW: As someone whose personal work hadn’t centered around atmospheric models, assimilation, and weather forecasting, it was surprising to me early on how providing weather models with more, high quality, direct observations wouldn’t necessarily improve the resulting forecasts and, in some cases, could actually degrade them. One might naively think that better data could only lead to a better final product. After gaining an appreciation of how challenging it is to achieve meaningful forecast improvements through addition of any data to our current observing and assimilation systems, I was
very pleasantly surprised that it does appear that the highly unique observations enabled by the Global Hawk still have the potential to help us improve our forecasts of high-impact weather events.
BAMS: What was the biggest challenge you encountered in the experiment?
GW: As with seemingly any field project, our biggest challenge was probably obtaining the weather events we were hoping to study during the necessarily limited duration of the campaign. Through the multiple years of the GRIP, HS3, and SHOUT campaigns, the Global Hawk developed almost a reputation as a “hurricane repellent” due to the limited number of storms during the experimental periods. Perhaps the most interesting storm sampled during the SHOUT campaign, Hurricane Matthew in 2016, actually occurred after the scheduled end of the experiment. Fortunately, we were able to extend the campaign and collect some very valuable additional observations.
 BAMS: What’s next? How will you follow up?
GW: Several additional studies are underway to better evaluate the impact of all the different observations collected in different and the most recent models. NOAA is still working to evaluate and increase the number of UAS observations (particularly from smaller platforms) to help conduct our mission.
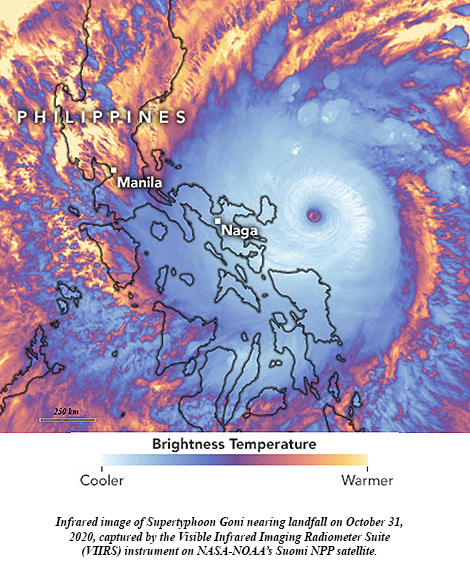 A little more than two weeks ago, Supertyphoon Goni blasted ashore in the Philippines with top sustained winds of 195 mph, becoming the strongest landfalling tropical cyclone on record. It topped STY Haiyan’s 190 mph land strike just seven years ago. With Hurricane Iota in the Caribbean explosively intensifying 100 mph in under 24 hours to reach Category 5 intensity Monday, it set a new record of five consecutive years of Cat 5 hurricanes in the North Atlantic tropical cyclone basin. Among the seven catastrophic hurricanes, starting with Matthew in 2016, were Dorian and Irma, packing 185 mph and 180 mph steady winds, respectively, with peak gusts well over 200 mph.
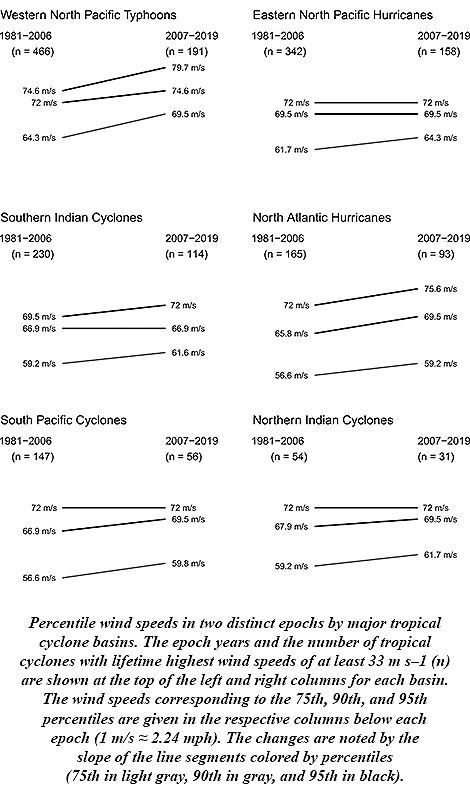 James Elsner of Florida State University says this is to be expected. His research stated in 2008 that there was an upward trend in the intensity of the most intense tropical cyclones. Rising ocean temperatures, as theory predicted, were driving the trend. And with oceans continuing to warm along with Earth’s climate since then, Elsner anticipated the continuing upward trend. New research published in the Bulletin of the American Meteorological Society confirms his prediction, finding that another 3.5 to 4.5 percent increase in intensity has occurred with the strongest tropical cyclones during the period 2007-19.
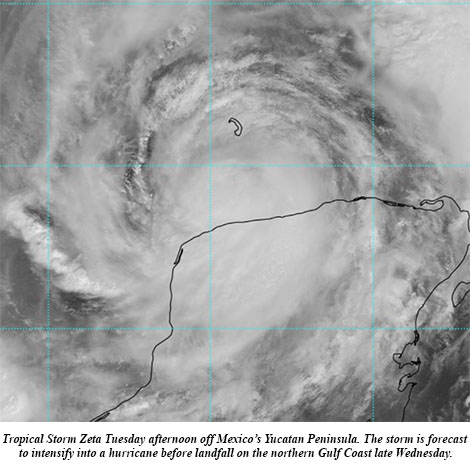 Zeta blossomed into the 11th hurricane of this hyperactive season Monday and its forecast track takes it ashore on the Gulf Coast by midweek. The National Hurricane Center (NHC) on Monday said computer models had become more tightly clustered with the forecast in the Gulf, “resulting in an increase in track-forecast confidence,” and Hurricane Zeta is expected to become the United States’ record 11th storm landfall in a single season.
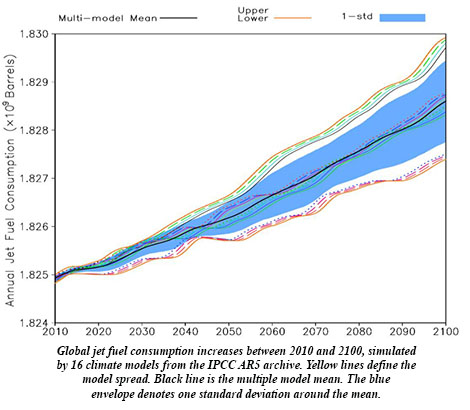 Ren et al. use an ensemble of 34 climate models to project that aviation fuel requirements by the end of the century could be an extra 160 million gallons per year due to viscosity, approaching an extra $1 billion per year in costs more than today in a scenario in which fossil fuel use is basically unabated.