Fair Weather Flier

Nice Q and A in the Battle Creek Enquirer with National Weather Service meteorologist Brad Temeyer, of Sioux Falls, Iowa, who was in Michigan last month as the weather officer for the Balloon Federation of America national championships.


Photo by Trace Christensen/Battle Creek Enquirer

How did you go from meteorology to ballooning? Or did ballooning come first?

Ballooning came first, actually. I started by going out and just watching the balloons as a spectator back when I was three years old.
I wondered why the balloons were able to steer as they go up in altitude. As they change their altitude, a lot of times winds are different and that made me really curious. I started to look into that and one thing led to another. I ended up with a career in meteorology.
Is it easy to find time in your life for both ballooning and your work in weather?
In some respects, I have an advantage because I know the weather ahead of time and I try to line up crew and get a flight lined up. The drawback to it is that Mother Nature never takes a break, so I’m working rotating shifts around the clock. Sometimes when it’s flyable, I’m stuck at work. That’s kind of unfortunate.

For the complete interview, see the Enquirer.

Inside Earl

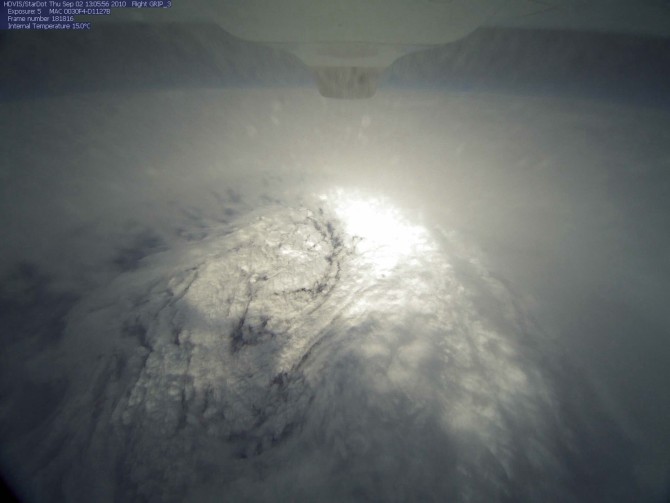
NASA’s GRIP mission (Genesis and Rapid Intensification Processes) is sending aircraft into Hurricane Earl, coming up with some wonderful imagery from almost 20,000 meters above the ocean surface. Here’s how the eye looked from the Global Hawk unmanned aircraft at 9:05 a.m. Eastern, Thursday:

For more on GRIP, Earl, the Global Hawk, and the importance of having drones that can fly up to 26 hours in a single mission, this video interview with Jeff Halverson gives some answers with nice imagery:

Do You Know Which Way the Wind Blows?

Anyone want to help these people with an answer?….Below is a post from Thursday on CASKA, the Chicago Area Sea Kayakers Association web site:

Meteorology Conundrum

Here are wind and waves for this Friday night:


So far so good: the wind is from the west and the waves are predictably building with increasing fetch from Illinois to Michigan side of the lake.
Now here are the predictions for Saturday noon or 15 hours later:


The winds have shifted to the north somewhat but are still predominantly west. The wind shift to the north was gradual. The waves are still gaining height from west to east.
But what happened to the wave direction?! Is it just me or does it seem odd that on the west side of the lake the waves have turned nearly perpendicular to the wind direction!

New Tools for Hunter-Gatherers of Weather Data

A Monthly Weather Review paper in press by Otto Hyvärinen and Elena Saltikoff notes that the widespread availability of weather photos on the internet presents an opportunity for meteorologists gathering storm data.

People of the generation born since 1982 have grown up using computer technology. Cell phones, text messaging and the Internet are all part of their culture. Now they are acquiring more and more devices with good quality cameras and Global Positioning System (GPS) abilities. They share photos and reports with friends and strangers alike. Typical messages can be divided into two categories: “this is what I saw” and “this is what happened to me”. At first glance, these data are unreliable, unorganized and uncontrolled. But the amount of data is huge and increasing and should not be ignored, and its reliability should be assessed.
Because shared photos on Flickr, for instance, are time-stamped and often with good location information, the authors were able to compare hailstorm identification using the online photos to gathering the same information the conventional way, with radar signatures.
As a result of this preliminary study, we think that further exploration of the use of Flickr photographs is warranted, and the consideration of other social media as data sources can be recommended.

Similar ideas were making the rounds at the AMS Annual Meeting in Atlanta earlier this year. The Centers for Disease Control has been using Google search data to pinpoint influenza outbreaks (a Nature paper on the topic is cited in the new MWR article). Who knows? In the coming age of Web 3.0 the plodding old methods of gathering storm and climate data may go the way of hunter-gatherer societies. The information revolution may create myriad, as-yet-unimagined tools for the community–and not just as a means to deliver products.
Which brings us to the irony of using the habits of the populace to reinforce expertise, and a cautionary tale from Australian columnist Bryan Patterson that’s been making the rounds of the internet again these days:

An Aboriginal mate told me this story which maybe explains how the weather system really works.
It was April and the Aboriginals on a remote reserve asked their new elder if the coming winter was going to be cold or mild. Since he was an elder in a modern society he had never been taught the old secrets. When he looked at the sky he couldn’t’t tell what the winter was going to be like.
Nevertheless, to be on the safe side he told his tribe that the winter was indeed going to be cold and that the members of the tribe should collect firewood to be prepared. But being a practical leader, after several days he had an idea. He went to the telephone booth, called the Bureau of Meteorology and asked,
“Is the coming winter going to be cold?” The meteorologist responded, “It looks like this winter is going to be quite cold.”
So the elder went back to his people and told them to collect even more wood in order to be prepared. A week later he called the Bureau of Meteorology again.
“Does it still look like it is going to be a very cold winter?” The meteorologist again replied, “Yes, it’s going to be a very cold winter.”
The elder again went back to his people and ordered them to collect every scrap of firewood they could find. Two weeks later the elder called the Bureau again.
“Are you absolutely sure that the winter is going to be very cold?” he asked. “Absolutely,” the man replied. “It’s looking more and more like it is going to be one of the coldest winters ever.”
“How can you be so sure?” the elder asked.
The weatherman replied,
“The Aboriginals are collecting firewood like crazy.”

Time Out for Some…Froth

A break from serious thinking for a moment….

They got too close. Way too close. But thanks to Mike Smith for pointing out this close encounter with a waterspout, which was fun until it was no longer so fun…Which led us to find this even more slick, calculated approach:

So is waterspout hunting the latest crazy extreme sport? Let’s hope not, though sometimes you’re in the right place at the right time:

That’s far cry from what this waterspout does to a ship off Singapore :

Camerman to child: “You want to go up in an airplane? I don’t think it’s a good idea!”
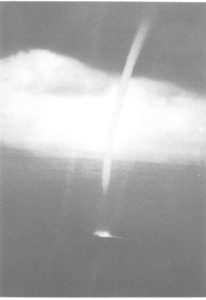
Hmmm, maybe airplanes are how all this got started in the first place:

Meteorologists' observation of a waterspout, Matecumbe Key, Florida, from the November 1967 Monthly Weather Review. Photo by Joe Golden.

Stephen Schneider: Scientist, Communicator

by Peggy Lemone, AMS president (with thanks to Bob Chervin)
On 19 July, our community lost both a great scientist and a great communicator, Stephen H. Schneider.  Dedicating his life to quantitative analysis of the physics of climate and climate change while still a graduate student, he soon became a leader in and major spokesman for the field.  He spent most of his professional life at NCAR and then at Stanford.

My first real encounter with Steve Schneider was at an NCAR retreat in the 1970s.  He was presenting a “back-of-the –envelope” calculation (on a hand-drawn envelope on the transparency) on climate change at a retreat in the Colorado mountains.  He was energetic and enthusiastic, and able to distil his arguments into simple, easy-to-understand language.  In the coming years, we all began to recognize that here was not only a gifted scientist, but a gifted communicator.  It was not long before people in the media recognized that Steve had the ability to distil a complex problem into a short sound bite that was a lot more than “ear candy.”

Steve at the time was focusing on the cooling effects of aerosols, while his colleague Will Kellogg was investigating the warming effects of carbon dioxide. This inspired a display on our group bulletin board, with two newspaper articles, one about Steve and cooling, and one about Will and warming, beneath a copy of Robert Frost’s poem “Fire and Ice.”   In his aerosol research, Steve rapidly moved on from “nuclear winter” to “nuclear autumn” and the impact of carbon dioxide.   Like a good detective, he refined his opinions as the evidence came in, and he drew in colleagues from multiple disciplines to track the causes and impacts of climate change.  He quickly became NCAR’s ambassador for climate change, writing several books, and continuing to explain the rapidly-evolving science to the public through the news media.
Sadly, he ended up having to do far more than simply explain the science to the public and policy-makers:  increasing resistance to the findings of climate-change science put him and other climate scientists on the defensive – not so much against other atmospheric scientists as to private citizens.  Indeed, in recent years, he, like other climate scientists, have received multiple threatening emails.  As in the title of his last book, climate science has in some sense become a “contact sport,”with confrontation rather than reasoned discussion.   In Steve’s words (from an interview in Stanford’s alumni magazine)

…in the old days when we had a Fourth Estate that did get the other side [of debates]—yes, they framed it in whether it was more or less likely to be true, the better ones did—at least everybody was hearing more than just their own opinion. What scares me about the blogosphere is if you only read your own folks, you have no way to understand where those bad guys are coming from. How are you going to negotiate with them when you’re in the same society? They’re not 100 percent wrong, you know? There’s something you have to learn from them and they have to learn from you. If you never read each other and you never have a civil discourse, then I get scared.

Only time will quiet the vigorous and sometimes unpleasant debate.  But, in the meantime, I hope that we in the community can also find times and opportunities to share this important science with the public in non-confrontational and user-friendly ways.  We owe that to Steve, the public, and ourselves.
For more details on Steve’s rich and productive life, see the Stanford University web site, and also the 13 August 2010 issue of Science, and the 19 August 2010 issue of Nature

The Road to Safer Driving Is Paved with Meteorology

Storm chasing is sometimes as much a gripping challenge of driving through nasty weather as it is a calculated pursuit of meteorological bounties.
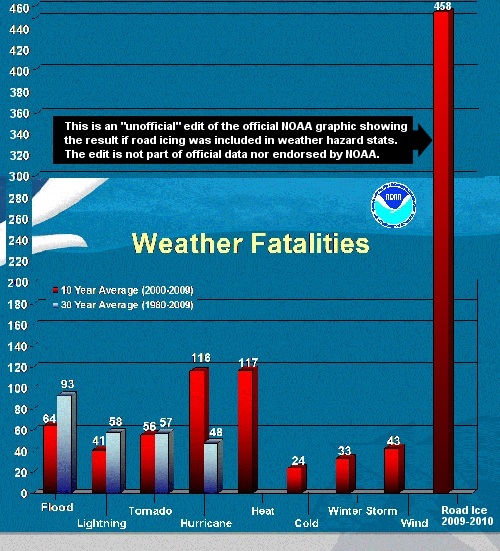
So perhaps it’s not so surprising that it took a storm chaser…Dan Robinson’s his name…to start a web site about the fatal hazard of ice and snow on our roads. Over half of the weather-related deaths on American roads each year are in wintry conditions.
Robinson took the liberty of tacking road statistics into the preliminary NOAA numbers for weather hazards (recently released for 2009 here).

The effect is striking, indeed, and a good lead in to Bill Hooke’s report from a Federal Highway Administration workshop today on road weather and the future of intelligent transportation systems.
Clearly we’ve got a lot of work to do and a lot of lives to save…Hooke, the AMS Policy Program Director, makes the case and points out some of the bumps in the road to better weather safety in your car.

Vortex Delight


This Monday at the AMS Conference on Mountain Meteorology, Rieke Heinze of the Institut für Meteorologie und Klimatologie at the Leibniz Universität Hannover presented this very cool looking simulation of von Kármán vortex streets, which sometimes show up in satellite images of clouds in the lee of isolated mountain islands. The nifty thing about Heinze’s simulation project is that it shows the vortices retaining a warm core from bottom to top in the flow (cross section not shown here).
On her project web site (where you can download the video), Heinze writes:

Atmospheric vortex streets consist of two rows of counterrotating mesoscale eddies with vertical axis in the wake of large islands. They resemble classical Kármán vortex streets which occur in laboratory experiments behind a cylinder. Usually, atmospheric vortex streets can be found in the stratocumulus capped mixed layer over the ocean when there is a strong elevated inversion well below the island top.

In the animations the island consists of a single Gaussian shaped mountain with a height of about 1.3 km and a base diameter of about 12km. Particles are released in one layer and act as passive tracers. Their vertical motion is disabled. The colour of the particles reflects the difference between the temperature at the respective particle position and the mean temperature, horizontally averaged over the total domain. Blue/red colours represent a relatively low/high temperature. The animation shows that the cores of the eddies are warmer than the environment. The length of the animation corresponds to about 14h real time.

A Dose of Reality: The Social Side of Disasters

by William Hooke, AMS Policy Program Director,
from the AMS Project, Living on the Real World
Reality: Disasters – that is, disruptions of entire communities, persisting after an extreme has come and gone, and exceeding a community’s ability to recover on its own – are largely a social construct. Consider this simple example. Meteorologists call a tropical storm a hurricane when its winds exceed some 75 miles per hour. The strongest hurricanes ever observed show wind speeds about twice this level, 150 mph, say. Physics tells us that the forces on buildings and structures should vary as the square of the wind speed (getting a little technical …). The strongest hurricanes therefore pack a wallop about four times that of the weakest; the area suffering hurricane-force winds also tends to be a bit bigger. But the damages from these largest storms may be 200 times as great. One contributor to this big difference? Building codes. These are county-based, and so vary somewhat across the 3000-some counties in the United States, but in hurricane-prone areas usually require that brick-and-mortar residential construction withstand wind speeds of about 120 mph – right in the middle of the hurricane-force wind range. [Manufactured housing, by contrast, is governed by a less-rigorous federal standard, which requires that such structures only maintain their integrity at wind speeds up to some 70-90 mph.] Change building codes, and you change this loss profile.
Alert! These are our choices, but they’re not necessarily bad choices. When it comes to building codes, we’re simply forced to set a realistic standard. Whenever we wish, we can elect to build homes that will withstand hurricane-force winds, or even the strongest tornadic winds, which might approach 300 mph. But these homes would be considerably more expensive. They might be built largely underground, looking more like World War II “pillboxes” than homes, with narrow slits for windows, etc. Remember, they have to bear up not just to the winds but also to the windborne debris: lumber, roofing, automobiles, etc. Most of us wouldn’t be able to afford them, and wouldn’t want to live in them even if we could. We prefer our views, the connection with the outdoors. So we build a safe room, or a storm cellar, and accept the remaining risk.
Building codes are but one example; here’s another – land use. Simply by choosing to build in the flood plain alongside rivers and on the coasts, we ensure that our future will be punctuated by repetitive loss. Build on an earthquake fault-line? Expect the same outcome. There’s much more to this topic. We’ll return to it down the road.
But, for now, let’s set it aside in order to introduce a more complicated notion. When we choose to urbanize – and over half the world’s population lives in cities now – we expose ourselves to other risks, and different kinds of risk at that. To live in cities requires critical infrastructure, ranging from the elevators that service high-rise buildings to networks of roads, sewage systems, water works, electrical grids, communications, financial services, health care, and so on. As a result, we’re now subject to outages of these systems, from whatever cause. An example from the Midwest flooding of 1993. The city of Des Moines, Iowa remained largely dry; only a small sliver of land

Read more

Remembering Katrina and New Orleans

by William Hooke, AMS Policy Program Director, from the AMS project, Living on the Real World

“…we can not dedicate, we can not consecrate – we can not hallow – this ground. The brave men, living and dead, who struggled here, have consecrated it far above our poor power to add or detract.”– Abraham Lincoln, Gettysburg address

The last few posts, as we’ve started to think about disasters, we’ve asked, what’s it worth to see a disaster coming? Katrina shows vividly that it’s worth relatively little if we can’t or won’t act. People had been vocal about the growth of vulnerability in New Orleans for decades, even as the vulnerability and risks ratcheted up. The warnings didn’t seem to be enough.
Some salient features of this landscape? Well, for one, the 2002 series of articles by Mark Schleifstein and John McQuaid in the New Orleans Times-Picayune, “Washing Away: how south Louisiana is growing more vulnerable to a catastrophic hurricane.” For another, the 2004 article by Shirley Laska in The Natural Hazards Observer, “What if Hurricane Ivan had not missed New Orleans,” and her June 2005 talk as part of an AMS environmental science seminar on Capitol Hill, in the Senate Hart Office Building, on the topic of “New Orleans, hurricanes, and climate change: a question of resiliency.” That afternoon, one hundred policymakers were in the room, including U.S. Senator Mary Landrieu (D-LA, who to her credit had always been concerned about this threat and working hard, first to avert it, and since to recover from it).
Dr. Laska, a sociologist at the University of New Orleans and then director of the Center for Hazard Assessment, Research, and Technology (CHART), laid out the whole scenario. She touched on the growth in Louisiana population, the development of the Port of New Orleans and the offshore oil extraction and the associated refineries. She recounted a century of bad engineering along the Mississippi, the degradation of Louisiana’s coastal wetlands and the subsequent loss of their natural protection. She discussed the risks in depending upon evacuation as a strategy: the vulnerabilities of the lone evacuation route over Lake Pontchartrain and the fact that at any given time, 100,000 people would be too poor to find a ride, and 2000 people to sick to move. She estimated it would take 90 days to dry out the “bowl” (that portion of New Orleans under sea level and most vulnerable to flooding), and twenty years to recover. So far, as we say in our trade, that forecast seems to be verifying.

Read more