Building Community to Solve the Big Challenges in Weather, Water, and Climate

Some thoughts following the AMS Summer Community Meeting

By Isabella Herrera, AMS Policy Program

How can the weather, water, and climate enterprise better collect and use socioeconomic data to keep vulnerable populations safe from environmental hazards? What are the challenges of establishing a national network to monitor the planetary boundary layer? How are we dealing with radio frequency interference that hampers weather monitoring and forecasting? These questions can be answered only through collaborative efforts across the weather, water, and climate enterprise. One of the most important roles of the American Meteorological Society is to convene meetings where WWC professionals can delve into these vital topics.

The AMS Summer Community Meeting is a perfect example of that convening ability in action. Professionals from the private, public, and academic sectors come together, both in person and virtually, to share their visions for the future of the weather, water, and climate enterprise(s). 

Having now worked for the American Meteorological Society for just over a year, I was very excited to have the opportunity to attend the AMS Summer Community Meeting for the first time in Minneapolis this August. At this two-day conference, attendees immersed themselves in discussions about current challenges, opportunities, and efforts throughout the AMS community and related fields.

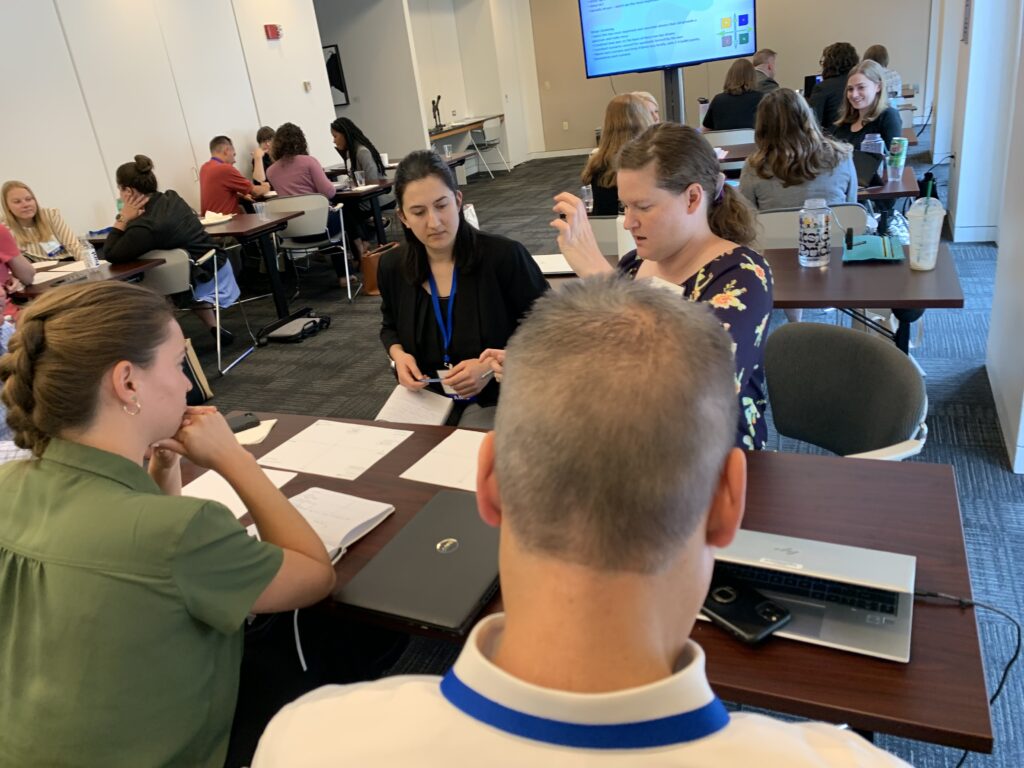
A conduit for collaboration

As an in-person attendee this year, one thing that struck me was how the Summer Community Meeting served as a conduit for conversation. Information and ideas flowed easily between the various presenters, panelists, and the audience. For example, sessions focused on commercial radar services and NOAA research allowed the public and private sectors to share their perspectives. They presented pressing issues, opportunities for potential collaborations, and the work currently being done across the enterprise.

Summer Community Meeting attendees listen to a discussion of NOAA’s Next Generation Weather Radar (NEXRAD) system.

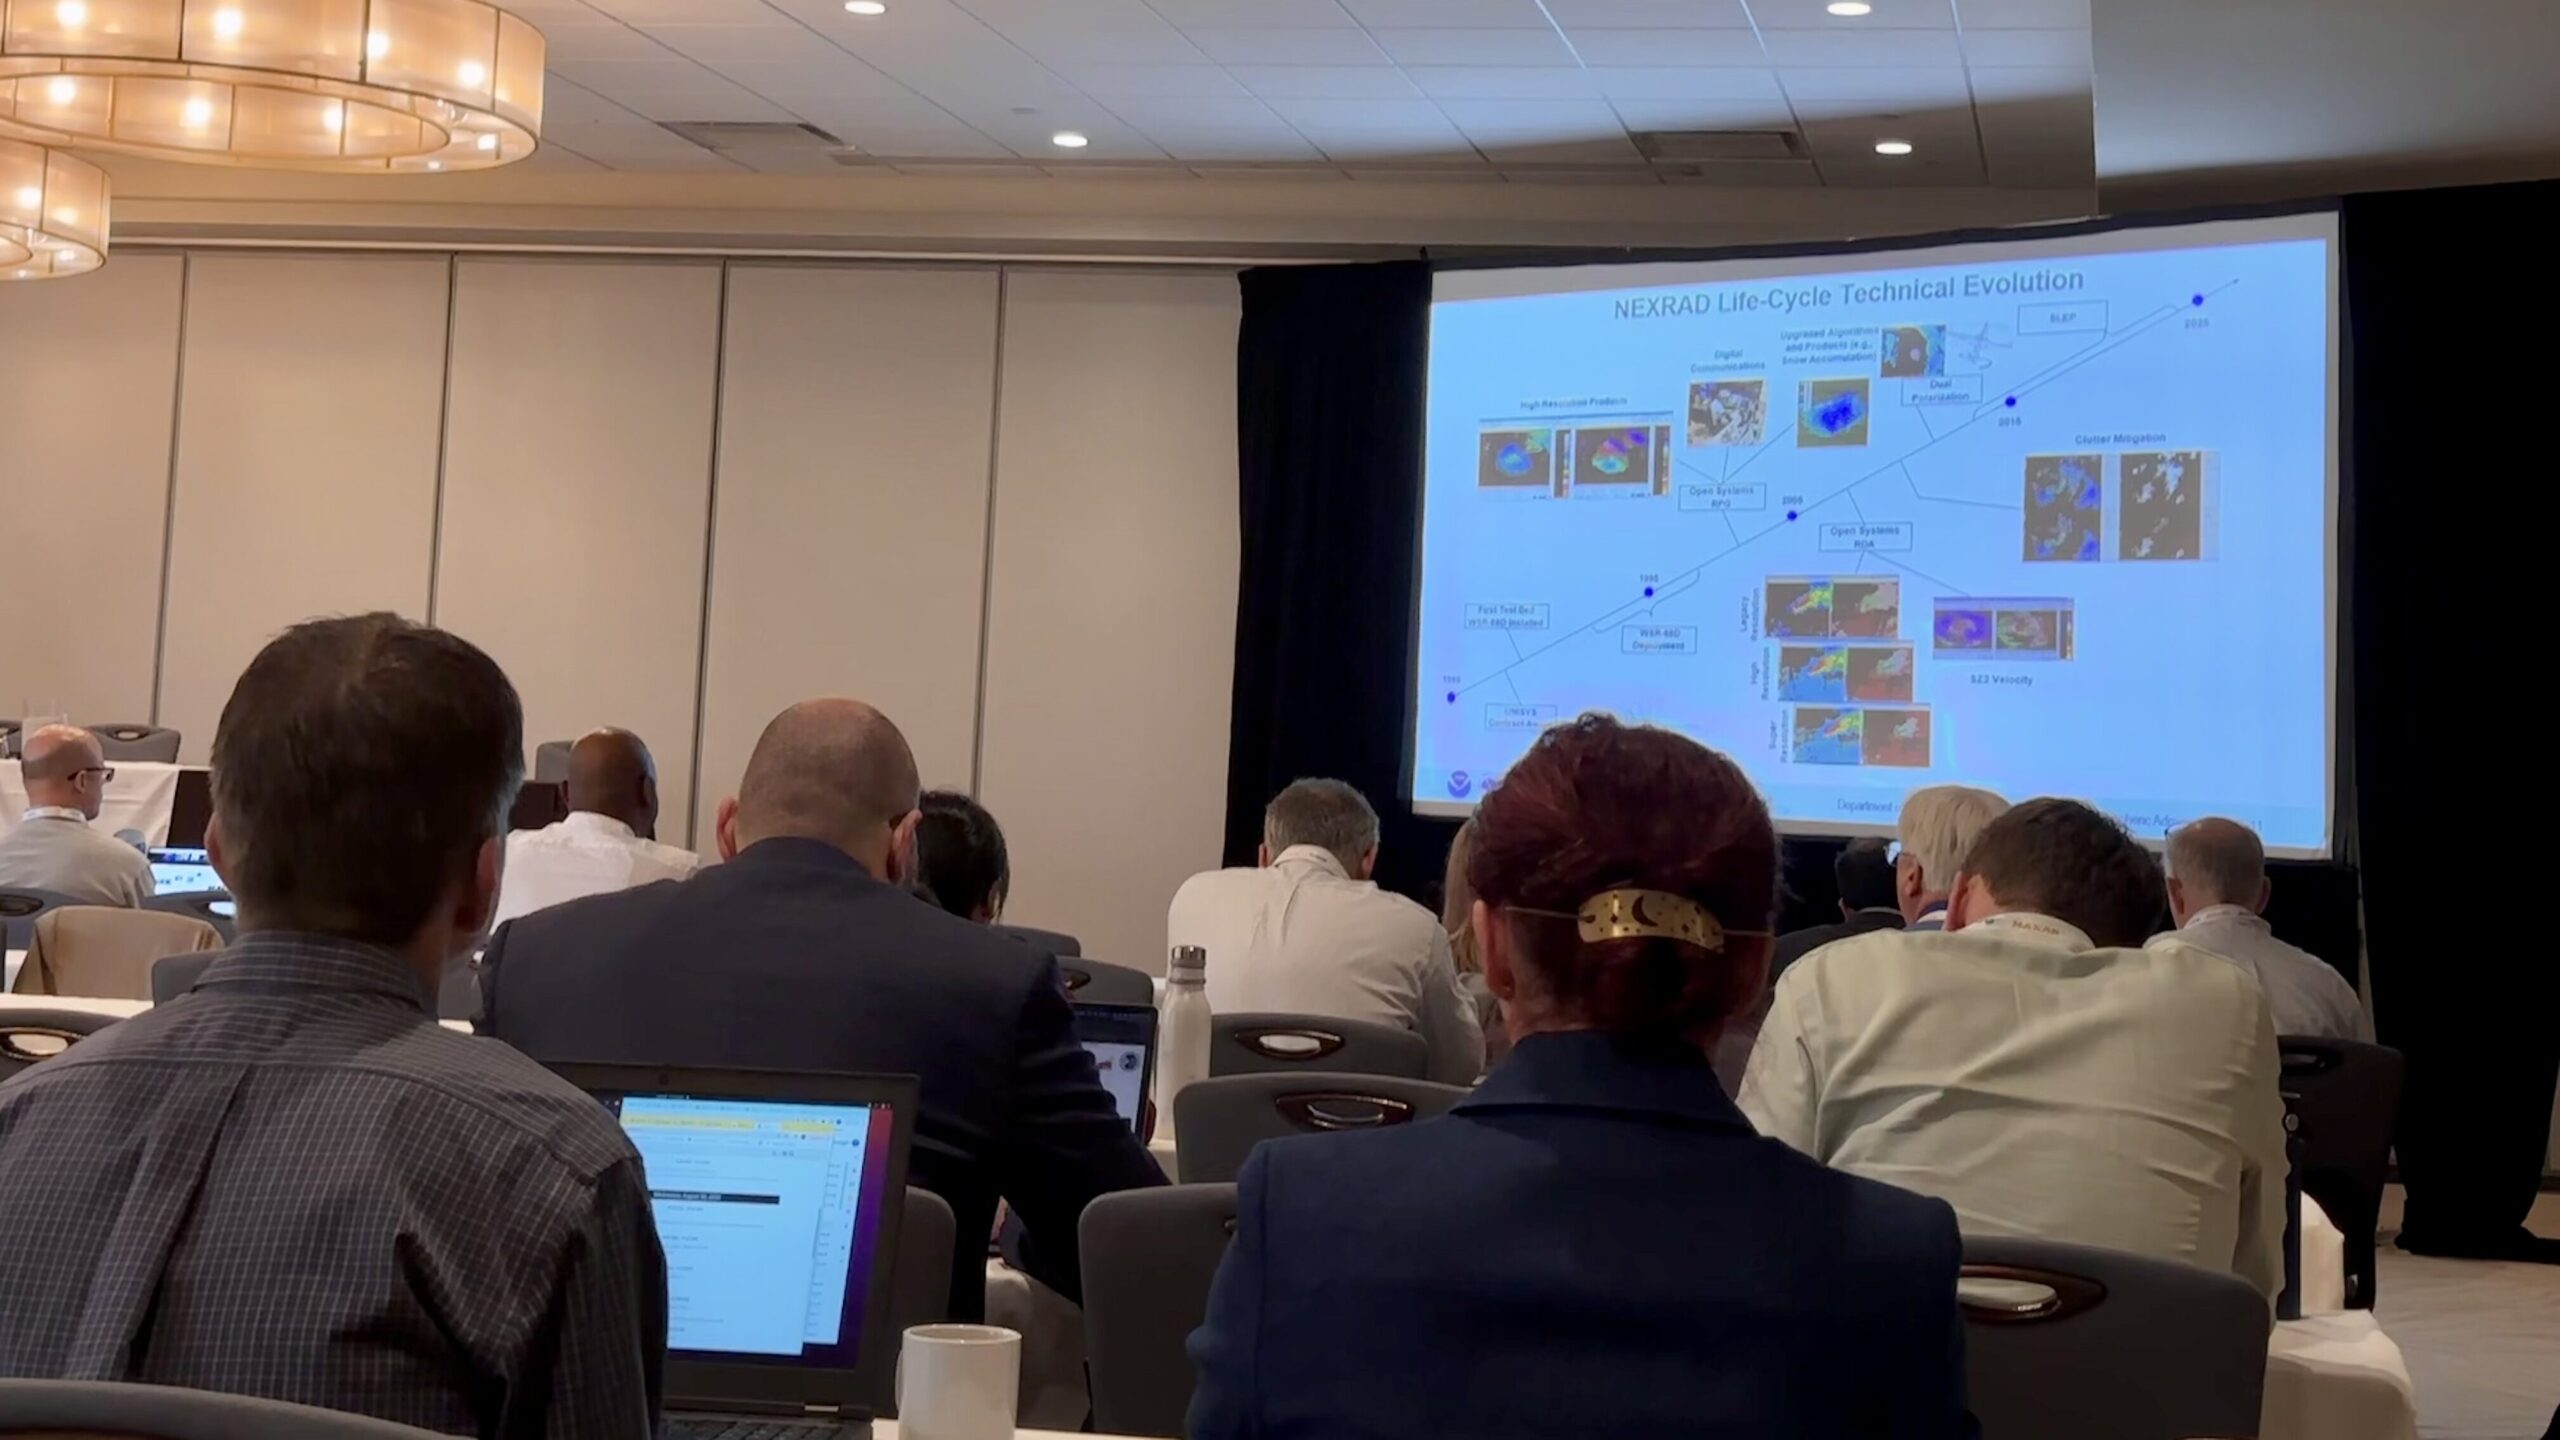
Some of the topics covered at this meeting included: updates on national policy; the NOAA Precipitation Prediction Grand Challenge; pressing issues in radar and forecasting, such as moving the national radar network beyond the WSR-88Ds; and the operations of the National Severe Storms Laboratory. My colleagues from AMS discussed the new and ongoing initiatives of the AMS Policy Program, such as: enhancing the effectiveness and potential of the weather enterprise over the next decade and beyond (see page 823 of the October issue of BAMS), the 2024 Summer Policy Colloquium, and the role of the AMS in enabling the future of both the climate and ocean enterprises.

Hurricane prediction gets personal

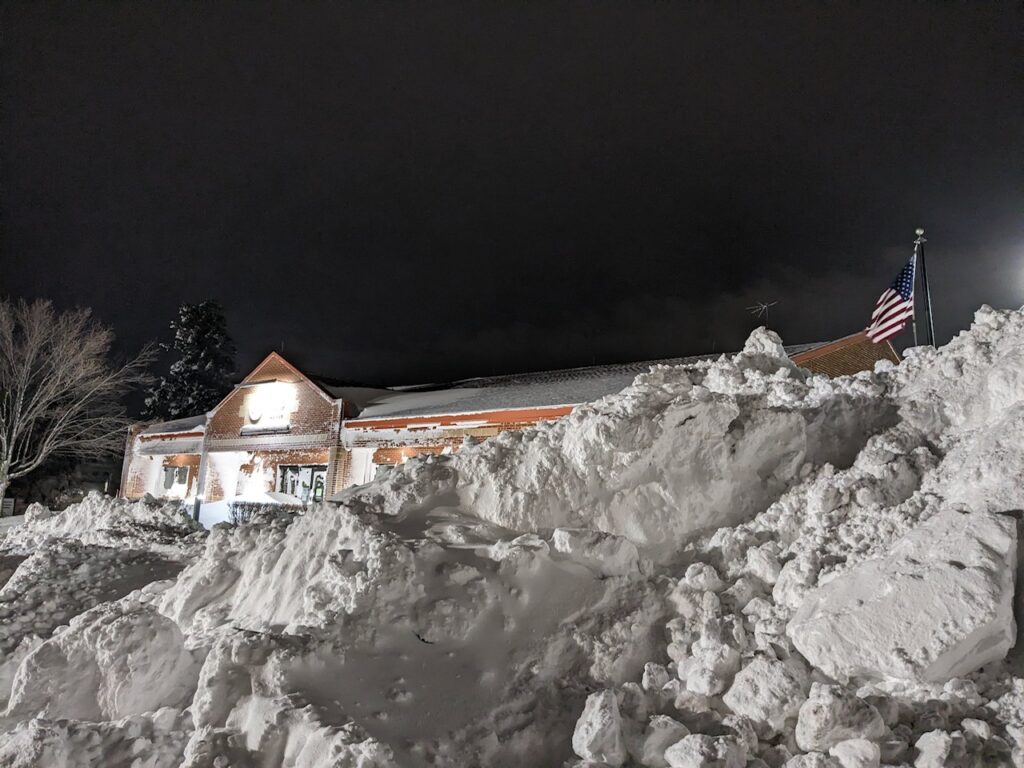
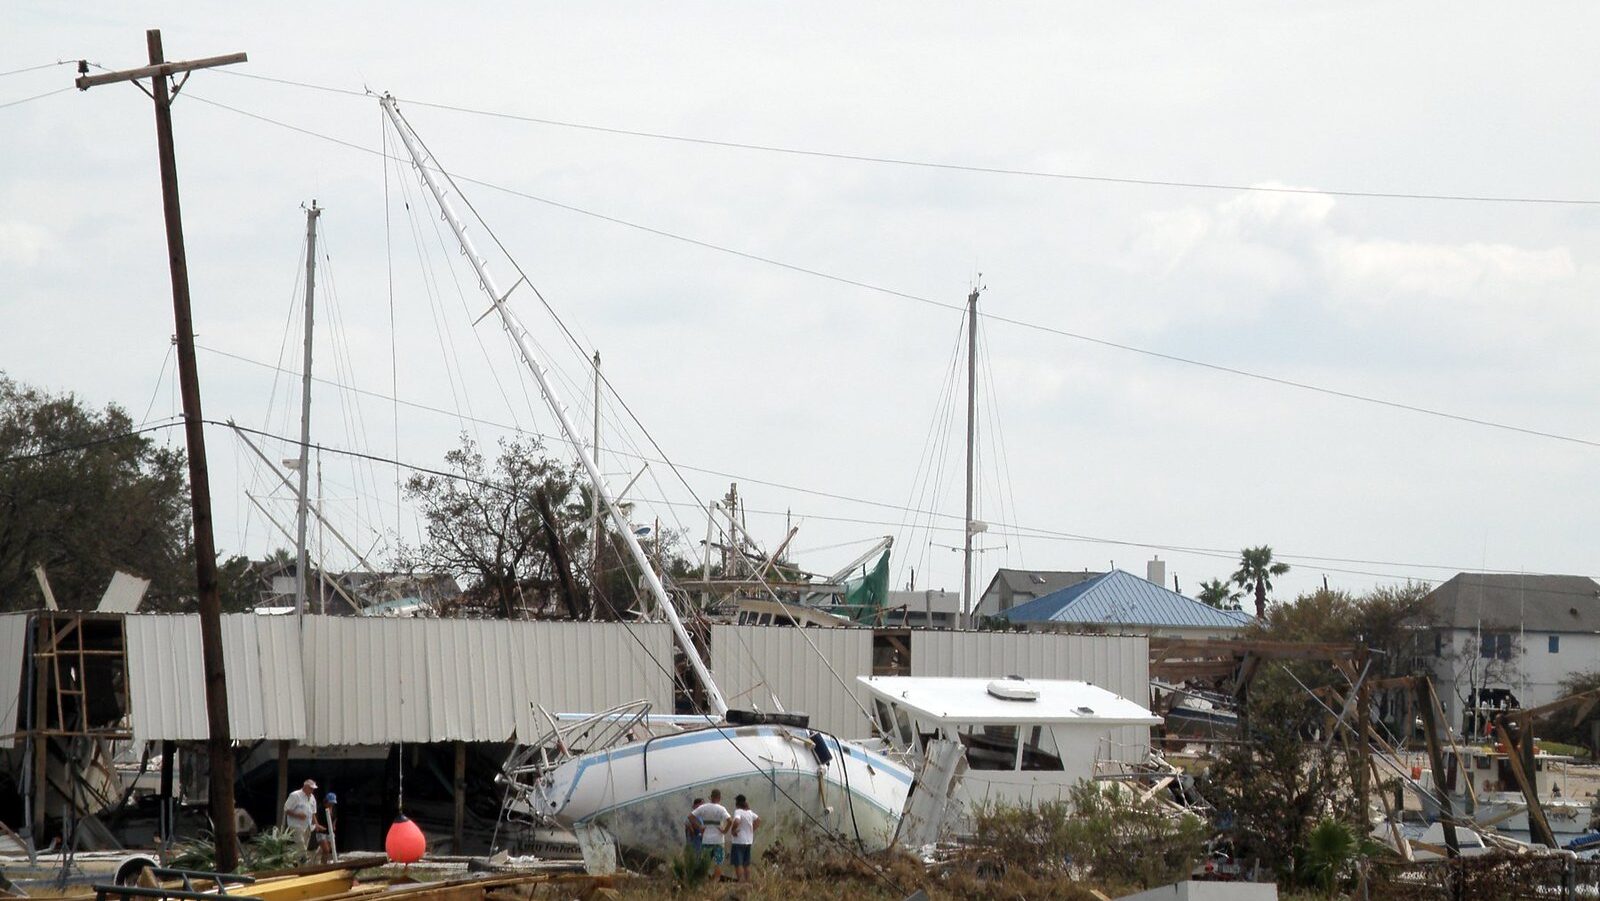
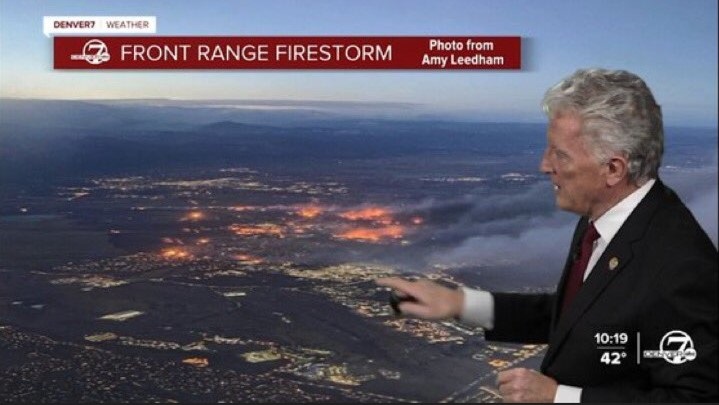
I was fascinated by some of the discussions about extreme weather and the increasing frequency of Billion-Dollar Weather and Climate Disasters. Attendees from the National Weather Service highlighted the widespread efforts to improve our forecasting and modeling of extreme weather events. 

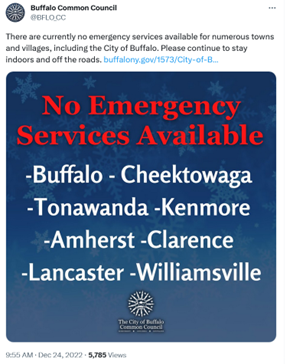
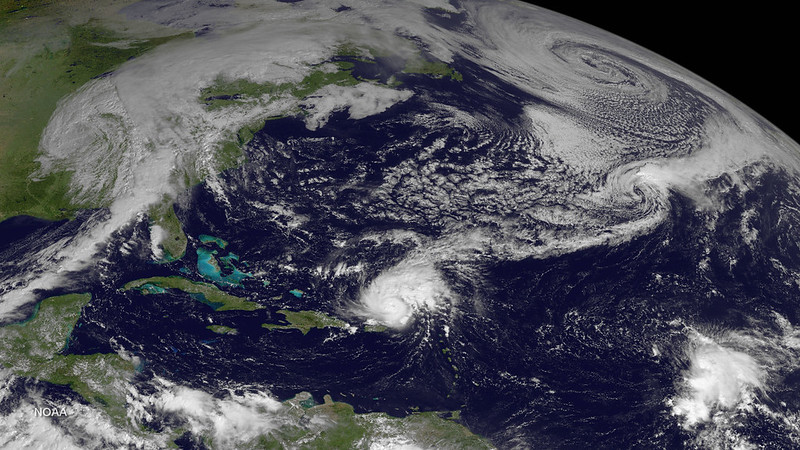
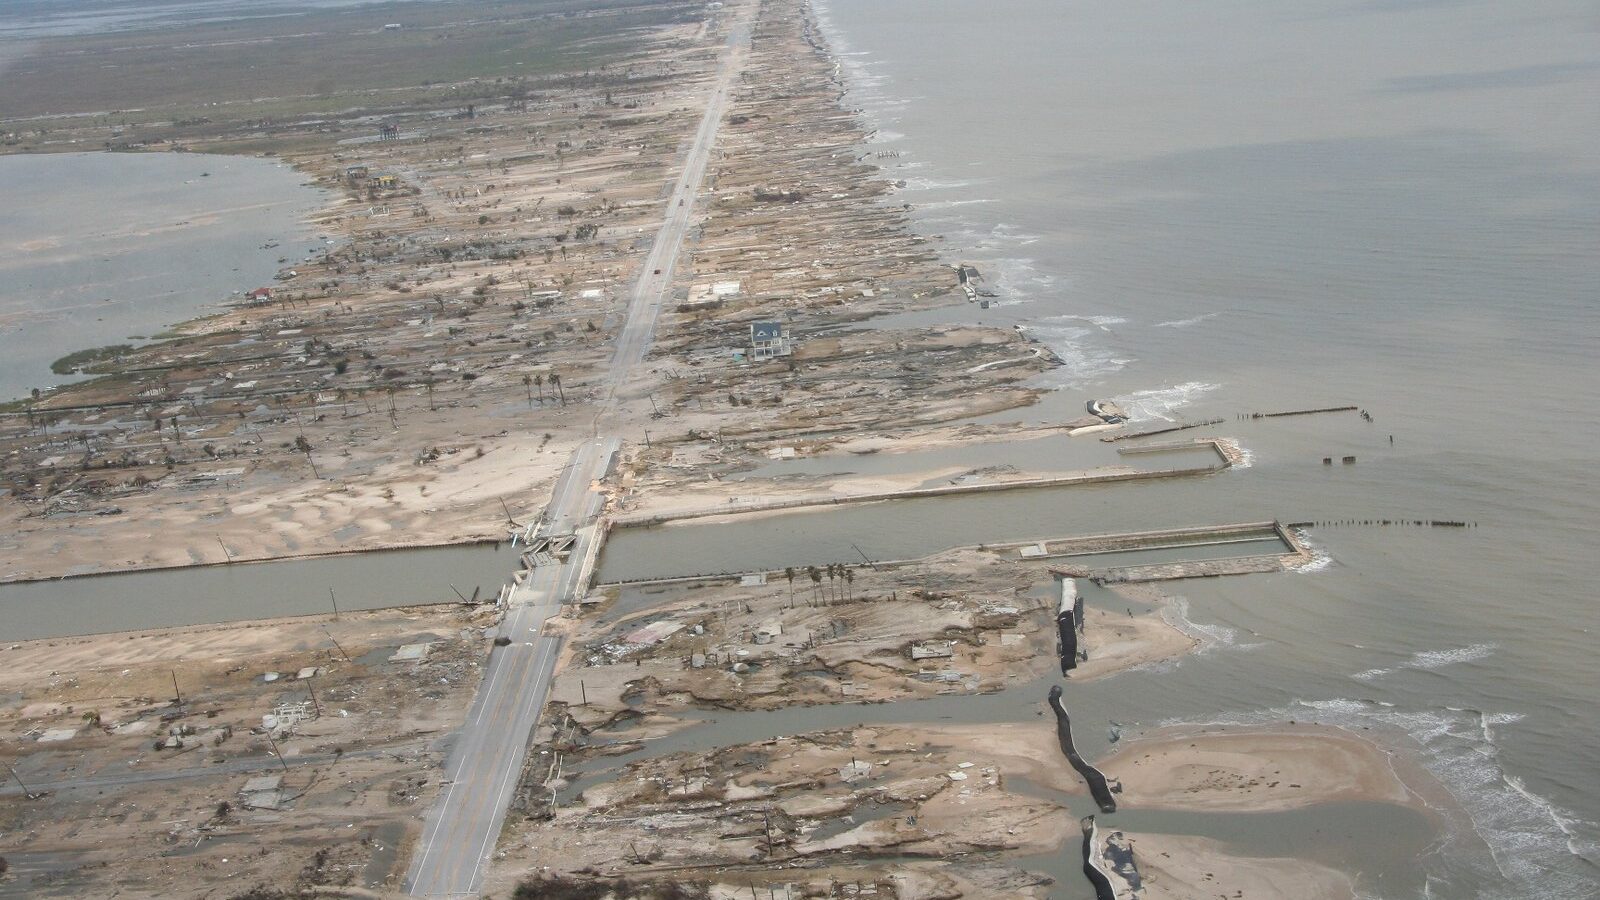
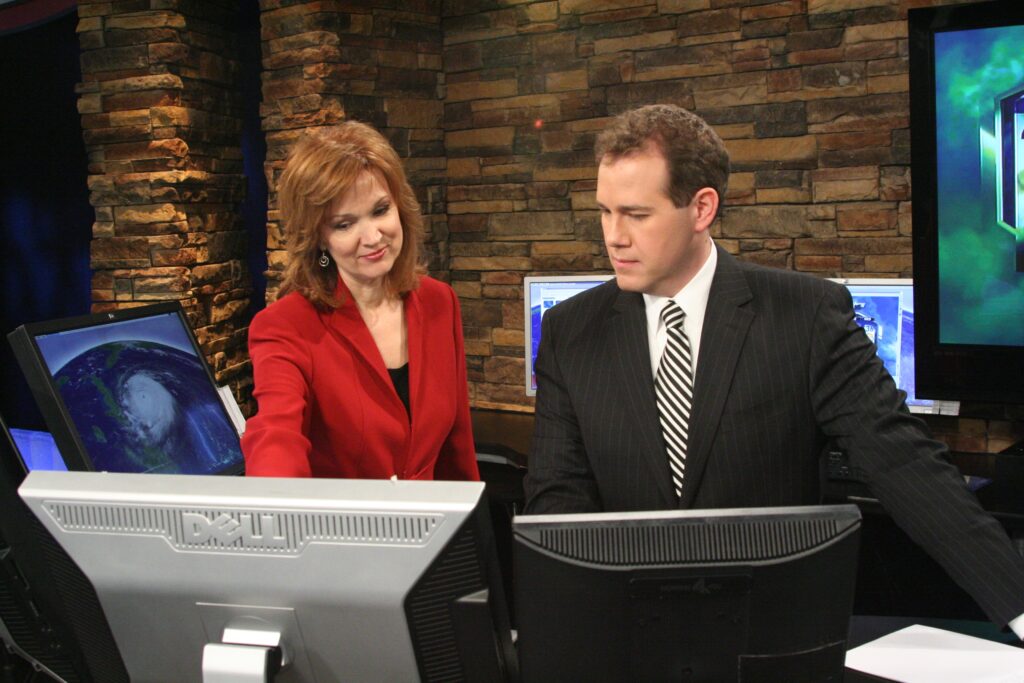
Discussions about major tropical storms particularly resonated for me, especially with Hurricane Idalia making landfall in Florida during the Meeting. I was born, raised, and currently reside in the Sunshine State, so I’m well-attuned to hurricane season and planning for impending storms. Hurricane Idalia is a perfect example of how advancements in hurricane models and forecasting have allowed meteorologists and WWC professionals to more accurately predict and communicate extreme weather hazards (such as the rapid intensification of the storm right before it made landfall), thus saving lives. I was able to witness some of this behind-the-scenes work. 

Compared with being at home refreshing the National Hurricane Center’s webpage and listening to advisories on the local news, as I had during previous hurricane seasons, this was an invaluable experience.
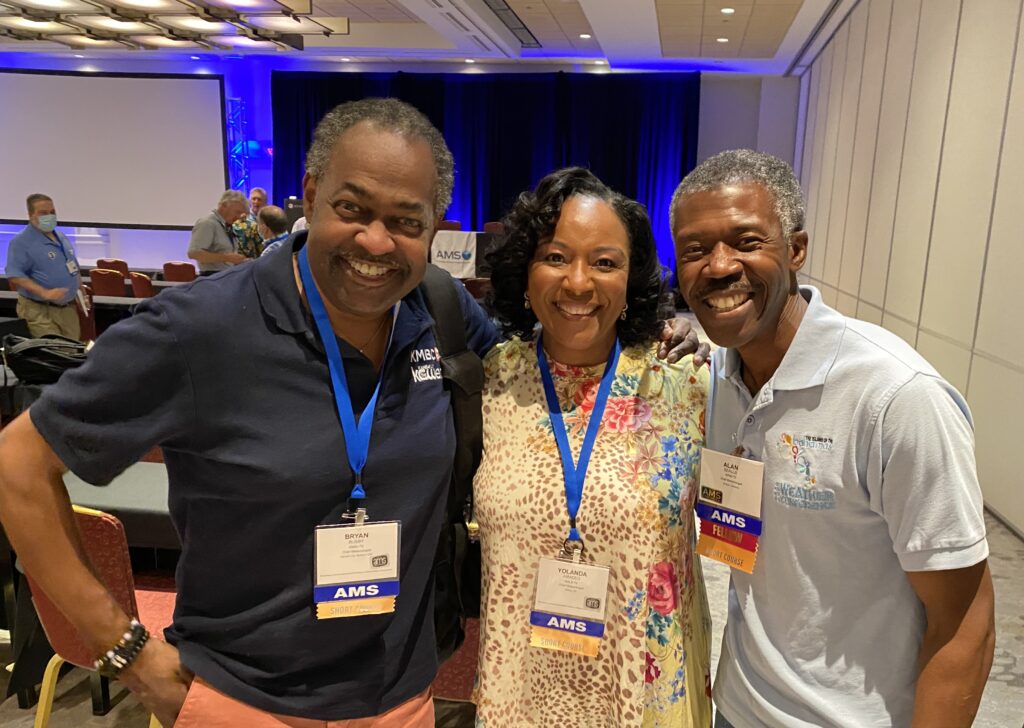
Reunions

Photo: Larry Hopper and Isabella Herrera at the Summer Community Meeting
Isabella Herrera and Larry Hopper at the AMS 2023 Summer Community Meeting. Photo: Isabella Herrera.

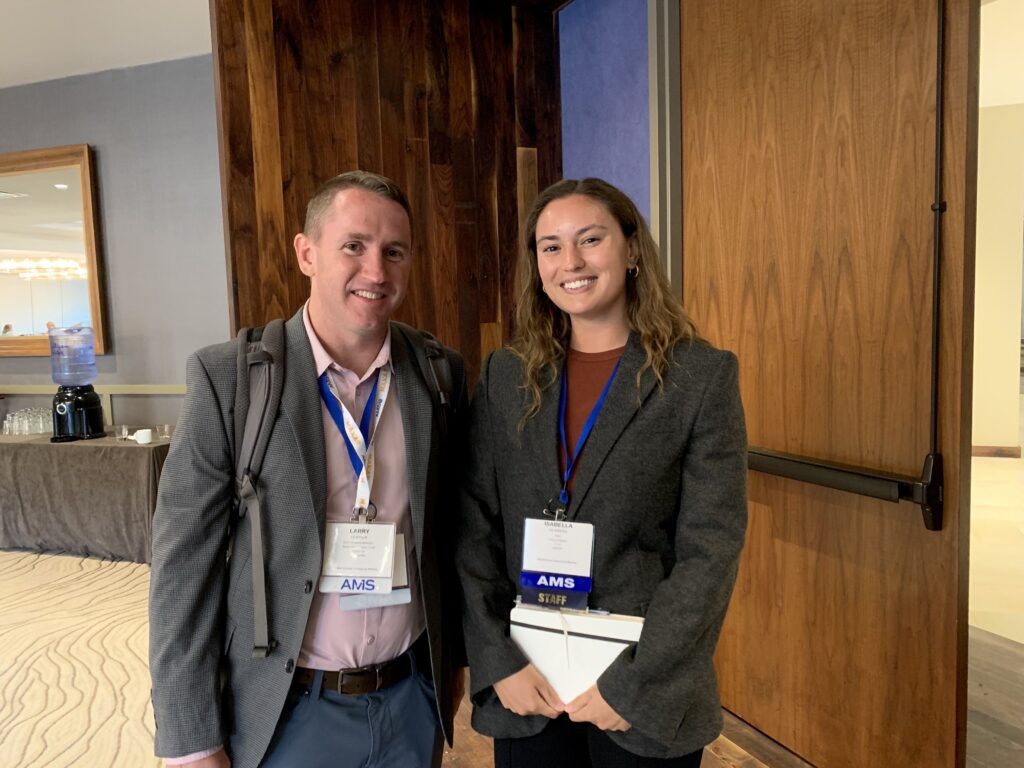
I was delighted to see fellow AMS Summer Policy Colloquium alum Larry Hopper presenting on current and emerging radar technologies as part of a Panel Discussion on Weather Radar Research. Reconnecting with Colloquium alumni is something that I’m looking forward to at the AMS Annual Meeting in January, and although the dates have yet to be announced for next year’s Summer Community Meeting, I’m already excited to hear about the initiatives across the WWC enterprise for 2024.

I saw so many others reunite with their colleagues, too (from graduate school, from years of working in the field together, or from previous AMS meetings). It reminded me that, in addition to creating connections, collaborations, and conversation across the weather, water, and climate enterprise, the AMS has another integral part to play in this space: building community.

“Once in a Generation”: The 2022 Buffalo Blizzard

Truck in snowdrift

A Research Spotlight from 32WAF/28NWP/20Meso

On 23 December, 2022, David Zaff of the National Weather Service’s Buffalo office walked out into a blank white world of howling wind. He headed to his car to get supplies, knowing there was no way to get home. He and his coworkers were trapped at the office, in the middle of one of the most deadly and disastrous blizzards Buffalo has ever seen.

Video by David Zaff, showing whiteout conditions outside NWS Buffalo office, December 23, 2022.

At the height of the 2022 holiday travel season, the four-day blizzard and lake-effect snow event knocked out power for more than 100,000 people, paralyzed emergency services and holiday travel, and left at least 47 dead. New York Governor Kathy Hochul described it as “the most devastating storm in Buffalo’s long, storied history.” Yet days earlier, Zaff and colleagues encountered skepticism from the public as they worked to warn the region.

Presenting at the J3 Joint Session at the 32nd Conference on Weather Analysis and Forecasting, the 20th Conference on Mesoscale Processes, and the 28th Conference on Numerical Weather Prediction, Zaff talked about the disaster and how the NWS countered accusations of hyperbole to get the word out.

Sounding the Alarm

The December 2022 snow was shocking, but not surprising. The pattern was easy enough to recognize, even 7–10 days earlier: a large high-pressure ridge forming over the western U.S., with a major trough in the east. “We knew something big was coming,” said Zaff. Five days before the storm, even low-resolution models suggested a major event. Four days ahead, the NWS started ringing the alarm bell. “We started saying, ‘A powerful storm will impact the region heading into the holiday weekend.’”

Three days out, the NWS issued an unusually emphatic Area Forecast Discussion (AFD):

“Some of the parameters of this intense storm are forecast to be climatologically ‘off the charts’ … One could certainly describe this storm system as a once in a generation type of event.”

NWS Lead Forecaster Robert Hamilton, Tuesday, December 20, 2022

That caused a stir, but many on social media dismissed it as hype. “People started saying, ‘There goes the weather service again,’” says Zaff.

He tried to find a way to show the science graphically, highlighting the forecast as “‘outside’ the climatology” for the time of year.

The graphic and its accompanying description got attention. By then, NWS Buffalo was communicating in earnest, including on social media. A tweet with a text-filled screengrab of the Winter Weather Message received 485,000 views. “A picture is worth a thousand words,” Zaff said, “except when people actually read the words, and see how impressive this event might be.”

Left: Graphic showing forecast surface pressure for Friday, December 23, 2022, with shading showing the relative frequency of the forecast MSLP values in the Buffalo region at that time of year. Source: David Zaff.

Surviving the Storm

Before noon on 23 December, visibility dropped to near zero, and it remained that way until around midnight on 25 December. 500 Millibar heights were “extraordinary” as the pressure trough moved into the Ohio Valley, and surface-level pressure was similarly unbelievable. A top wind speed of 79 mph was measured in downtown Buffalo at 10:10 a.m. on the 23rd, and winds in the 60–70 mph range lasted for 12 hours. “[It was] just an incredible bomb cyclone,” Zaff said. “An incredible storm.”

Zaff and some colleagues slept at the office; others attempted to drive in whiteout conditions using GPS alone, while some got stuck in drifts near the office and had to leave their cars to hike the rest of the way. Meanwhile, firefighters and airport employees worked to rescue motorists trapped nearby.

On December 24, the City of Buffalo issued “the scariest tweet I’ve ever seen,” said Zaff. The tweet stated that there were “no emergency services available” for Buffalo and numerous other towns.

“We knew by this time that there were fatalities occurring,” Zaff said. “And it just got worse and worse.”

Blizzard conditions lasted a full 37 hours–and lake effect snow wouldn’t stop for another two days. Three power substations shut down, frozen solid. Hundreds of power poles fell, and a significant percentage of locals were without power during the storm’s peak (some for days afterwards).

The 47 fatalities included people stranded outside, others who died from hypothermia in their homes, and some deaths due to delayed EMS response, according to Erie County. Hundreds of motorists were stranded on roadways during the storm. The Buffalo Niagara International Airport, with a proud legacy of operating under even the most horrific conditions, was closed for six days.

Zaff didn’t return home until late afternoon on the 25th, 18 hours after official blizzard conditions were over and having clocked 50+ hours at the office. On the drive, he saw iced-over buildings and trucks buried in snowdrifts. “It reminded me of [the movie] The Day After Tomorrow. … The impacts were tremendous.”

In his AMS presentation, Zaff compared the 2022 event to disastrous storms in 1977 (20+ fatalities, 69 mph winds, only 12” of snow yet drifts swallowed homes) and 1985 (5 fatalities, 53 mph winds, 33” snow), as well as the “Great Christmas Storm” of 1878, one of the first well-documented lake effect snow events, though lake-effect processes weren’t understood at the time. “This will likely be the storm of comparison now,” he says. “Once-in-a-generation” turned out to be right.

Future Lessons

Moving forward, said Zaff later, “Our intention is to further our relations with our Core Partners, including elected officials, emergency management, and the media [and] provide more probabilistic information that supports our ongoing Impact Decision Support Services. We hope to improve our outreach as well, instilling more confidence with the public.”

NWS will continue to provide improved decision support for partners, which may lead to more proactive road and school closures that could save lives in the future.

Photo at top: Buffalo roadways at 4 p.m. on December 25, 2022, 18 hours after blizzard conditions had passed. Photo credit: David Zaff.

About 32WAF/20Meso/28NWP

Predicting and understanding storms and other weather events is a complex business with real-world impacts. The American Meteorological Society’s 32nd Conference on Weather Analysis and Forecasting/28th Conference on Numerical Weather Prediction/20th Conference on Mesoscale Processes brought researchers, forecasters, emergency managers, and more together to learn about and discuss the latest scientific developments. The conferences took place in Madison, WI, and online 17–21 July, 2023. Recordings of the sessions are available here.

Who Creates the Future of AMS Peer Review? Maybe You Do!

Banners of 12 AMS journals laid out in a grid

By Gwendolyn Whittaker, AMS Publications Director

For Peer Review Week 2023, AMS and other scholarly publishers have been asked to reflect on both the essential role that peer review plays in scholarly communication, and also “the future of peer review.” In this second of our two Peer Review Week posts, we’ll take a look at how all stakeholders in AMS publications can contribute to discussions about evolving AMS peer review–and where those discussions might take place.

An evolving practice

In support of its Mission to advance science for the benefit of society, AMS publishes 12 peer-reviewed, highly regarded scientific journals. That high regard is the result of deep commitment over many decades from AMS’s volunteer leadership and from thousands of volunteer Editors and reviewers across the disciplines AMS represents. 

Researchers will take part in peer review throughout their career—sometimes as an author, sometimes playing the role of reviewer. Some will take on a journal editor role as well, with the responsibility of facilitating the review process and determining the ultimate fate of manuscripts. 

Peer review is a human endeavor, and is thus subject to human failings. Individual and systemic biases, along with global economic and social inequities, impact who has access to both the process and the results of peer review. But as with all human endeavors, its users can re-shape peer review to better serve its purposes.

As firsthand users of the tool that is peer review, researchers are the first to point out that peer review is not perfect, and the first to note where change is needed to better serve the scientific community.

At another level, disciplinary communities—such as those convened by AMS through its scientific meetings and journals—set ethical standards and best practices that reflect the communities’ values and expectations. The peer review process can and does change as those needs and values evolve. 

Peer review at AMS

For AMS, this ongoing “review of peer review” is centered in the work of the Publications Commission. Every AMS Chief Editor and the Chair of the BAMS Editorial Board is on the Commission, bringing constructive and insightful feedback from their editors, authors, reviewers, and readers to the Commission’s deliberations. The Commission sets best practices for editors, authors, and reviewers to follow, makes recommendations to AMS staff on improving processes and platforms, and provides policy and strategic recommendations to the AMS Council. 

In recent years, a particular focus for the Commission has been how to integrate AMS’s overall commitment to equity, inclusion, and justice into the publications endeavor. The Commission summarized its thinking so far in a recent editorial published in all the journals: “Equity, Inclusion, and Justice: An Opportunity for Action for AMS Publications Stakeholders.” As noted in the editorial, the Commission will be looking closely at results from AMS’s organization-wide Equity Assessment (currently underway), which will likely inform how AMS peer review evolves. 

As always, peer review at AMS will be shaped by the commitment and needs of researchers themselves, and also by scrutiny and constructive critiques from those who rely on the results—and who need the scientific endeavor to continue serving society into the future.

Have thoughts of your own on the future of peer review? Want to know more about peer review at AMS? Want to know how to volunteer to be considered as a reviewer or editor? Find out more or email us at [email protected]. We’ll be happy to hear from you!

What Do Non-Scientists Need to Understand about Peer Review?

Thoughts from AMS 2024 Editor’s Award Recipients

Peer Review Week 2023 logo

Understanding the role of peer review in science is vital not only for scientists themselves, but also for all of us who live in a society that relies on scientific research. Each September during Peer Review Week, AMS and other scholarly publishers highlight the essential role that peer review plays in scholarly communication.

In this first of two Peer Review Week posts, we’re hearing from some of AMS’s outstanding peer reviewers, recipients of the 2024 Editor’s Award, about what they think non-researchers need to understand about peer review.

At a basic level it is a check on, “do I believe the results presented here and the implications that are claimed?The check is made by other researchers working independently in the field. The checking of a single paper isn’t exhaustive, but there is an ongoing process—results and ideas established in one paper will, if they are of any significance, be re-examined and developed further in subsequent papers, which will themselves be peer reviewed.

Dr. Peter Haynes, Cambridge University
Dr. David Bodine

For non-researchers, I think it’s important to understand that peer review requires substantial effort … by volunteer reviewers, editors, and [the] scientists submitting manuscripts. A well-coordinated review process by all involved improves the quality and ensures the integrity of scientific research.

Dr. David Bodine, University of Oklahoma

Dr. Elizabeth Yankovsky

The peer review process is the only barrier standing between the writing of a scientific study and its publication. It is very easy for an unsubstantiated or erroneous paper to set an entire field back by years. In my opinion, the peer review process is as important as the research that goes into a given paper. … A given scientist may have one perspective and associated biases. Through peer review, the results are assessed by other scientists and are judged against the state of knowledge of the field. To push our boundary with the unknown forward, scientists must rely on both the historical backbone of their field as well as thorough review by their modern-day peers.

Dr. Elizabeth Yankovsky, New York University

Just because a paper was published after undergoing “peer review” does not make it absolutely correct or perfect, nor is it the final message on that idea. Unfortunately I feel the phrase “peer reviewed” is often used to imply some absolute consensus on a subject has been reached, when in reality it’s an ongoing, necessary criticism of the science that we do. As scientists we are constantly peer-reviewing each other’s work, and this may spark new, contrary ideas to be published that refute earlier findings.

Dr. Luke Madaus, Jupiter Intelligence
Dr. Sarah Buckland

Popular culture oftentimes misconstrues science in either the extreme of being purely political/agenda-driven or being the ultimate source of truth without question. The truth is, science is not ultimate, and understandings of processes and concepts are dynamic, and, as is especially evident in interdisciplinary research, scientists do have perspectives shaped by experiences. While I also cannot deny that bias exists in scientific fields and that contrasting perspectives may filter out at times, authentically anonymous and double-anonymous peer review processes (i.e., the reviewer not knowing the authors’ name(s)), act as guardrails to significantly reduce bias. [If] these processes remain clean and the selected reviewers are indeed experts in the field of the papers that they review, this significantly aids in ensuring that the end product is of the highest quality. The existence of these processes is why academic journals are deemed among the most credible sources of scientific information.

Dr. Sarah Buckland, University of the West Indies

Dr. Mimi Hughes

I think what I wish non-researchers understood about the scientific review process is how many eyes are on these papers before they’re published, and how that regularly improves the science and writing of the end-product. Most reviewers take the responsibility very seriously, and indeed are usually hesitant when they haven’t “found enough to fix” in a paper they review. It is typically a truly rigorous process.

Dr. Mimi Hughes, NOAA Physical Sciences Laboratory

Dr. Aaron Hill

I think non-researchers should know that peer review is only good and valuable when it is conducted from an unbiased position. It is vitally important that authors receive unbiased, external perspectives on their work in order to ensure that any gaps or misunderstandings can be addressed, and that the science is technically sound. Peer review is just ONE step in the scientific process as well, and sometimes bad work slips through the cracks of review. But peer review is a critical component to upholding and advancing science.

Dr. Aaron Hill, Colorado State University

Dr. Qiaohong Sun

Peer review serves as a crucial method for the scientific community to uphold the quality and credibility of scientific information accessible to the public. A paper passing peer review doesn’t guarantee absolute perfection, it indicates a level of examination and approval by experts in the field to some extent at the current time.

Dr. Qiaohong Sun, Nanjing University of Information Science and Technology

Dr. Sebastian Lerch

Peer review is a critical control mechanism in the scientific process. Mistakes can happen and may still get through the process. However, the collective nature of peer review and subsequent scrutiny by the scientific community help correct errors over time. This in particular highlights the importance of making research reproducible by publishing data and code.

Dr. Sebastian Lerch, Karlsruhe Institute of Technology

Dr. Andrew Feldman

It works! It is the main mechanism that keeps science reliable and transparent. Scientists respect and cite published work. In order to get science published, it needs to be read by 2-4 anonymous colleagues and editors and then revised. Even when it goes wrong and a paper is published with an error or not-well-supported argument, researchers are good at detecting this after the fact. It is a robust process that keeps the advancement of knowledge at a high-quality and transparent level.

Dr. Andrew Feldman, NASA Goddard Space Flight Center

A Few Takeaways from the “State of the Climate in 2022”

Map of significant global weather and climate anomalies and events of 2022.

Record-high greenhouse gases, sea levels, monsoons, and droughts—and a volcanic vapor injection

By Michael Alexander, Lead, Atmosphere Ocean Processes and Predictability (AOPP) Division, NOAA, and BAMS Special Editor for Climate

The annual NOAA/AMS State of the Climate report has just been released, with a comprehensive global look at the climate in 2022. Produced by the NOAA National Centers for Environmental Information (NCEI) and the American Meteorological Society, the State of the Climate Report maps out the complex, interconnected climate phenomena affecting all parts of the globe. It also charts global progress in observing and understanding our climate system. 570 scientists from 60 countries contributed to this year’s report, including a rigorous peer review, making it a truly global endeavor. 

As the senior editor on this project, I wanted to share with you a few highlights. Click here to read the full report, published as a supplement to the Bulletin of the American Meteorological Society.

New record-highs for atmospheric greenhouse gases CO2, methane, and nitrous oxide.

It was yet another record-setting year for atmospheric carbon dioxide and other greenhouse gases. 2022 saw an average concentration of 417.1 ± 0.1 ppm for atmospheric CO2; methane and nitrous oxide also reached record highs. 

Graphs of yearly global surface temperature compared to the 1991-2020 average for each year from 1900 to 2022, from 6 data records, overlaid on a GOES-16 satellite image from September 22, 2022.  Image credit: NOAA Climate.gov.

Warmest La Niña year on record.

Despite being in the typically cooler La Niña phase of ENSO, 2022 was among the six warmest years on record, and was the warmest La Niña year ever recorded. Summer heat waves left annual temperatures at near-record highs in Europe, China, the Arctic, and Antarctica (parts of Europe set daily or seasonal heat records), and New Zealand experienced its warmest year ever. High-pressure “heat domes” helped elevate local temperatures in many areas, including parts of North America and Europe. 

Record-high global mean sea level and ocean heat.

Global mean sea level reached 101.2mm above 1993 levels, setting a new record for the 11th year in a row. 2022 also saw record-high global ocean heat content (as measured to 2000 meters below the surface), although La Niña moderated sea-surface temperatures.

Image credit: NOAA

Complex climate picture.

Global warming trends continued apace, but of course numerous large-scale climate patterns complicated the picture. In 2022 we saw the first “triple-dip” La Niña event (third consecutive La Niña year) of the 21st century. The Indian Ocean Dipole had one of its strongest negative events since 1982, which led to increased temperatures and precipitation in the eastern Indian Ocean. Along with La Niña, this contributed to record-breaking monsoon rains in Pakistan that caused massive flooding and one of the world’s costliest natural disasters. We also had a positive-phase winter and summer North Atlantic Oscillation affecting weather in parts of the Northern Hemisphere. 

A bad year for drought.

For the first time ever, in August 2022, 6.2% of the global land surface experienced extreme drought in the same month, and 29% of global land experienced at least moderate drought. Record-breaking droughts continued in equatorial East Africa and central Chile. Meanwhile, parts of Europe experienced one of their worst droughts in history, and China’s Yangtze River reached record-low levels.

Warmth and high precipitation at the poles.

2022 was the firth-warmest year recorded for the Arctic, and precipitation was at its third-highest level since 1950. The trend toward loss of multi-year sea ice continued. Meanwhile, Antarctic weather stations recorded their second-warmest year ever, including a heatwave event that collapsed the Conger Ice Shelf, and two new all-time record lows in sea-ice extent and area set in February. On the other hand, record snow/icefall due to atmospheric rivers led to the continent’s highest recorded snow/ice accumulation since 1993.

Image credit: NOAA

Notable storms: Ian and Fiona.

85 named tropical cyclones were observed across all ocean basins, an approximately average number. Although there were only three Category 5 storms, and the lowest recorded global accumulated cyclone energy, the year produced Hurricane Ian, the third-costliest disaster in U.S. history, as well as Hurricane Fiona, Atlantic Canada’s most destructive cyclone.

Massive volcanic injection of atmospheric water vapor.

The Hunga Tonga-Hunga Ha’apai submarine volcano in the South Pacific injected a water plume into the atmosphere of unprecedented magnitude (146+/-5 Terragrams, about 10% of the stratosphere’s total water) and height (reaching into the mesosphere). We don’t yet know what, if any, long-term effects this will have on the global climate, although the increase in water vapor has interfered with some earth system observations. 

The full report is a comprehensive and fascinating analysis of our climate system in the previous calendar year. I urge you to read it and communicate your own takeaways from the State of the Climate in 2022. You can read the press release here.

Infographic at top: World map showing locations of significant climate anomalies and events in 2022. Credit: NOAA.

CalFiDE: Observing Large-Scale Fires from the Air and the Road

Mosquito Fire and plane propeller

A Research Spotlight from the 14th Annual Fire and Forest Meteorology Symposium, 2–4 May, 2023

Through the smoke of record-setting Canadian wildfires–which continue to burn millions of acres in the north–the importance of understanding huge, landscape-scale fires has never been clearer. In a 4 May presentation in the ninth session of the 14th Fire and Forest Meteorology Symposium, Brian Carroll discussed recent efforts to gather scientific observations on these types of landscape-scale wildfires in California and Oregon through CalFiDE, the California Fire Dynamics Experiment. His team looked at the behaviors of these fires and the winds they create and interact with, as well as the impacts of smoke plumes on air quality.

Field observations of wildfires this large are very rare. The CalFiDE team (including scientists from NOAA, CIRES, San Jose State University, the University of Nevada Reno, and NASA) used airborne and ground-based vehicles and a satellite to take measurements of five fires in August–September 2022. That included the Mosquito Fire, the largest in California that year, which burned more than 76,000 acres and prompted evacuation orders for 11,000 people. 

Carroll described the difficult and potentially dangerous process of conducting continuous observations of huge fires, without getting in the way of firefighters and emergency managers.

“There’s an aircraft exclusion zone that’s dedicated for the firefighters,” he notes. “The pilots have that information and avoid those areas but the pilots’ own decisions to keep our aircraft safe against the strong fire-generated winds and smoke are also a big driver. Even at a safe distance from the strong updraft produced by the fire, the wind convergence into the smoke column had to be compensated for by angling the plane away.” 

They were aided by state-of-the-art mobile Doppler lidar systems that allowed them to map air and fire behaviors over large distances in complicated terrain. “There are few lidars in the world capable of making these wind measurements while moving, and that mobility is important when dealing with wildfires that are constantly evolving,” Carroll says. “The lidars also provide real-time information on the winds and location of smoke layers, and we use that information to optimize sampling patterns and target layers for sampling trace gases.”

The CalFiDE team conducted surveys with a NOAA Twin Otter airplane, using Doppler lidar, infrared imaging, and trace gas measurements. They also drove an instrumented pickup truck (known as PUMAS, the Pick-Up-based Mobile Atmospheric Sounder) on the outskirts of the fire with additional Doppler lidar and temperature measurements, getting a 3-D picture of the winds above the truck as they drove. Meanwhile, the Multi-angle Imaging SpectroRadiometer (MISR) instrument aboard NASA’s Terra satellite provided a broad swath of smoke distribution information from space.

Above image: Fires observed during the 2022 CalFiDE campaign. Aircraft bases of operation with 1-hour flight range ring are shown in black, and platforms involved are on the right. The Twin Otter and PUMAS both had scanning Doppler lidars capable of profiling winds while underway.

The airborne lidar provided cross-sections of fire updraft cores (areas of hot, rising air) and smoke plume motions, complemented by the infrared imagery capturing the fire’s shape and evolving intensity. These are some of the first measurements of their kind, and will provide important ground-truth comparisons for fire and air quality modeling.

Plots of airborne Doppler lidar measurements show a side-view cross section of smoke plumes over fire. These are vertical profiles of upward/downward winds (vertical velocity) from the Mosquito Fire on 8 September, 2022, taken at 7:03 pm (top) and and 7:17 pm (bottom). Darker red indicates faster upward air movement, and the black lines correspond to the smoke plume. Black arrows show wind speed and direction at different heights. Colored dots show the altitude of the ground surface and the “brightness temperature” (intensity of the fire heat) at each location based on longwave infrared imaging.

PUMAS observations also allowed the team to generate a high-resolution picture of smoke behavior in nearby areas—for example, the ways smoke lingered in valleys during calm conditions, and how rapidly air quality improved when sea breezes disrupted the smoke layer.

“Driving around these local valleys, in a few kilometers you could have a huge change in how much smoke there was, and a large change in temperature. And there’s a major change in boundary layer dynamics as you move in and out of those regions.”

Brian Carroll, Research Scientist at CIRES/NOAA

PUMAS data showing smoke-filled valleys. Very high concentrations of smoke in the morning, confined in the lowest 500 meters (top panel), transitioned to cleaner air (bottom panel) with the introduction of a sea breeze that traveled through the valleys. Data curtains (colored vertical stripes) depict lidar attenuated backscatter, which correlates with smoke concentration, along a 56 km driving route. Arrows show wind direction, with size and color indicating wind speed.

“The West Coast of the United States has experienced terrible fire seasons recently, with smoke impacting the lives of millions and fires themselves displacing many others. People across the U.S. and Canada have gained additional insight this year into what that’s like. We need more comprehensive information about how these fires grow, how the smoke moves, and the atmospheric conditions that interact with the fires, as we face a future that will likely see even more extreme fire seasons. The CalFiDE team’s efforts will help meet those needs,” Carroll says.

An article providing an overview of CalFiDE has been submitted for publication in the Bulletin of the American Meteorological Society

Brian Carroll is a research scientist with the Cooperative Institute for Research in Environmental Sciences (CIRES), working in The NOAA Chemical Sciences Laboratory (CSL) Atmospheric Remote Sensing Program.

The recording of this session is now publicly available here.

About 14Fire

Meteorology and wildfires are intimately interconnected—and wildfires are becoming increasingly severe and frequent in many parts of the United States. From local residents and firefighters on the ground to planners and insurers, to people hundreds of miles away breathing wind-driven smoke, society relies on our ever-improving ability to understand and forecast fires and the related atmospheric conditions. The American Meteorological Society’s 14th Fire and Forest Meteorology Symposium brought together researchers and fire managers to discuss the latest science. All conference presentations are now publicly available.

Top image: Mosquito Fire flames and smoke on hillside, seen from the NOAA Twin Otter during CalFiDE on 8 September 2022. Photo credit: LT Nick Pawlenko.

Recent Trends in Tropical Cyclone Fatalities in the United States

Satellite photo of Hurricane Gonzalo (a ball of swirling clouds) over the Atlantic near Puerto Rico; other larger cloud systems are seen in the upper part of the photo, eclipsed by the curvature of the Earth in the top right. Photo taken by GOES East satellite at 1445Z on October 14, 2014. Photo credit: NOAA.

New data from the past ten years reveal increased prominence of freshwater floods and indirect fatalities in hurricane deaths

Guest post by Dr. Michael Brennan, Director, National Hurricane Center; Daniel Brown, Warning Coordination Meteorologist, National Hurricane Center; and Leah Pope, Hydrologist, Northwest River Forecast Center

The National Hurricane Center’s mission to “save lives and mitigate property loss” is not just achieved by issuing effective watches, warnings, and forecasts of tropical cyclones. We also spend a large portion of the “offseason” educating the public, emergency managers, and our media partners about the risks that tropical cyclones (TCs), including hurricanes, pose to life and property in the United States. Those include natural hazards such as storm surge, wind, and rip currents, and also includes dangerous conditions in the aftermath of a landfalling tropical cyclone, which may lead to “indirect” fatalities. These are deaths which are not directly due to the forces of the storm, but which would not otherwise have occurred. NHC routinely compiles and assesses TC-related information through vehicles such as our Tropical Cyclone Reports (TCRs). Data from the most recent decade reveal that fatality trends may be changing.  

Note:  The fatality data presented here do not include any fatalities from Hurricane Maria in Puerto Rico, since there was no specific, definitive cause provided for those deaths.

Direct Fatalities

Aerial photo of a peninsula/barrier island that has been breached by a storm surge. Sand, buildings, and other structures have been washed away or damaged, including visible broken lines of sandbags, a damaged bridge, damaged trees, and obliterated buildings; only one house appears to still be standing.
Storm surge damage from Hurricane Ike, Bolivar Peninsula, Texas, 2008. Photo credit: NOAA.

Previous studies by Rappaport (2014) and Rappaport and Blanchard (2016) summarized direct and indirect fatality data from Atlantic basin tropical cyclones in the United States for the 50-year period 1963–2012. During that period, nearly 9 out of 10 tropical cyclone-related direct deaths in the United States were due to water. Storm surge was responsible for nearly half (49%) of the direct deaths, and over one-quarter (27%) were due to rainfall-induced freshwater flooding.  

In response, the National Weather Service (NWS) and NHC worked to improve outreach, education, and communication of storm surge and rainfall hazards. We introduced new real-time storm surge maps in 2014, and in 2017 introduced a storm surge watch/warning that highlights the risk of life-threatening storm surge inundation. 

New Data Suggest Changing Trends

Since 2012, the United States has experienced 21 hurricane landfalls, including 8 major hurricanes, and more than 20 tropical storm landfalls. Eighteen of these hurricane landfalls, including all of the major hurricanes, occurred during 2017–22 after a relatively quiet period. Given the significant number of tropical cyclone landfalls in recent years, and increased deployment of warnings around the storm surge hazard, NHC examined and compared fatality data from the most recent 10-year period (2013–22) to the earlier studies.

Hazard % of direct fatalities from this cause
(1963–2012)
% of direct fatalities from this cause
(2013–2022)
Storm Surge49%11%
Freshwater Flooding27%57%
Wind8%12%
Surf/Rip Currents6%15%
Offshore Marine Incidents6%3%
Tornadoes3%2%
Other1%1%
Note: Due to rounding, numbers may not add up to 100%.

During the most recent 10-year period in the United States, about 57% of direct tropical cyclone deaths were due to drowning from freshwater (rainfall) flooding. Surf and rip current fatalities have become an increasing threat, making up about 15% of direct fatalities in the past decade. These fatalities often occur one or two at a time from distant storms hundreds of miles offshore. Florida, North Carolina, and New Jersey experienced the highest number of TC-related surf and rip current fatalities. Storm surge and wind-related deaths account for 11% and 12% of the direct fatalities, respectively.  

Every hurricane is different, however. Hurricane Harvey in 2017 had the largest number of direct deaths—68, 65 of which were due to freshwater flooding in Texas—in the past decade. Hurricane Ian (2022) was the second deadliest with 66 direct fatalities, 41 of which were due to storm surge in Florida. More than 65% of those who died from direct causes were men, with about 60% of the victims over the age of 60.

Indirect Causes

Image of a boat stranded on land, leaning against a wind-destroyed structure and a power line, amid other debris, including destroyed buildings and cars. Three people stand next to the boat observing the damage.
Aftermath of Hurricane Ike in Galveston, Texas, 2008. Photo credit: NOAA.

The recent study revealed that over the past 10 years there has been nearly an equal number of indirect deaths as direct fatalities. Indirect fatalities are due to a wide range of causes, including traffic accidents (16%), preparation/cleanup accidents (15%), carbon monoxide poisoning (12%), lack of medical care (11%), power problem/electrocution (11%), post-storm heat deaths (9%), unknown causes (9%), cardiac-related deaths (7%), and evacuation-related deaths (5%). 

The largest number of indirect deaths in the past decade occurred in association with Hurricanes Ian (90), Irma (82), Michael (43), Harvey (35), and Laura (34). Most (75%) of the indirect deaths are associated with major hurricane landfalls, which leave communities very vulnerable and often with long-duration, widespread power outages. More than half (57%) of the victims were over the age of 60. Younger victims tended to die in vehicle accidents; for older victims, medical-related issues, heat, evacuation, and other accidents were more likely causes of death.

Improving Warnings and Public Understanding

The results of these most recent studies have led the NWS and NHC to increase messaging on the hazards and causes of both direct and indirect fatalities. We continue to highlight rainfall flooding and storm surge risk through the Weather Prediction Center’s Excessive Rainfall Outlook, Flood Warnings from local NWS offices, and increased emphasis on the Storm Surge Warning. These warnings are the loudest “bells” that the NWS can ring during life-threatening flooding. We encourage our media and emergency management partners to work with us to encourage timely public response and personal preparedness ahead of these threats. 

Additionally, with the increased percentage of rip current fatalities associated with high surf and swells from distant hurricanes, the NWS has created new infographics to explain this deadly beach hazard, and is working on graphics to better highlight the threat in real time.

During the highly impactful 2020 hurricane season in the United States, there were more fatalities associated with carbon monoxide poisoning from the improper use of generators than there were from storm surge. After that season, NHC and the NWS developed infographics and worked with media and emergency management partners to highlight that threat. While it is difficult to determine the effectiveness of that messaging, it is encouraging to know that there were no carbon monoxide related-fatalities in the aftermath of Hurricane Ian in 2022 in Florida, despite its devastating impacts and widespread power outages in that state.   

NHC relies on relationships with media, emergency management partners, and the entire weather enterprise to help reach the public before, during, and after tropical cyclone threats. These efforts undoubtedly increase awareness, encourage preparation, and save lives. We hope to continue to improve our messaging and understanding of the threats and causes of injuries and fatalities to better meet our collective mission.  

Visit the National Hurricane Center online.

Header photo: Hurricane Gonzalo in the Atlantic. Photo taken by GOES East satellite at 1445Z on October 14, 2014. Photo credit: NOAA.

This post was invited based on a presentation given by Dr. Brennan at the 50th Conference on Broadcast Meteorology, which took place in Phoenix, Arizona, June 21–23, 2023. The conference was organized by the American Meteorological Society Board on Broadcast Meteorology and chaired by Danielle Breezy and Vanessa Alonso.

“People in My Community Rely on Me.”

Broadcast meteorologist Mike Nelson wearing a suit, standing in front of a computer simulation of Colorado with a diagram of the jet stream and the caption labeled "Strong Winds Aloft Racing Over Colorado"

Lessons from Longtime Broadcast Meteorologists

In the third of three posts celebrating the 50th Conference on Broadcast Meteorology, we asked longtime broadcast meteorologists about what it means to do what they do, and their advice for others in the field.

What are some historic weather events you’ve covered, and what did you learn?

“It’s easy to joke with the news anchors and talk about a beautiful 75-degree day. But when severe or extreme weather approaches, the true essence of a broadcast meteorologist’s role is public safety. The first two weeks of 1999 was one of the harshest stretches of winter weather the Detroit area has ever seen, and I was out reporting live [when] people were struggling to get to work… [It was so cold] that roads salted the previous afternoon had an overnight refreeze … I cautioned people [that] if they were the first car at a stop light and it turned green, to pause a moment to make sure that nobody was skidding through the intersection before proceeding through. Later in the day, a viewer e-mailed to tell me that I had directly saved her life … that she was stopped at a light and, when it turned green, was about to hit the accelerator like normal, then remembered what I had said. She put her foot back on the brake. At that moment, a panel truck came barreling across the intersection from the left. Had she proceeded without pausing, she likely would have been broadsided and killed. 

No matter if it’s a severe winter storm, thunderstorm, tornado, hurricane, flash flood, or any other significant natural hazard, our job as broadcast meteorologists is to take the viewers by the hand and help them make informed decisions that could save their lives. Nobody [else] in broadcast media has this responsibility on a daily basis. And there is no greater compliment than when somebody says ‘you saved my life.’”

Paul Gross, AMS Fellow, CCM and CBM

“There have been many historic weather events from Hurricanes Andrew, Fran, and Floyd to numerous tornado outbreaks in Middle Tennessee. The one event that stands out the most is the Great Flood of 2010 that impacted Tennessee with record rainfall totals and historic flooding. Interstates became raging rivers; neighborhoods were submerged in water and even downtown Nashville was flooded with several feet of water coving streets. Over 30 people lost their lives.

From all these events I have learned how much people in my community rely on me for critical information to help them prepare, survive and recover. It’s so important for me to deliver that information in a calm but urgent tone.”

Lisa Spencer, Chief Meteorologist, News4, Nashville, Tennessee
Lisa Spencer and Paul Heggen at WSMV. Photo courtesy of Lisa Spencer

“The Barneveld F-5 Tornado in June 1984 was an early event that I covered. Nine people lost their lives in that terrible storm and it hit at 1 a.m. It had a major impact on me in terms of staying late into the night if necessary to issue warnings. In my St. Louis years, there were often times that I would stay after the late news to cover thunderstorm complexes and not get home until 5 a.m. In Denver, our thunderstorms tend to be in the afternoon and evening – but I have spent many nights here covering blizzards!

Most recently, we had a massive wildfire in December 2021 that destroyed nearly 6,000 buildings just south of Boulder, Colorado. The Marshall Fire was a huge firestorm caused in part by very warm and dry weather – related to climate change. I try to incorporate the climate change connection into my weather reports as often as possible.”

Mike Nelson, Denver7 Chief Meteorologist, KMGH, Denver, Colorado
Mike Nelson covering the Marshall Firestorm in late December 2021. Photo courtesy of Mike Nelson.

What does being a Certified Broadcast Meteorologist mean to you?

“I find great value in the CBM program. I served on the committee to develop the seal program. In addition, I also helped develop the first test and testing guide.

When I see that someone has earned the CBM seal, I know that they have gone through a rigorous test to demonstrate their expertise in the field. Additionally, I am confident in their communication skills knowing their work has been reviewed by a group of experienced peers. CBM seal holders have gone the extra mile to make sure they are equipped to deliver critical weather and science information to their communities.”

Lisa Spencer, Chief Meteorologist, News4, Nashville, Tennessee

“I am CBM number 50, so I have had the designation for a while. The CBM represents the highest level of certification that the AMS can provide to a broadcast meteorologist and it should be held with high esteem. It takes a lot of work to achieve and should merit respect from the TV stations, networks and – most important – the viewer. As CBMs, we have a unique opportunity and responsibility to educate our viewers about weather, science and climate change.”

Mike Nelson, Denver7 Chief Meteorologist, KMGH, Denver, Colorado

What are some lessons you’d like to share with other broadcasters?

“Be active in the community, visit schools, answer all your email, educate the public about climate change. Also, the years go by faster than you will imagine – be sure to plan for your financial future as this business is not getting easier and will never pay as well as it did during my career (sorry)!”

Mike Nelson, Denver7 Chief Meteorologist, KMGH, Denver, Colorado

“Be yourself, be humble, stay focused, set goals and have fun!”

Yolanda Amadeo, Chief Meteorologist, WALB News, Albany, Georgia
Left to right: Bryan Busby, Yolanda Amadeo, and Alan Sealls. Photo courtesy of Yolanda Amadeo.

“From my over-35-year career as a broadcast meteorologist, I have learned the one thing you can count on is change… change in management at all levels, change in responsibilities, and change in the technology and the way we present the weather. But with all those changes we have to remember what we are there for… to serve our communities with the most accurate, informative weather information especially in critical times. When someone recognizes you in public and acts like they know you personally… that’s a good thing. You have made a connection and are welcomed in their home, on the TV or whatever device they are using to watch you. I try to always be gracious.”

Lisa Spencer, Chief Meteorologist, News4, Nashville, Tennessee
Lisa Spencer at work at WSMV 4 (along with, in left photo, Snowbird, a mascot who helps announce snow day school closings in the station’s service area).

About 50Broadcast

The 50th Conference on Broadcast Meteorology took place in Phoenix, Arizona, June 21-23, 2023. It was organized by the American Meteorological Society Board on Broadcast Meteorology and chaired by Danielle Breezy and Vanessa Alonso.

Decades of Innovation in Weather Broadcasting

Mike Nelson, Terry Kelly, and Dr. Richard Daly in the Weather Central newsroom. Photo courtesy of Mike Nelson.

Celebrating the 50th Conference on Broadcast Meteorology

We’re back with the second of three posts highlighting memories from longtime broadcast meteorologists, as we celebrate last month’s 50th Conference on Broadcast Meteorology! Today’s post highlights how the field of broadcast meteorology has evolved over the decades since these meteorologists started out.

“If you told me in 1983 at the beginning of my career that, forty years later, I would hold a portable little computer in my hand that dwarfs the computing capacity of what was in the spacecraft that took astronauts to the moon, watch live radar on that little computer, and then send personal messages with those radar images and warnings to large groups people in seconds, I would have laughed at you. Everybody talks about model and radar improvements that have occurred during this time period, but the development of instantaneous communication of weather information is mind-blowing and has truly benefited the public.”

Paul Gross, AMS Fellow, CCM and CBM
(Left) Paul Gross and colleagues on a trip to Fenway Park during the 2012 AMS Conference on Broadcast Meteorology in Boston, Massachusetts. (Right) Paul Gross in 1984. Photos courtesy of Paul Gross.

“During my first internship at WMC in Memphis in the early 1980s, the station was still using a magnetic surface map during their weathercast. Of course, now we use augmented reality graphics. Forecasting in the 1980s when I started my career consisted of large printed surface maps and spaghetti charts; we would use colored pencils to make analysis. Now everything is available online and from multiple sources.

“When I first started attending AMS Broadcast Conferences in the early 1990s, Bryan Busby (KMBC-TV) and I had a running joke where we greeted each other as “the other Black guy,” because we were the only two African-Americans there. I am thrilled to see the growth in diversity in our field and our conferences over the decades, to where we can’t say that anymore!”

Alan Sealls, AMS Fellow, CBM, Past Seal Board Chair
Photo from the 33rd Conference on Broadcast Meteorology, in New Orleans in 2004. Pictured from left to right: David Tillman, Lisa Mozer, Bryan Busby, Gene Norman, Alan Sealls, and Yolanda Amadeo. Photo courtesy of Alan Sealls.

“I can remember having 5 p.m., 6 p.m., and 10 p.m. newscasts. I was responsible for one 3 ½-minute weathercast during each news show and maybe updating a phone line forecast. Now, I have a 3 p.m., 4 p.m., 5 p.m., 6 p.m., 6:30 p.m., and 10 p.m. newscasts with not only a generally 3-minute weathercast, but usually a first weather and teases. In addition, I am responsible for updating weather forecasts on a phone line, for radio, multiple social media platforms, the website and streaming service.”

Lisa Spencer, Chief Meteorologist, News4, Nashville, Tennessee

Photo courtesy of Lisa Spencer.

“I started in Seattle in 1971… the satellite images used on the air at KING-TV were single 4×5-inch B&W Polaroids taken at the local NWS office, a 10-minute drive downtown.

Stumping Bryan Gumbel and Jane Pauley with weather science on NBC’s TODAY in the ’80s was always fun, especially demonstrating the shape of rain drops by creating air bubbles in a 6-foot-tall clear plastic tube of Karo syrup (a sticky clean-up.)”

Joe Witte, Climate Outreach Specialist, Aquent, Pasadena, California

“I started my career at WKOW-TV in Madison, WI in 1976. … My first job was to erase the weather boards and help draw weather maps that would be used [by Terry Kelly, President of Weather Central, in his] weather reports. These maps were hand-drawn on lightweight cardboard and were then taped to the wall of the studio in a series of 5-6 maps. The cameraman (there were few women camera operators back then) would pan from left to right across the series of maps to help tell the story. If the masking tape let go, the map would fall to the floor – the viewers were certainly startled to see that! Making these maps took many hours and it was nearly impossible to change the map if the weather changed.

Paper weather maps. Photo courtesy of Mike Nelson.

In 1979, Terry Kelly teamed up with some computer scientists at The UW Space Science and Engineering Department to create the Apple II Weather System which became one of the first TV Weather Computer Systems. … My job in the late 1970s through the mid-1980s was to travel around the country to install the various generations of these computers and train the meteorologists in this new technology. I installed over 50 units during this time and had the honor of meeting and training many of the legends of our industry such as Al Roker, Don Kent, Gary England, Bruce Schwoegler, Bob Copeland, Harry Volkman, Dick Albert, George Winterling, and Valerie Collins. It was truly an amazing time as the computer systems were rapidly changing and the competition between computer companies was intense!”

Right image: Mike Nelson with the Apple II Weather System. Photo courtesy of Mike Nelson.

Mike Nelson, Denver7 Chief Meteorologist, KMGH, Denver, Colorado

(Clockwise from left) Gary England, Don Kent, Dick Albert, and George Winterling. Photos courtesy of Mike Nelson.

“[My] first TV job was with the old WGAN-TV in Portland, Maine, as the first meteorologist on staff… [It] entailed washing down the regional and national weather maps–floor-to-ceiling and made of linoleum, and covered with the tempera-marker info from the night before. Mop-and-bucket work was just part of the shift. Paper weather maps, magnetic suns and moons, and air-brushed clouds followed before actual digital graphics arrived.

As a broadcast meteorologist back then, one had to be proficient in more than forecasting. Changing out helixes in the fax machine, repairing the teletype (without sending 72 volts through your body), changing toner in the satellite receiver, and unending paper cuts were all part of your day.”

Dr. Lou McNally, Former President, AMS Boston Chapter

Dr. Lou McNally at WIVB in Buffalo, circa 1983, with magnetic baseman.
Photo courtesy of Dr. McNally.

Photo at top of post: Mike Nelson, Terry Kelly, and Dr. Richard Daly in the Weather Central newsroom. Photo courtesy of Mike Nelson.


About 50Broadcast

The 50th Conference on Broadcast Meteorology took place in Phoenix, Arizona, June 21-23, 2023. It was organized by the American Meteorological Society Board on Broadcast Meteorology and chaired by Danielle Breezy and Vanessa Alonso.

When Wildfires Know No Boundaries, Scientists Must Cross Disciplines

The U.S. Capitol building viewed from afar during the wildfire smoke event on June 7, 2023. Photo courtesy of Natasha Dacic.

Takeaways from the AMS Summer Policy Colloquium

Guest post by Natasha Dacic, PhD Candidate at the University of Michigan

The western part of the United States continually suffers from wildfires and smoke every year, but in early June, regions of the Midwest and eastern parts of the country experienced unhealthy air quality as smoke from Canadian wildfires was transported into these regions. Cities like Washington, D.C., experienced some of the worst air quality levels in recent years. The smoke that engulfed the capital was a stark reminder that events like wildfires have far-reaching consequences.

I began to wonder if policymakers would be more attuned to the urgency for climate action now that the Nation’s Capital was experiencing some of the consequences that could become more prevalent in the near future. Coincidentally, I was in D.C. that week for the AMS Summer Policy Colloquium, and I had the opportunity to hear policymakers and federal officials comment on the wildfire smoke and how it pertains to the science policy they work on. 

As a scientist passionate about the intersection of climate and policy, the Summer Policy Colloquium was an enlightening experience for me. It brought together federal officials and Congressional staffers from various disciplines to discuss their career journeys, responsibilities, and pressing environmental issues. Several science policy experts commented on air quality and the broader implications of wildfires, recognizing that these are not isolated incidents but rather a component of a larger system affected by climate change and human activities, and not limited to a single country or region. Wildfires, driven by extreme heat, droughts, and other climate-related factors, have become increasingly common and devastating worldwide. 

In response to questions addressing the poor air quality, speakers emphasized the need for collaborative efforts between scientists, policymakers, and communities to tackle these complex challenges. The co-production of knowledge emerged as a theme throughout these discussions, and it quickly became evident that policymakers rely on expert knowledge and active participation of interested parties from various sectors in order to craft effective policy. This is one important way scientists can get involved.

Natasha Dacic (black shirt) and peers discussing policy issues at the AMS 2023 Summer Policy Colloquium. Photo: AMS staff.

As I listened to these conversations, I couldn’t help but reflect on my own work and the importance of co-production of knowledge in addressing environmental issues. I worked with a group of faculty and students in the Department of Climate and Space Sciences and Engineering at the University of Michigan to develop a pilot course to provide hands-on experience engaging with local communities. Many geoscience academic departments do not mandate this type of coursework–yet I believe that as scientists, it is essential for us to engage not only in research but also in the application of our knowledge. The Summer Policy Colloquium served as a reminder that we have a responsibility to communicate our findings to policymakers, advocate for evidence-based decision-making, and work hand in hand with communities affected by these environmental challenges.

The colloquium also highlighted the importance of academia and scientists being more active in applying their knowledge to real-world problems. While research and publication are important, they must be accompanied by active engagement with policymakers and communities to ensure that scientific findings translate into meaningful action. By actively participating in the policy-making process, scientists can contribute their expertise and help shape policies that address all aspects of science and more importantly, climate change.

Photo at top: The U.S. Capitol building viewed from afar during the wildfire smoke event on June 7, 2023. Photo courtesy of Natasha Dacic.


About the AMS Summer Policy Colloquium

The AMS Summer Policy Colloquium provides an overview of policy basics and decision-making in the earth and atmospheric sciences, along with opportunities to meet and dialogue with federal officials, Congressional staffers, and other decision-makers. Aimed at early and mid-level federal managers, scientists, private-sector executives, university faculty, and selected graduate students and fellows, the Colloquium helps participants build skills and contacts, gauge interest in science policy and program leadership, and explore selected issues in depth. View the 2023 SPC agenda here [PDF].