“Decision-making under meteorological uncertainty” for D-Day’s Famous Forecast

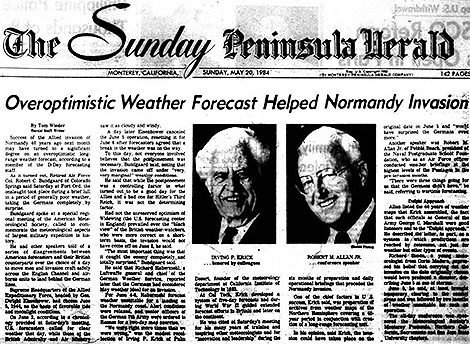
The success of the D-Day Invasion of Normandy was due in part to one of history’s most famous weather forecasts, but new research shows this scientific success resulted more from luck than skill. Oft-neglected historical documentation, including audio files of top-secret phone calls, shows the forecasters were experiencing a situation still researched and practiced today: “decision-making under meteorological uncertainty.”

New research recently published in BAMS into that weather forecast for June 6, 1944, which enabled the Allies in World War II to gain a foothold in Europe, answers questions about three popular perceptions: were the forecasts, which predicted a break in the weather, that good? were the German meteorologists so ill-informed, missing that weather-break? and was the American analog system for prediction so great and better than what the Germans had?

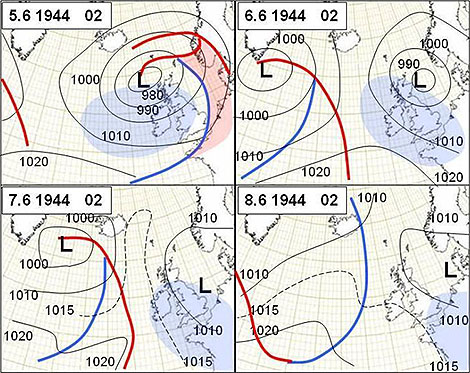
The “alleged” weather break

An expected ridge and fair weather between two areas of low pressure, one departing and one arriving over the area, didn’t materialize. The departing low instead lingered and created a lull in visibility and lifted the cloud ceiling height, but it didn’t slow winds much. They blew at Force 4-5 (~13-24 mph), creating very choppy seas that sickened many troops prior to the invasion.

Synoptic analyses at 00 UTC from 5 to 8 June 1944. The low that was supposed to move northeast to southern Norway remained over the North Sea for some days. On 6 and 8 June the observed winds in the Channel were force 4 and occasionally force 5.
Synoptic analyses at 00 UTC from June 5-8, 1944. The low that was supposed to move northeast to southern Norway remained over the North Sea for some days.


A blown German Forecast?

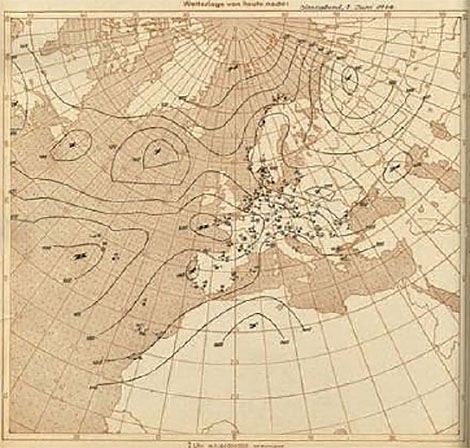
Because the invasion came as a complete surprise to the Germans it has been surmised their weather forecast for June 6 had to be bad. German forecasters prior to the war were the best at “extended” forecasts, and their synoptic maps and forecast for that day were more realistic than the Allies, with a less optimistic speculation of any break in the weather.

The German's European-Atlantic map at 00 UTC June 6, 1944, where the analysis over the North Atlantic appears not to be based on observations but intercepted American coded analyses.
The German’s European-Atlantic map at 00 UTC June 6, 1944, where the analysis over the North Atlantic appears not to be based on observations but intercepted American coded analyses.


A historically debated forecast

The analog weather prediction system employed by the Allies for the invasion was claimed by its creators to have correctly identified the weather break. But historical analysis and review doesn’t bear this out. What it does find, though, is that the system correctly identified a transition from zonal to meridional flow, which delivered the break the Allies needed for success. History’s finding: The forecast was “Overoptimistic.”

The 1984 Fort Ord meeting about the D-Day forecast got coverage in the local Monterey newspapers. The invasion was said to have occurred in a "break" or a period of a "brief lull" in the weather.
The 1984 Fort Ord, California, AMS meeting about the D-Day forecast got coverage in the local Monterey newspapers. The American forecasting group was led by Lt. Col. (Dr.) Irving Krick of Caltech. The president of the Naval Post Graduate School, Robert Allen, Jr., at the time an Air Force officer conducting high-level weather briefings at the Pentagon, also spoke at the meeting.


As a lesson learned from this most famous of weather forecasts, the paper’s author, Anders Persson of Swedin’s Uppsala University, concludes:

It was 75[+] years ago and the observational coverage has improved tremendously since then, both qualitatively and quantitatively. Our understanding of the atmosphere is much better,and the forecast methods have reached a standard that could hardly have been dreamt of in 1944. However, there’s one element that has a familiar ring to it and is of great interest today. That is when Air Marshall Tedder [Deputy Supreme Commander of the Invasion under General Eisenhower] asks about an assessment of the confidence in the forecast he has just heard … This illustrates that the D-day forecast is a significant early example of decision-making under meteorological uncertainty.

COVID-19 and the Weather, Water, and Climate Enterprise

by Mary Glackin, AMS President

In normal times, our thousands of AMS professionals and colleagues are completely dedicated to helping people make the best possible weather-, water-, and climate-related decisions. In this COVID-19 period, were not just providing critical information; we are also receiving it. We are each of us following guidance from public health experts and local officials so that we can keep ourselves, our families, and our friends safe and well. We’re joining in the national and global efforts to “flatten the curve.”

amsseal-blueWe all continue to work, but these duties are now competing with new ones: caring for children who would normally be in school, searching for basic necessities that would routinely be in stock on supermarket shelves, protecting elderly friends and family members. With campuses and laboratories shut down, professors and students have scrambled to adjust to online teaching and reimagining plans for field experiments. Nonetheless, critical weather and hydrologic services are provided with sharp eyes for spring floods and convective weather. Preparations for the coming hurricane season are moving forward.

COVID-19 doesn’t “slightly tweak” the task of building a Weather-Ready Nation; it completely rearranges the landscape. Goals of shelter-in-place and evacuation have to be reconfigured for a world where we are advised by health experts to maintain physical separation from others—more than a challenge in a communal evacuation center.

COVID-19 provides a unique learning opportunity for all of us in the Enterprise. We can experience firsthand how even the best-intended top-down risk communication can sound to someone in harm’s way—and step up our own communications accordingly.

Finally, it’s worth noting as AMS embarks on its second century that our founding coincided with the 1918-19 influenza pandemic. The link between weather, water, climate, and public health (enshrined in the AMS seal) has been integral to building a sustainable and resilient world, and it will likely play a larger role in the future.

Thank you for maintaining essential services and supporting research and education during such a critical, difficult time. Stay well, and stay safe—and at the same time, stay focused, on our contributions to a safer, healthier world.

AMS's New Culture and Inclusion Cabinet

by Keith L. Seitter, CCM, AMS Executive Director
One of the AMS Core Values is: “We believe that a diverse, inclusive, and respectful community is essential for our science.”
AMS lives this value, which is articulated in the Centennial Update to the AMS Strategic Goals. We work to foster a culture that celebrates our diversity, strives for equity in all we do, and encourages inclusion across all activities so that everyone can experience a sense of belonging in the Society.
To formalize these efforts and provide a clearer path for providing resources toward them, the Council approved the creation of a new entity in AMS in fall 2019. At its meeting this past January, the Council approved the terms of reference for this new component of the Society’s structure and that Dr. Melissa Burt would serve as its first chair. This Culture and Inclusion Cabinet (CIC) has the following charge:

To accelerate the integration of a culture of inclusion, belonging, diversity, equity, and accessibility across the AMS and evaluate and assess progress towards culture and inclusion strategic goals within the Society. Meaningful integration into all areas and components of the AMS will require time and sustained effort. Fully integrating diversity, equity, inclusion, and belonging (DEIB) will result in an organizational culture that is accessible, advances science, serves society, and is responsive to social justice.

The Council designates this new body as a “Cabinet” to reinforce that it is not quite like any of the other entities making up the volunteer structure of the Society (council, commission, board, committee, task force, etc.). The CIC will play a unique role and therefore was given a unique name.
The CIC sits at the highest level of the organizational structure for AMS save the Council itself, to which it reports directly. Being at this level it can more readily ensure that issues of diversity, equity, inclusion, accessibility, social justice, and belonging are addressed throughout all AMS programs and activities.
The CIC does not replace any of the other components of the Society that work in these arenas—most notably the Board on Women and Minorities (BWM), which has a long record of addressing equity and inclusion issues in AMS. The BWM will continue to oversee specific programs aimed at diversity, equity, and inclusion, and will likely expand its role in AMS programs as the CIC helps integrate those efforts more broadly in the Society.
AMS has a strong record of addressing diversity and equity issues and a culture of inclusivity that other organizations could learn from. The creation of the CIC builds on those strengths and puts AMS in a position of leadership among scientific organizations in elevating these issues to the highest levels so that they can be threaded through every program in foundational ways.
For many of us, the sense of belonging in AMS is an important part of what makes the Society so special, and we want everyone in the community to feel that sense of belonging as an intrinsic aspect of the AMS culture. I am confident the new Culture and Inclusion Cabinet will take us there and will assist our entire community in creating an even more inclusive environment—strengthening our enterprise in the process.

AMS’s New Culture and Inclusion Cabinet

by Keith L. Seitter, CCM, AMS Executive Director

One of the AMS Core Values is: “We believe that a diverse, inclusive, and respectful community is essential for our science.”

AMS lives this value, which is articulated in the Centennial Update to the AMS Strategic Goals. We work to foster a culture that celebrates our diversity, strives for equity in all we do, and encourages inclusion across all activities so that everyone can experience a sense of belonging in the Society.

To formalize these efforts and provide a clearer path for providing resources toward them, the Council approved the creation of a new entity in AMS in fall 2019. At its meeting this past January, the Council approved the terms of reference for this new component of the Society’s structure and that Dr. Melissa Burt would serve as its first chair. This Culture and Inclusion Cabinet (CIC) has the following charge:

To accelerate the integration of a culture of inclusion, belonging, diversity, equity, and accessibility across the AMS and evaluate and assess progress towards culture and inclusion strategic goals within the Society. Meaningful integration into all areas and components of the AMS will require time and sustained effort. Fully integrating diversity, equity, inclusion, and belonging (DEIB) will result in an organizational culture that is accessible, advances science, serves society, and is responsive to social justice.

The Council designates this new body as a “Cabinet” to reinforce that it is not quite like any of the other entities making up the volunteer structure of the Society (council, commission, board, committee, task force, etc.). The CIC will play a unique role and therefore was given a unique name.

The CIC sits at the highest level of the organizational structure for AMS save the Council itself, to which it reports directly. Being at this level it can more readily ensure that issues of diversity, equity, inclusion, accessibility, social justice, and belonging are addressed throughout all AMS programs and activities.

The CIC does not replace any of the other components of the Society that work in these arenas—most notably the Board on Women and Minorities (BWM), which has a long record of addressing equity and inclusion issues in AMS. The BWM will continue to oversee specific programs aimed at diversity, equity, and inclusion, and will likely expand its role in AMS programs as the CIC helps integrate those efforts more broadly in the Society.

AMS has a strong record of addressing diversity and equity issues and a culture of inclusivity that other organizations could learn from. The creation of the CIC builds on those strengths and puts AMS in a position of leadership among scientific organizations in elevating these issues to the highest levels so that they can be threaded through every program in foundational ways.

For many of us, the sense of belonging in AMS is an important part of what makes the Society so special, and we want everyone in the community to feel that sense of belonging as an intrinsic aspect of the AMS culture. I am confident the new Culture and Inclusion Cabinet will take us there and will assist our entire community in creating an even more inclusive environment—strengthening our enterprise in the process.

Snowflake Selfies as Meteo Teaching Tools

Undergrads at Penn State recently took to their cellphones to mingle with and snap pics of tiny snowflakes to reinforce meteorological concepts. The class, called “Snowflake Selfies” and described in a new paper in BAMS, was designed to use low-cost, low-tech methods that can be widely adapted at other institutions to engage students in hands-on field research.

In addition to photographing snow crystals, students measured snowfall amounts and snow-to-liquid ratios, and then gained meteorological insight into the observations using radar data and thermodynamic soundings. The goal of the course was to reinforce concepts from their other undergraduate meteorology courses, such as atmospheric thermodynamics, cloud physics, and radar and mesoscale meteorology.

As a writing intensive course at Penn State that meets the communication skills requirement of the AMS guidance for a Bachelor’s Degree in Atmospheric Science, “Snowflake Selfies” also was designed to help students communicate meteorological science. Students shared their observations with the local National Weather Service office in State College and also wrote up their work in term papers and presented their pics and findings to the class.

Snow crystal photographs taken by students in the "Snowflake Selfies" class.
Snow crystal photos taken by students in the “Snowflake Selfies” class.


Of course to have such a class, you need snow, and “the relative lack of snowfall events during the observational period” in winter 2018 was definitively a challenge for students, the BAMS paper states. Pennsylvania’s long winters often see many opportunities to photograph snow, but the course creators caution that perhaps a longer observational period is needed in case nature doesn’t cooperate. It also would allow students enough time to closely observe snowflakes while juggling their other classes and activities.

A survey conducted at the end of the class found that “Snowflake Selfies” was well received by students, engaging them and encouraging their introduction to field science. And they “strongly agreed [it] helped reinforce their understanding of cloud physics and physical meteorology compared to” a previous such course where students designed, built, and deployed their own 3-D printed rain gauges to measure precipitation.

Actually, that previous course sounds like a lot of fun, too!

Observations without Fear: NOAA's Drones for Hurricane Hunting

Nowhere is it more dangerous to fly in a hurricane than right near the roiling surface of the ocean. These days, hurricane hunting aircraft wisely steer clear of this boundary layer, but as a result observations at the bottom of the atmosphere where we experience storms are scarce. Enter the one kind of plane that’s fearless about filling this observation gap: the drone.
NOAA’s hurricane hunter aircraft in recent storms has been experimenting with launching small unmanned aircraft systems (sUAS) into raging storms–and these devices show promise for informing advisories as well as improving numerical modeling.

Lead author Joe Cione of NOAA's hurricane research division holds a Coyote sUAS. The drones are being launched into hurricanes from the P-3 hurricane hunter aircraft in the background.
Lead author of a new paper in BAMS, Joe Cione of NOAA’s Hurricane Research Division, holds a Coyote sUAS. The drones are being launched into hurricanes from the WP-3D Orion hurricane hunter aircraft in the background.

 
The observations were made by a new type of sUAS, described in a recently published paper in BAMS, called the Coyote that flew below 1 km in hurricanes. Sampling winds, temperature, and humidity in this so-called planetary boundary layer (PBL), the expendable Coyotes flew as low as 136 m in wind speeds as high as 87 m s-1 (196 mph) and for as long as 40 minutes before crashing (as intended) into the ocean.
In the BAMS article, Joe Cione at al. describe the value of and uses for the low-level hurricane observations:

Such high-resolution measurements of winds and thermodynamic properties in strong hurricanes are rare below 2-km altitude and can provide insight into processes that influence hurricane intensity and intensity change. For example, these observations—collected in real time—can be used to quantify air-sea fluxes of latent and sensible heat, and momentum, which have uncertain values but are a key to hurricane maximum intensity and intensification rate.

Highs-lows
Coyote was first deployed successfully in Hurricane Edouard (2014) from NOAA’s WP-3 Orion hurricane hunter aircraft. Recent Coyote sUAS deployments in Hurricanes Maria (2017) and Michael (2018) include the first direct measurements of turbulence properties at low levels (below 150 m) in a hurricane eyewall. In some instances the data, relayed in near real-time, were noted in National Hurricane Center advisories.
Turbulence processes in the PBL are also important for hurricane structure and intensification. Data collected by the Coyote can be used to evaluate hurricane forecasting tools, such as NOAA’s Hurricane Weather Research and Forecasting (HWRF) system. sUAS platforms offer a unique opportunity to collect additional measurements within hurricanes that are needed to improve physical PBL parameterization.

Coyote launch sequence: (a) Release in a sonobuoy canister from a NOAA P-3. (b) A parachute slows descent. (c) The canister falls away and the Coyote wings and stabilizers deploy. The main wings and vertical stabilizers have no control surfaces; rather, elevons (i.e., combined elevator and aileron) are on the rear wings, controlled by the GPS-guided Piccolo autopilot system with internal accelerometers and gyros. (d) After the Coyote is in an operational configuration, the parachute releases. (e) The Coyote levels out after starting the electric pusher motor, which leaves minimally disturbed air for sampling at the nose. The cruising airspeed is 28 m s-1. (f) The Coyote attains level flight and begins operations. When deployed, the Coyote’s wingspan is 1.5 m and its length is 0.9 m. The 6-kg sUAS can carry up to 1.8 kg. Images were captured from a video courtesy of Raytheon Corporation.
Coyote launch sequence: (a) Release in a sonobuoy canister from a NOAA P-3. (b) A parachute slows descent. (c) The canister falls away and the Coyote wings and stabilizers deploy. The main wings and vertical stabilizers have no control surfaces; rather, elevons (i.e., combined elevator and aileron) are on the rear wings, controlled by the GPS-guided Piccolo autopilot system with internal accelerometers and gyros. (d) After the Coyote is in an operational configuration, the parachute releases. (e) The Coyote levels out after starting the electric pusher motor, which leaves minimally disturbed air for sampling at the nose. The cruising airspeed is 28 m s-1. (f) The Coyote attains level flight and begins operations. When deployed, the Coyote’s wingspan is 1.5 m and its length is 0.9 m. The 6-kg sUAS can carry up to 1.8 kg.
Images were captured from a video courtesy of Raytheon Corporation.

 
The authors write that during some flights instrument challenges occurred. For example:

thermodynamic data were unusable for roughly half of the missions. Because the aircraft are not recovered following each flight, the causes of these issues are unknown. New, improved instrument packages will include a multi-hole turbulence probe, improved thermodynamic and infrared sensors, and a laser or radar altimeter system to provide information on ocean waves and to more accurately measure the aircraft altitude.

Future uses of the sUAS could include targeting hurricane regions for observations where direct measurements are rare and models produce large uncertainty. Meanwhile, the article concludes, efforts are underway to increase sUAS payload capacity, battery life, and transmission range so that the NOAA P-3 need not loiter nearby.

Observations without Fear: NOAA’s Drones for Hurricane Hunting

Nowhere is it more dangerous to fly in a hurricane than right near the roiling surface of the ocean. These days, hurricane hunting aircraft wisely steer clear of this boundary layer, but as a result observations at the bottom of the atmosphere where we experience storms are scarce. Enter the one kind of plane that’s fearless about filling this observation gap: the drone.

NOAA’s hurricane hunter aircraft in recent storms has been experimenting with launching small unmanned aircraft systems (sUAS) into raging storms–and these devices show promise for informing advisories as well as improving numerical modeling.

Lead author Joe Cione of NOAA's hurricane research division holds a Coyote sUAS. The drones are being launched into hurricanes from the P-3 hurricane hunter aircraft in the background.
Lead author of a new paper in BAMS, Joe Cione of NOAA’s Hurricane Research Division, holds a Coyote sUAS. The drones are being launched into hurricanes from the WP-3D Orion hurricane hunter aircraft in the background.


The observations were made by a new type of sUAS, described in a recently published paper in BAMS, called the Coyote that flew below 1 km in hurricanes. Sampling winds, temperature, and humidity in this so-called planetary boundary layer (PBL), the expendable Coyotes flew as low as 136 m in wind speeds as high as 87 m s-1 (196 mph) and for as long as 40 minutes before crashing (as intended) into the ocean.

In the BAMS article, Joe Cione at al. describe the value of and uses for the low-level hurricane observations:

Such high-resolution measurements of winds and thermodynamic properties in strong hurricanes are rare below 2-km altitude and can provide insight into processes that influence hurricane intensity and intensity change. For example, these observations—collected in real time—can be used to quantify air-sea fluxes of latent and sensible heat, and momentum, which have uncertain values but are a key to hurricane maximum intensity and intensification rate.

Highs-lows

Coyote was first deployed successfully in Hurricane Edouard (2014) from NOAA’s WP-3 Orion hurricane hunter aircraft. Recent Coyote sUAS deployments in Hurricanes Maria (2017) and Michael (2018) include the first direct measurements of turbulence properties at low levels (below 150 m) in a hurricane eyewall. In some instances the data, relayed in near real-time, were noted in National Hurricane Center advisories.

Turbulence processes in the PBL are also important for hurricane structure and intensification. Data collected by the Coyote can be used to evaluate hurricane forecasting tools, such as NOAA’s Hurricane Weather Research and Forecasting (HWRF) system. sUAS platforms offer a unique opportunity to collect additional measurements within hurricanes that are needed to improve physical PBL parameterization.

Coyote launch sequence: (a) Release in a sonobuoy canister from a NOAA P-3. (b) A parachute slows descent. (c) The canister falls away and the Coyote wings and stabilizers deploy. The main wings and vertical stabilizers have no control surfaces; rather, elevons (i.e., combined elevator and aileron) are on the rear wings, controlled by the GPS-guided Piccolo autopilot system with internal accelerometers and gyros. (d) After the Coyote is in an operational configuration, the parachute releases. (e) The Coyote levels out after starting the electric pusher motor, which leaves minimally disturbed air for sampling at the nose. The cruising airspeed is 28 m s-1. (f) The Coyote attains level flight and begins operations. When deployed, the Coyote’s wingspan is 1.5 m and its length is 0.9 m. The 6-kg sUAS can carry up to 1.8 kg. Images were captured from a video courtesy of Raytheon Corporation.
Coyote launch sequence: (a) Release in a sonobuoy canister from a NOAA P-3. (b) A parachute slows descent. (c) The canister falls away and the Coyote wings and stabilizers deploy. The main wings and vertical stabilizers have no control surfaces; rather, elevons (i.e., combined elevator and aileron) are on the rear wings, controlled by the GPS-guided Piccolo autopilot system with internal accelerometers and gyros. (d) After the Coyote is in an operational configuration, the parachute releases. (e) The Coyote levels out after starting the electric pusher motor, which leaves minimally disturbed air for sampling at the nose. The cruising airspeed is 28 m s-1. (f) The Coyote attains level flight and begins operations. When deployed, the Coyote’s wingspan is 1.5 m and its length is 0.9 m. The 6-kg sUAS can carry up to 1.8 kg.
Images were captured from a video courtesy of Raytheon Corporation.


The authors write that during some flights instrument challenges occurred. For example:

thermodynamic data were unusable for roughly half of the missions. Because the aircraft are not recovered following each flight, the causes of these issues are unknown. New, improved instrument packages will include a multi-hole turbulence probe, improved thermodynamic and infrared sensors, and a laser or radar altimeter system to provide information on ocean waves and to more accurately measure the aircraft altitude.

Future uses of the sUAS could include targeting hurricane regions for observations where direct measurements are rare and models produce large uncertainty. Meanwhile, the article concludes, efforts are underway to increase sUAS payload capacity, battery life, and transmission range so that the NOAA P-3 need not loiter nearby.

The Perils of Rime Mushrooms

Mountain climber Dmitry Golovchenko captured tremendous video of the February 27 collapse of a “rime mushroom” atop Patagonia’s Cerro Torre. These are bulbs of massively accumulated rime—built up in the freezing of moisture in winds pounding at the peak over time. The mushrooms increase the difficulty of this infamous climb of more than 3,000 meters, but never more so than when their precariousness increases in summer—just when conditions might otherwise seem calm enough for climbing. Here is the video via an Instagram from patagoniavertical, the site of Rolando Garibotti, who co-authored a BAMS article on these infamous mushroom features:


View this post on Instagram

CERRO TORRE – Escarcha escrachadora / Crushing rime. . Esto sucedió el 27 de febrero a las 11:25am. Si hubiese habido cordadas en la Via dei Ragni, las consecuencias hubiesen sido gravísimas. El video y las fotos las tomó @golovchenko.dmitry, el conocido alpinista ruso. . Los factores que influencian la rotura de los hongos de escarcha son desconocidos, pero parece probable que se comporten como un manto de nieve, y que la combinación de gravedad, calor y humedad, puedan llevar a este tipo de ocurrencias. Esta temporada hay mucha escarcha, que con el calor veraniego, y lluvia en altura, pueden haber sido el disparador. No sabiendo cuales son los factores que afectan las capas profundas de los hongos, es difícil hipotetizar un protocolo, pero parece razonable evitar periodos con la isoterma zero por encima del pie de vía (2300m), o periodos posteriores a lluvia en altura. . Del link en nuestro perfil se puede bajar un artículo sobre la formación de la escarcha en la montaña, publicado en el boletín del American Meteorological Society, escrito por Dave Whiteman, con ayuda de quien escribe. . . . This happened on February 27th, at 11:25am. Had there been any parties on the Ragni Route, the consequences would have been serious. The video and images were shot by @golovchenko.dmitry, the well-known Russian alpinist. . The factors that influence rime mushrooms to result in break off are not known, but it seems plausible that they behave in part like a snowpack, and that the combination of gravity, heat and moisture can result in events like this one. This summer there is ample rime, which combined with heat, and rain at higher altitudes could have lead to this. Not knowing what factors affect the deeper layers of rime mushrooms, it is difficult to hypothesize a protocol to minimize exposure, but avoiding periods with the freezing-line above the base of the route (2300m) would be a wise first step. . Link in our profile to an article about rime formation in the mountains published in the Bulletin of the American Meteorological Society, written by Dave Whiteman, with help from yours truly. . #rime #cerrotorre #patagonia #chalten

A post shared by Patagonia Vertical – guidebook (@patagoniavertical) on


In their BAMS article, David Whiteman and Garibotti introduced rime mushrooms, well known to alpinists, but not previously to many meteorologists:

Rime mushrooms, commonly called ice mushrooms, build up on the upwind side of mountain summits and ridges and on windward rock faces. These large, persistent, rounded or bulbous accretions of hard rime range from pronounced mounds to towering projections with overhanging sides….[They] form when clouds and strong winds engulf the terrain. Supercooled cloud droplets are blown onto subfreezing surfaces and freeze rapidly, making an opaque “hard” rime with air trapped between granular deposits. The mushrooms are most frequent and best developed on isolated summits and exposed ridges in stormy coastal areas.

They showed the distribution of these mountain features around the world.

mushroomsThanks to Dr. Whiteman’s Univ. of Utah colleague Jim Steenburgh for bringing the video to our attention via social media. Jim’s own newly published BAMS article features the often well-rimed sea-effect snows of Japan and their similarities to lake-effect snows in the United States. The article explains how the heavy snowy accumulations of crunchy graupel (loose, rimed, large icy particles) in lowlands of the Japanese coast can be quite avalanche prone, too.

Scratch that Cat: Revising the Saffir-Simpson Scale

British adult orange cat and little kitten
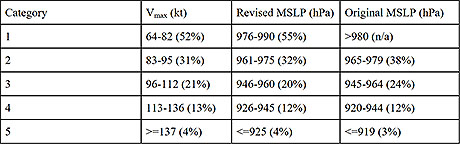
In recent years minimum sea level pressure (MSLP) measured in a hurricane’s eye has become “a much better predictor of hurricane damage” than the maximum sustained wind speed (Vmax) upon which the revered Saffir-Simpson hurricane wind scale is based.

New research by seasonal hurricane forecaster Phil Klotzbach et al. finds that MSLP is also more accurately measurable than Vmax, “making it an ideal quantity for evaluating a hurricane’s potential damage.”

Given that the Saffir-Simpson scale was developed to characterize the risk of hurricanes to the public, we propose classifying hurricanes in the future using MSLP as opposed to Vmax. While no scale will ever perfectly account for the totality of storm risk to life and property (e.g., inland flooding), any improvements to better explain and warn the potential hurricane impacts to an increasingly vulnerable coastal and inland population is, in our view, a worthwhile endeavor.

Klotzbach et al. argue that Vmax is “nearly impossible to measure directly” as the maximum wind mentioned in advisories issued by the National Hurricane Center is the highest 1 minute sustained surface wind occurring “in an unobstructed exposure; (i.e., not blocked by buildings or trees),” which is essentially at sea, not over land. Even with today’s technology, the sparsely observed maximum wind speed is often just an estimate–even land observations are limited by anemometer failure at speeds over 50 kt.

In contrast, MSLP is easy to locate at the storm’s center and is routinely measured by the hurricane hunters in every aircraft reconnaissance mission.

Earlier versions of the Saffir-Simpson scale, created in the early 1970s by engineer Herb Saffir and meteorologist and Hurricane Center director Bob Simpson, incorporated MSLP as a proxy for wind, and they also included ranges by category of storm surge height. But these led to public confusion when actual storm surges and low pressure readings didn’t match up with the categorized winds, and they were removed in 2012.

 Vmax …provides less information on the overall storm risk to life and property than does MSLP. MSLP, on the other hand, is a useful metric in that it is strongly correlated with both Vmax and storm size, which is directly related to storm surge as well as a larger wind and rain footprint. The risk to human life is also more directly correlated to MSLP than to Vmax, given the better relationship of MSLP with storm size. MSLP was a more skillful predictor of fatalities caused by CONUS landfalling hurricanes from 1988-2018 than was Vmax. Consequently, we recommend that more emphasis be placed on MSLP when assessing the potential risks from future landfalling hurricanes.

Saffir-Simpson Hurricane Scale with current Vmax criteria, proposed MSLP criteria and original MSLP criteria from Simpson (1974). Also provided in parentheses are the percentage of Atlantic storms from 1979-2018 whose lifetime maximum intensity exceeded the weakest intensity criteria for each category threshold.


The difference between using MSLP and Vmax when predicting damage potential has become more noticeable in recent years. This is “likely due to larger-sized hurricanes such as Ike (2008) and Sandy (2012) which did much more damage than would be typically associated with hurricanes making landfall at Category 2 and Category 1 intensity, respectively.” Both storms had much larger storm surges than their category rankings suggested, as did Hurricane Katrina, which was Category 3 at landfall based on Vmax, but had a MSLP equivalent to a Category 5. Its storm surge was measured at a record 28 feet and the resulting damage was catastrophic, consistent with a Cat 5 hurricane.

Using MSLP to re-categorize some historic hurricanes at landfall, the study finds the following:

  • Hurricane Katrina (2005) would go from a Cat 3 to Cat 5;
  • Superstorm Sandy, which was post-tropical but considered “just” a Cat 1 when it made landfall in 2012, would rank as a Cat 4.
  • Hurricane Ike (2008) would be elevated from a Cat 2 to a Cat 3.
  • Hurricane Michael (2018) would have been Cat 5 at landfall rather than a high-end Cat 4 stated in advisories.

The new BAMS paper is available as an Early Online Release. It will be adapted for print and published in the February issue.

"Megaflashes": How Long Can a Lightning Discharge Be?

Even though Earth’s atmosphere is laced by more than a billion brilliant discharges of electricity every year, lightning itself never seems ordinary. But there’s a broad range of lightning, and sometimes, at the extreme, it’s possible to recognize a difference between the ordinary and amazing, even among lightning flashes. The challenge is finding and observing such extremes.
New research by Walt Lyons and colleagues, published in BAMS, reports such a perspective-altering observation of long lightning flashes. To appreciate the observation, consider first the “ordinary” lightning flash. The charge center of the cloud itself is typically 6–10 km above ground. And from there the lightning doesn’t necessarily go straight down: it may extend horizontally, even 100 km or more. Typical lightning might be best measured in kilometers or a few tens of kilometers.
A world record flash in 2007 meandered across Oklahoma for “approximately 300 km.” But that may be a mere cross-counties commute compared to newly discovered interstate “megaflashes” that are almost twice as long. One such megaflash, as the BAMS paper names them, sparked across the sky for ~550 km from northeast Texas across Oklahoma to southeast Kansas in October 2017. And this megaflash, too, may not be the longest ̶ it just happened to occur within the Oklahoma lightning mapping array (OK LMA), allowing for its full study.

Time integrated GLM radiances over 7.18s beginning at 0513:27.433 UTC on 22 October 2017. Two distinct electrical regimes are evident. The first is the cluster of smaller flashes in the leading line of convective cells stretching from eastern Oklahoma and then southwest into north Texas. The second regime is an extensive horizontal flash propagating from near the Red River in Texas across central Oklahoma into southeastern Kansas.
Time-integrated satellite (GLM) radiances over 7.18s beginning at 0513:27.433 UTC on 22 October 2017. Two distinct electrical regimes are evident. The first is the cluster of smaller flashes in the leading line of convective cells stretching southwest from eastern Oklahoma into north Texas. The second is the horizontal megaflash propagating from near the Red River in Texas across central Oklahoma into southeastern Kansas.

 
Also, just like the official record flash, which produced 13 cloud-to-ground (CG) lightning strikes, including two triggering sprites that shot high into the atmosphere, this horizontal megaflash also triggered a plethora of CG bolts, in-cloud discharges, and upward illuminations during its 7.18 second lifespan.
The new Geostationary Lightning Mapper sensor on the GOES-16/17 satellite has become the latest tool suited to investigating long-path lightning. The BAMS paper says the sensor is showing that a megaflash “appears able to propagate almost indefinitely as long as adequate contiguous charge reservoirs exist” in the clouds. Such conditions seem to be present in mesoscale convective systems—large conglomerates of thunderstorms that extend rainy stratiform clouds across many hundreds of km. The paper adds,

Megaflashes also pose a safety hazard, as they can be thought of as the stratiform region’s version of the ‘bolt-from-the blue,’ sometimes occurring long after the local lightning threat appears to have ended. But some key questions remain – what is the population of megaflashes and how long can they actually become?

The authors conclude:

Is it possible that a future megaflash can attain a length of 1000 km? We would not bet against that. Let the search begin.