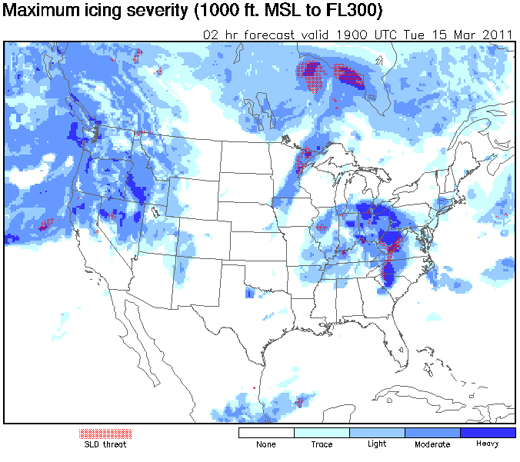
NCAR has developed a new forecasting system for aircraft icing that delivers 12-hour forecasts updated hourly for air space over the continental United States. The Forecast Icing Product with Severity, or FIP-Severity, measures cloud-top temperatures, atmospheric humidity in vertical columns, and other conditions and then utilizes a fuzzy logic algorithm to identify cloud types and the potential for precipitation in the air, ultimately providing a forecast of both the probability and the severity of icing. The system is an update of a previous NCAR forecast product that only was capable of estimating uncalibrated icing “potential.”
The new icing forecasts should be especially valuable for commuter planes and smaller aircraft, which are more susceptible to icing accidents because they fly at lower altitudes than commercial jets and are often not equipped with de-icing instruments. The new FIP-Severity icing forecasts are available on the NWS Aviation Weather Center’s Aviation Digital Data Service website.
According to NCAR, aviation icing incidents cost the industry approximately $20 million per year, and in recent Congressional testimony, the chairman of the National Transportation Safety Board (NTSB) noted that between 1998 and 2007 there were more than 200 deaths resulting from accidents involving ice on airplanes.
Uncategorized
Arctic Ozone Layer Looking Thinner
The WMO announced that observations taken from the ground, weather balloons, and satellites indicate that the stratospheric ozone layer over the Arctic declined by 40% from the beginning of the winter to late March, an unprecedented reduction in the region. Bryan Johnson of NOAA’s Earth System Research Laboratory called the phenomenon “sudden and unusual” and pointed out that it could bring health problems for those in far northern locations such as Iceland and northern Scandinavia and Russia. The WMO noted that the thinning ozone was shifting locations as of late March from over the North Pole to Greenland and Scandinavia, suggesting that ultraviolet radiation levels in those areas will be higher than normal, and the Finnish Meteorological Institute followed with their own announcement that ozone levels over Finland had recently declined by at least 30%.
Previously, the greatest seasonal loss of ozone in the Arctic region was around 30%. Unlike the ozone layer over Antarctica, which thins out consistently each winter and spring, the Arctic’s ozone levels show greater fluctuation from year to year due to more variable weather conditions.
Did Monday's Storm Set a Reporting Record?
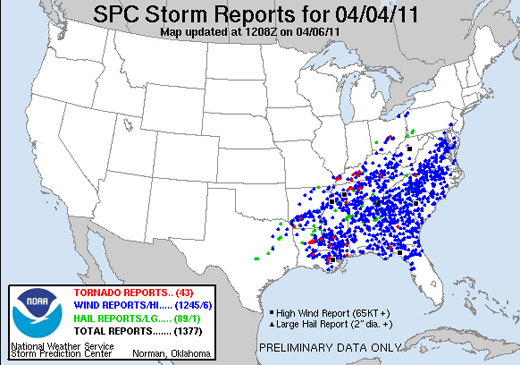
A storm system that stretched from the Mississippi River to the mid-Atlantic states on Monday brought more than 1,300 reports of severe weather in a 24-hour period, including 43 tornado events.
The extraordinary number of reports testifies to the intensity of the storm, which has been blamed for at least nine deaths, but it also reflects changes in the way severe weather is reported to–and recorded by–the Storm Prediction Center. As pointed out by Accuweather’s Brian Edwards, the SPC recently removed filters that previously prevented multiple reports of the same event that occurred within 15 miles of each other. Essentially, all reports are now accepted, regardless of their proximity to other reports. Additionally, with ever-improving technology, there are almost certainly more people sending reports from more locations than ever before (and this is especially true in highly populated areas such as much of the area covered by this storm).
So while the intensity of the storm may not set any records, the reporting of it is one for the books. According to the SPC’s Greg Carbin, Monday’s event was one of the three most reported storms on record, rivaled only by events on May 30, 2004 and April 2, 2006.
New Tools for Predicting Tsunamis
The SWASH (Simulating Waves until at Shore) model sounds like something that would have been useful in predicting the tsunami in Japan. According to the developer Marcel Zijlema at Delft University of Technology, it quickly calculates how tall a wave is, how fast it’s moving, and how much energy it holds. Yet, Zijlema admits that unfortunately it wouldn’t have helped in this case. “The quake was 130 kilometers away, too close to the coast, and the wave was moving at 800 kilometers per hour. There was no way to help. But at a greater distance the system could literally save lives.”
SWASH is a development of the SWAN (Simulating Waves Near SHore), which has been around since 1993 and is used by over 1,000 institutions around the world. SWAN calculates wave heights and wave speeds generated by wind and can also analyze waves generated elsewhere by a distant storm. The program can be run on an ordinary computer and the software is free.
According to Zijlema, SWASH works differently than SWAN. Because the model directly simulates the ocean surface, film clips can be generated that help in explaining the underlying physics of currents near the shore and how waves break on shore. This makes the model not only an extremely valuable in an emergency, but also makes it possible to construct effective protection against a tsunami
Like SWAN, SWASH will be available as a public domain program.
Another tool recently developed by seismologists uses multiple seismographic readings from different locations to match earthquakes to the attributes of past tsunami-causing earthquakes. For instance, the algorithm looks for undersea quakes that rupture more slowly, last longer, and are less efficient at radiating energy. These tend to cause bigger ocean waves than fast-slipping subduction quakes that dissipate energy horizontally and deep underground.
The system, known as RTerg, sends an alert within four minutes of a match to NOAA’s Pacific Tsunami Warning Center as well as the United States Geological Survey’s National Earthquake Information Center. “We developed a system that, in real time, successfully identified the magnitude 7.8 2010 Sumatran earthquake as a rare and destructive tsunami earthquake,” says Andrew Newman, assistant professor in the School of Earth and Atmospheric Sciences. “Using this system, we could in the future warn local populations, thus minimizing the death toll from tsunamis.”
Newman and his team are working on ways to improve RTerg in order to add critical minutes between the time of the earthquake and warning. They’re also planning to rewrite the algorithm to broaden its use to all U.S. and international warning centers.
The Evolution of Melting Ice
Off the coast of Antarctica, beyond the McMurdo Station research center at the southwestern tip of Ross Island, lies Hut Point, where in 1902 Robert Falcon Scott and his crew established a base camp for their Discovery Expedition. Scott’s ship, the Discovery, would soon thereafter become encased in ice at Hut Point, and would remain there until the ice broke up two years later.
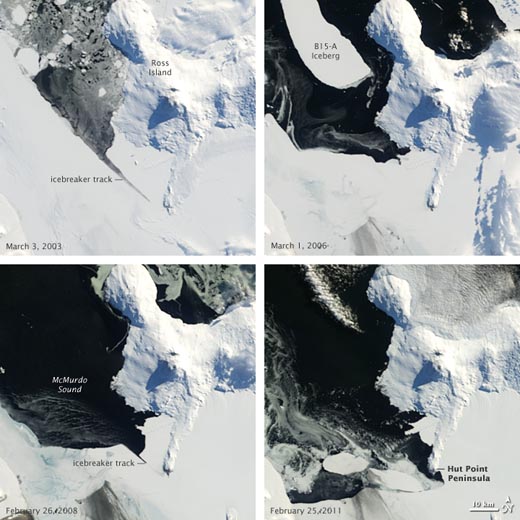
Given recent events, it appears that Scott (and his ship) could have had it much worse. Sea levels in McMurdo Sound off the southwestern coast of Ross Island have recently reached their lowest levels since 1998, and last month, the area around the tip of Hut Point became free of ice for the first time in more than 10 years. The pictures below, taken by the Moderate Resolution Imaging Spectroradiometer on NASA’s Terra satellite and made public by NASA’s Earth Observatory, show the progression of the ice melt in the Sound dating back to 2003. The upper-right image shows a chunk of the B-15 iceberg, which when whole exerted a significant influence on local ocean and wind currents and on sea ice in the Sound. After the iceberg broke into pieces, warmer currents gradually dissipated the ice in the Sound; the image at the lower right, taken on February 25, shows open water around Hut Point.
Of course, icebreakers (their tracks are visible in both of the left-hand photos) can now prevent ships from being trapped and research parties from being stranded. Scott could have used that kind of help in 1902…
Hot Off the Presses
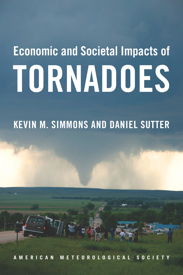 Today marks the release of a new AMS publication, Economic and Societal Impacts of Tornadoes. The book examines data on tornadoes and tornado casualties through the eyes of a pair of economists, Kevin Simmons and Daniel Sutter, whose personal experiences in the May 3-4 1999 Oklahoma tornadoes led to a project that explored ways to minimize tornado casualties. The book culminates more than 10 years of research. (At the Annual Meeting in Seattle, the authors talked to The Front Page about their new book.)
Check out the online bookstore to purchase this and other AMS titles.
Here Comes the Sun–All 360 Degrees
The understanding and forecasting of space weather could take great steps forward with the help of NASA’s Solar Terrestrial Relations Observatory (STEREO) mission, which recently captured the first-ever images taken simultaneously from opposite sides of the sun. NASA launched two STEREO probes in October of 2006, and on February 6 they finally reached their positions 180 degrees apart from each other, where they could each photograph half of the sun. The STEREO probes are tuned to wavelengths of extreme ultraviolet radiation that will allow them to monitor such solar activity as sunspots, flares, tsunamis, and magnetic filaments, and the probes’ positioning means that this activity will never be hidden, so storms originating from the far side of the sun will no longer be a surprise. The 360-degree views will also facilitate the study of other solar phenomenon, such as the possibility that solar eruptions on opposite sides of the sun can gain intensity by feeding off each other. The NASA clip below includes video of the historic 360-degree view.
The Weather Museum Names Its 2010 Heroes
The Weather Hero Award is given to individuals or groups who have demonstrated heroic qualities in science or math education, volunteer efforts in the meteorological community, or assistance to others during a weather crisis. The 2010 Weather Heroes honored were the American Meteorological Society, KHOU-TV in Houston, and Kenneth Graham, meteorologist-in-charge of the NWS New Orleans/Baton Rouge office.
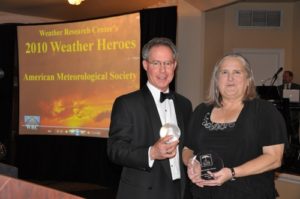
The AMS was recognized for developing and hosting WeatherFest for the past ten years. WeatherFest is the interactive science and weather fair at the Annual Meeting each year. It is designed to instill a love of math and science in children of all ages, encouraging careers in these and other science and engineering fields. AMS Executive Director Keith Seitter accepted the award on behalf of the Society. “While we are thrilled to display this award at AMS Headquarters,” he comments, “the real recipients are the hundreds of volunteers who have given so generously of their time and have made WeatherFest such a success over the past decade.”
KHOU-TV was honored for hosting Weather Day at the Houston Astros baseball field in fall of 2010. Weather Day was a unique educational field trip and learning opportunity that featured an interactive program about severe weather specific to the region. Over the course of the day, participants learned about hurricanes, thunderstorms, flooding, and weather safety—highlighted by video, experiments, trivia, and more.
Graham received the award for his support of the Deepwater Horizon Oil Spill cleanup. As meteorologist-in-charge of the New Orleans/Baton Rouge forecast office in Slidell, Louisiana, Graham started providing weather forecasts related to the disaster immediately following the nighttime explosion. NWS forecasters played a major role protecting the safety of everyone working to mitigate and clean up the oil spill in the Gulf of Mexico.
The awards were presented at the center’s third Annual Groundhog Day Gala and its fifth annual Weather Hero Awards on 2 February 2011.
The Weather Research Center opened The John C. Freeman Weather Museum in 2006. As well as housing nine permanent exhibits, the museum also offers many exciting programs including weather camps, boy/girl scout badge classes, teacher workshops, birthday parties and weather labs.
Commutageddon, Again and Again
Time and again this winter, blizzards and other snow and ice storms have trapped motorists on city streets and state highways, touching off firestorms of griping and finger pointing at local officials. Most recently, hundreds of motorists became stranded on Chicago’s Lake Shore Drive as 70 mph gusts buried vehicles during Monday’s mammoth Midwest snowstorm. Last week, commuters in the nation’s capital became victims of icy gridlock as an epic thump of snow landed on the Mid Atlantic states. And two weeks before, residents and travelers in northern Georgia abandoned their snowbound vehicles on the interstate loops around Atlanta, securing their shutdown for days until the snow and ice melted.
Before each of these crippling events, and historically many others, meteorologists, local and state law enforcement, the media, and city and state officials routinely cautioned and then warned drivers, even pleading with them, to avoid travel. Yet people continue to miss, misunderstand, or simply ignore the message for potentially dangerous winter storms to stay off the roads.
Obviously such messages can be more effective. While one might envision an intelligent transportation system warning drivers in real time when weather might create unbearable traffic conditions, such services are in their infancy, despite the proliferation of mobile GPS devices that include traffic updates. Not surprisingly, the 2011 AMS Annual Meeting in January on “Communicating Weather and Climate” offered a lot of findings about generating effective warnings. One presentation in particular—”The essentials of a weather warning message: what, where, when, and intensity”—focused directly on the issues raised by the recent snow snafu’s. In it, author Joel Curtis of the NWS in Juneau, Alaska, explains that in addition to the basic what, where, and when information, a warning must convey intensity to guide the level of response from the receiver.
Key to learning how to create and disseminate clear and concise warnings is understanding why useful information sometimes seems to fall on deaf ears. Studies such as the Hayden and Morss presentation “Storm surge and “certain death”: Interviews with Texas coastal residents following Hurricane Ike” and Renee Lertzman’s “Uncertain futures, anxious futures: psychological dimensions of how we talk about the weather” are moving the science of meteorological communication forward by figuring out how and why people are using the information they receive.
Post-event evaluation remains critical to improving not only dissemination but also the effectiveness of warnings and statements. In a blog post last week following D.C.’s drubbing of snow, Jason Samenow of the Washington Post’s Capital Weather Gang (CWG) wondered whether his team of forecasters, and its round-the-clock trumpeting of the epic event, along with the bevy of weather voices across the capital region could have done more to better warn people of the quick-hitting nightmare snowstorm now known as “Commutageddon.” He concluded that, other than smoothing over the sometimes uneven voice of local media even when there’s a clear signal for a disruptive storm, there needs to be a wider effort to get the word out about potential “weather emergencies, or emergencies of any type.” He sees technology advances that promote such social networking sites as Twitter and Facebook as new ways to “blast the message.”
Even with rapidly expanding technology, however, it’s important to recognize that simply offering information comes with the huge responsibility of making sure it’s available when the demand is greatest. As CWG reported recently in its blog post “Weather Service website falters at critical time,” the NWS learned the hard way this week the pitfalls of offering too much information. As the Midwest snowstorm was ramping up, the “unprecedented demand” of 15-20 million hits an hour on NWS websites led to pages loading sluggishly or not at all. According to NWS spokesman Curtis Carey: “The traffic was beyond the capacity we have in place. [It even] exceeded the week of Snowmageddon,” when there were two billion page views on a network that typically sees just 70 million page views a day.
So virtual gridlock now accompanies road gridlock? The communications challenges of a deep snow continue to accumulate…
2011 Meisinger Award Winner Working to Solve Hurricane Intensity Problem
NCAR researcher George Bryan received the 2011 Clarence Leroy Meisinger Award at the 91st AMS Annual Meeting in Seattle for innovative research into the explicit modeling, theory, and observations of convective-scale motions. With this award, the AMS honors promising young or early-career scientists who have demonstrated outstanding ability. “Early career” refers to scientists who are within 10 years of having earned their highest degree or are under 40 years of age when nominated.
The Front Page sought out Dr. Bryan to learn more about the specific problems he is working to solve with his colleagues at NCAR. “We’ve been doing numerical simulations of hurricanes in idealized environments trying to understand what regulates hurricane intensity,” he says. “One of the things we found was that small-scale turbulence is very important, small-scale being less than a kilometer scale—boundary layer eddies in the eyewall, and things like that. And so we’re hoping to take what we learned from that and apply it towards real-time forecasts and real-time numerical model simulations to better improve intensity.” In the interview, available below, Bryan says knowing this will give forecasters a better idea how strong a hurricane is likely to be when one does make landfall.