Even without a White Christmas….Snow Measurements Must Go On

The Pacific Northwest still is one of the few shining spots on the snow map for this holiday, but if Seattle is waiting with bated breath (and outstretched tongue)  for a big, beautiful White Christmas, Cliff Mass throws a bucket of cold (flakes?) on hopes for deep cover. He explains how numerical prediction models can overstate snow possibilities in low elevations near mountains. But also: he explains the commonly misunderstood difference between accumulated snow (what fell from the sky) and snow depth (what remains to pile up).

If you are one of the lucky few with snow on Christmas Day (and one of the many who will celebrate a holiday unimpeded by snowy roads), we have to ask: what are you going to do with that snow, anyway?

If you’re not sure, ask some experts. Maybe ask your friends in the Northeast who so far this winter are bereft of drifts. Would they make snow angels? Sculpt snow people, with carrots, or with buttons of coal dug out of stockings?
When meteorologists catch snowflakes—and not on outstretched tongues!—they measure. Science means quantifying snowfall.  Accuracy matters: the measurements are meaningful. For example, they figure in aircraft deicing, forecasts of spring melt, stream runoff, flooding prospects, and more. They are also tracked over many years in climate records.
Unfortunately, while measuring snow depth might be easy to imagine if you have a ruler, it’s not so simple, and measuring ongoing snowfall is not easy. Ultimately…like most things scientific: there’s more to learn and important refinements to make!

Recently the Bulletin of the American Meteorological Society published a new review of snowfall measurement techniques. The authors, John Kochendorfer of NOAA’s Air Resources Laboratory (Oak Ridge, Tennessee), and colleagues write “snowfall measurements are subject to significant errors and biases.”

For years meteorologists have realized that not all observers and networks measure snowfall the same way. For instance, methods of shielding gauges from wind errors, or accounting for evaporation, vary. And the results vary. To clear this snow observing problem the World Meteorological Organization put together a team of scientists who compared and evaluated the various methods and devices used worldwide. Kochendorfer et al. followed up to see what progress can be made from this WMO report. They write:

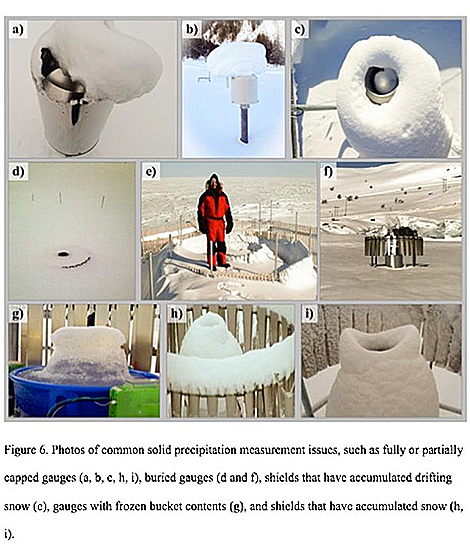
Snowfall is one of the most difficult meteorological variables to measure using automated sensors. …. Despite recent advancements in sensor technology, measurement techniques, and communications, snow cover measurements, such as snow depth and snow water equivalent (SWE), are still primarily recorded manually, and require specialized equipment and well-trained personnel. …. Measurement of the liquid water equivalent of precipitation falling as snow, or other forms of solid precipitation, typically requires heated precipitation gauges to prevent full or partial blockage (capping) of the gauge inlet by snow and ice. In addition, precipitation gauges can significantly underestimate the true amount of solid precipitation, primarily due to wind effects. For these reasons, the improvement of snow cover and solid precipitation measurements is an important subject of climatological and hydrological research in cold regions.

All-season measurement methods that catch precipitation (such as tipping-buckets) can handle snow, as can weighing gauges. Methods that catch snowflakes ultimately require weighing the melted water of snow. For these common methods, Kochendorfer et al. note that evaporation and response delays can be a problem (because it is necessary to warm and melt the snow and weigh the catch). The wind shields protecting the gauges can also accrue or redirect snow, however.

One piece of advice from the article may seem perfectly attuned with a White Christmas. If you’ve got family coming over for dinner, and a weighing-gauge catchment device for snow, put the snow in the pan and of course, heat it, but also add a layer of oil. The idea is not to fry up a side dish. But to prevent evaporation (and freezing—in fact antifreeze is used in some snow measurement techniques). Yes, that’s basically a way to keep track of snow as its falling and not lose too much in the process.

The ways of “undercatchment” are multifarious:
Snow measuring issues
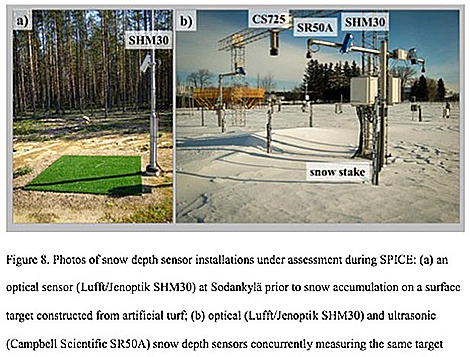
Meanwhile, Kochenderfer et al. note a proliferation of automated gauges and new non-catchment methods that involve using laser disdrometers and “present-weather” detectors to remotely determine what type of precipitation is falling.
Think of it as measuring free-ranging, versus, captive snow. Data processing methods allow calculations of snowfall rate. So far, according to the WMO comparisons, these devices solve some of the problems of “catchment” measurements, but they are still susceptible to over- and under-counting snowfall accumulation, due to wind direction and other factors. Results so far look better for observations on long periods like full seasons, rather than for a one-day holiday.  The new disdrometers can also be used in tandem with simple evaporative plates that use mass heat transfer to measure amounts.

Even if a White Christmas isn’t in the immediate future for many of us, the future of snow measurement may already have arrived anyway, if not for every observer.

New snow devices

Red Proverb at Morning, Meteorologists Take Warning

Sunset4_IMG_0813 copy

Weather proverbs can be useful indicators of real correlations observed over the centuries, but they can also show unwelcome persistence. The phenomenon is well known: for example, a December 1931 BAMS article referred to a Columbia University study that revealed most high school students had heard the proverb, “When squirrels gather an unusual supply of nuts, it indicates a severe winter”—and 61% of them believed it.

Efforts to confirm or debunk proverbs are also an old tradition. As recorded in the October 1896 Monthly Weather Review, members of the Meteorological Society of France discussed the merits of the popular proverb: ” When it rains on St. Medard’s day it will rain for forty days unless fine weather returns on the day of St. Bernabe.” They found no confirmation of the saying in their data.

In recommending W.J. Humphrey’s 1923 book sorting proverb fact from fiction, Robert deCourcy Ward of Harvard University wrote in BAMS,

There have been several such collections, but there have been practically no serious attempts to separate the “good” from the “bad” proverbs. Many proverbs are merely the relics of past superstitions. Many are useful in one climate and of no use in another land into which they have been imported. Most of our own proverbs came from Europe, or even still farther away, and do not fit into our climatic environment.

Along comes an unusually thorough verification study of Polish weather proverbs in the July 2020 issue of Weather, Climate and Society. Lead author Piotr Matczak (of the Adam Mickiewicz University in Poznań, Poland) and colleagues set their article in the context of the recent, increased interest in integrating traditional knowledge with scientific findings in order to enrich overall climate databases.

The authors searched through 1,940 sayings, mostly looking for if-then logical structure (such as “hot July leads to January frosts”) that suggested predictive power, and narrowed the list to 28 specific enough about temperature to be verified by decades of weather data from observing stations in and around Poland. In many cases, this meant turning subjective descriptions into quantitative categories. For instance, “If Saint Matthew (February 24) does not melt ice, peasants will long puff to warm their cold hands]” was recast as a test: the correlation of maximum air temperature on February 24 below 0°C to mean air temperature for the following two weeks below 0°C.

This proverb proved to be the most accurate of the bunch, fulfilling its predictions 83% of the time. The rest of the sayings were–not so much fantastical as just plain unhelpful. Only 16 of the 28 proverbs showed any forecast skill, and usually quite low skill, which wasn’t necessarily unexpected, since many of the proverbs were essentially extended range forecasts that wouldn’t have been skillful even with modern techniques. Three proverbs, like “If the Marek day (April 25) is threatening with the swelter the Boniface (May 14) freezes” never predicted accurately in the data record. Most of the time the predictive condition occurred, the predicted consequence did not occur (false alarm ratios for most proverbs greatly exceeded 50%).

Including the St. Matthew’s day prediction, only three verified more than 43% of the time: “When Zbigniew and Patrick (March 17) are freezing people’s ears, two more Sundays of winter freezing and snows,” and another for St. Matthew’s day: “If the Matthew day is warm there is a hope for spring.”

There were some interesting shifts in the proverbs’ success rate however that may warrant follow-up research. They did better earlier in the record than in later years, and better in eastern Poland and formerly Polish lands further east. Matczak et al. note,

following the Second World War, Poland was displaced by some 200 km westward, with the population displaced accordingly. Thus, the proverbs may refer to the climate of areas that are more eastward when compared with the current borders of Poland, that is, the areas nowadays in Belarus, Lithuania, and Ukraine.


Blending Satellite Imagery is Both ‘Science and Art’ to Maximize Information Delivery

Monitoring the atmosphere by satellite has come a long, long way technologically since TIROS sent back its first snapshots of Earth in 1960. Along with marked advances in spectral, spatial, temporal, and radiometric resolution of state-of-the-art instrumentation, however, come copious volumes of new data as well as unique challenges with how to view it all.

We as users are hardly up to the task alone — there’s insufficient time, especially for operational forecasters. The solution: blended imagery. In short, the seamless display of multivariate atmospheric information gleaned from today’s advanced satellites.

Value-added imagery from NOAA’s GOES-R satellite series, for example, isn’t just useful, but rather at its best it’s “a balance of science and art,” report Steven Miller (Colorado State University) and colleagues of a new paper in the Journal of Atmospheric and Oceanic Technology. Such multidimensional blending of key weather parameters into visually intuitive products maximizes the information available to users.

To illustrate this, the author’s applied the blending technique to new GOES-16’s GEOCOLOR imagery. Below is an example of a “sandwich product” in which (a) color-enhanced infrared imagery with a transparency of 70% is superimposed upon (b) visible reflectance imagery of thunderstorms over Texas, Louisiana, and Arkansas at 2319 UTC April 6, 2018, to dynamically (c) blend the images.

PoN_miller

This “partial transparency” blending technique highlights the overshooting cloud tops in the convection, enabling forecasters to pinpoint the most intense cells. It’s just one of a number of methods the paper highlights to simultaneously display satellite information and thereby present valuable insight.

The technique, Miller et al. state, blurs the line between qualitative imagery users want and quantitative products they need.

To the trained human analyst, capable of drawing context from such value-added imagery, combining the best of both worlds provides a powerful new paradigm for working with the new generation of information-rich satellites.

New Western Storms Scale to Describe Intensity, Potential Impacts of Atmospheric Rivers

Hurricanes are classified by the Saffir-Simpson Scale and tornadoes by the Enhanced Fujita Scale, and now atmospheric rivers—those long, transient corridors of water vapor that fuel flooding rain events each winter in the West, especially California—will also be scaled to enhance awareness and bolster prediction.
The new AR scale ranks their intensity and potential impacts from 1 to 5 using the categories “weak,” “moderate,” “strong,” “extreme,” and “exceptional,” based on the amount of water vapor they carry and their duration. It is intended to describe the strength of ARs as beneficial to hazardous, aiding water management and flood response.
AR-Scale
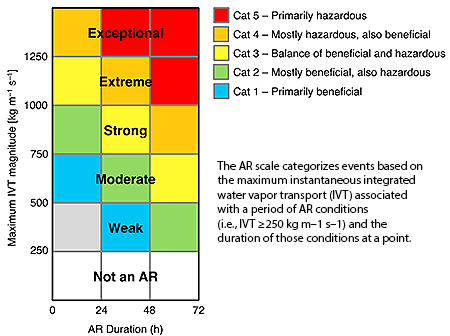
“The scale recognizes that weak ARs are often mostly beneficial because they can enhance water supply and snow pack, while stronger ARs can become mostly hazardous, for example if they strike an area with conditions that enhance vulnerability, such as [where there are] burn scars, or already wet conditions,” says Marty Ralph and co-authors in a paper appearing in the February 2019 issue of BAMS and posted online as an early release today. “Extended durations can enhance impacts,” he says.
Ralph is director of the Center for Western Water and Weather Extremes (CW3E) at Scripps Institution of Oceanography and a leading authority on atmospheric rivers, which were officially defined by the AMS in 2017. The new scale was created in collaboration with NWS meteorologists Jonathan Rutz and Chris Smallcomb, and several other experts. It marks two decades of intensive field research that involved establishing a network of dozens and dozens of automated weather stations to observe ARs in real time and flying research planes through them as they crashed ashore and up and over the mountainous terrain of California, Oregon, and Washington.
Atmospheric rivers are the source of most of the West Coast’s heaviest rains and floods—roughly 80 percent of levee breaches in California’s Central Valley are associated with landfalling ARs. Research shows that a combination of intense water vapor transport for a long duration over a given area causes the biggest impact. But ARs also are primary contributors to the region’s water supply.
The newly created scale is designed to capture this combination, accounting for both the amount of available water and the duration it is available. It focuses on a period of 24-48 hours as its standard measurement. When an AR lasts in an area fewer than 24 hours it is demoted by one category, and if it persists more than 48 hours, it is promoted by a category. Unlike the operational hurricane scale, which has been criticized for inadequately representing the increased impacts of slower-moving, lower-end hurricanes, duration is a fundamental factor in the AR scale. It also aims to convey the benefits of ARs, not just the hazards.
“It can serve as a focal point for discussion between water managers, emergency response personnel and the research community as these key water supply and flood inducing storms continue to evolve in a changing climate,” says co-author Michael Anderson of the California Department of Water Resources.
The scale ranks ARs in five categories:

  • AR Cat 1 (Weak):  Primarily beneficial. For example, a February 23, 2017, AR hit California, lasted 24 hours at the coast, and produced modest rainfall.
  • AR Cat 2 (Moderate): Mostly beneficial, but also somewhat hazardous. An AR on November 19-20, 2016, hit Northern California, lasted 42 hours at the coast, and produced several inches of rain that helped replenish low reservoirs after a drought.
  • AR Cat 3 (Strong): Balance of beneficial and hazardous. An AR on October 14-15, 2016, lasted 36 hours at the coast, produced 5-10 inches of rain that helped refill reservoirs after a drought, but also caused some rivers to rise to just below flood stage.
  • AR Cat 4 (Extreme): Mostly hazardous, but also beneficial. For example, an AR on January, 8-9, 2017, that persisted for 36 hours produced up to 14 inches of rain in the Sierra Nevada and caused at least a dozen rivers to reach flood stage.
  • AR Cat 5 (Exceptional): Primarily hazardous. For example, a December 29, 1996, to January 2, 1997, AR lasted over 100 hours at the Central California coast. The associated heavy precipitation and runoff caused more than $1 billion in damages.

When AR storms are predicted for the West Coast, the scale rankings will be updated and communicated on the CW3E website and its Twitter handle.
“The launch of the AR Scale marks a significant step in the development of the concept and its application,” Ralph commented in an e-mail to the AMS, “and caused me to reflect back a bit on where it came from. All the people and organizations who’ve contributed. The scientific debate around the subject. The creation of a formal definition for the Glossary of Meteorology. The creation of a 100-station mesonet to monitor them in California. The AR Recon effort underway in a partnership between Scripps and NCEP [now NCEI], and in collaboration with the Navy, NCAR, and ECMWF, as well as others.  A number of papers are already in the works using the scale, and we are hopeful that it will prove useful for the public and for officials who must deal with storms in a large area where scales for hurricanes, tornadoes and nor’easters are not very applicable.”

Small-scale Vortices Enhanced Winds and Damage in Hurricane Harvey

Severe but highly variable wind damage to homes & infrastructure is a hallmark of intense tropical cyclones. Until recently there was only speculation that such damage, which appears in short swaths, was the work of tornadoes. Now, there’s first-ever proof that tornadoes and other small-scale phenomena did indeed enhance the winds and damage in Hurricane Harvey last August.

Fine-scale Doppler On Wheels (DOW) radar imagery collected from inside the eyewall of Hurricane Harvey (Left: radar reflectivity, Right: Doppler velocity). The ring of convection comprising the eyewall is highly perturbed by four MVs (labeled A-D). From inside the eye, the wind perturbations caused by the MVs are especially visible. DOW location is yellow dot. Black rectangle is zoomed-in area shown in separate figure illustrating tornado-scale vortices.
Fine-scale DOW radar imagery from inside the eyewall of Hurricane Harvey (Left: radar reflectivity, Right: Doppler velocity). The ring of convection comprising the eyewall is highly perturbed by four MVs (labeled A-D). From inside the eye, the wind perturbations caused by the MVs are especially visible. DOW location is the yellow dot. Black rectangle is zoomed-in area shown in figure below illustrating tornado-scale vortices.

 
Doppler of Wheels (DOW) radar in the eye of Harvey revealed mesovortices (MVs) rotating swiftly around the inner eyewall, and embedded in them and documented for the first time were small tornado-scale-vortices (TSVs) less than a half-mile wide spinning within the larger wind field of the hurricane. The discovery was reported in March in a paper published in Monthly Weather Review.
The rotation of the TSVs is weaker than typical supercell tornadoes, but because these circulating winds are embedded in an already extreme eyewall, they ramp up the wind speed and create greatly enhanced damage potential, says the study’s lead author Joshua Wurman of the Center for Severe Weather Research. In Harvey, major hurricane winds of about 120 mph ramped up to 130-140 mph or more and resulted in streaks of severe damage not evident elsewhere from the eyewall winds.
“Wind gusts at the DOW site were measured up to 145 mph, likely caused by a TSV, and 30% of the vehicles parked near the DOW were lofted,” Wurman wrote in a summary of the paper to appear in a forthcoming issue of the Bulletin of the AMS. A Jeep and two SUVs were picked up by the wind and landed atop debris from the destroyed building in which they were housed. He said the swaths of intense damage corresponded to the tracks of the eyewall TSVs.
Doppler velocity data reveals single and paired TSVs (demarked schematically with black circles) translating rapidly southward in Harvey’s northwestern eyewall embedded in strong northerly flow (black arrow). These TSVs, moving southward at up to 120 mph, were associated with very intense winds measured up to 145 mph, lofted vehicles, and swaths of the most intense building damage.

Doppler velocity data reveals single and paired TSVs (black circles) translating southward in Harvey’s northwestern eyewall embedded in strong northerly flow (black arrow). These TSVs, moving southward at up to 120 mph, were associated with very intense winds measured up to 145 mph, lofted vehicles, and swaths of the most intense building damage.

 
Wurman and co-author Karen Kosiba, also with CSWR, will present their research findings from Hurricane Harvey as well as newly identified evidence of at least one Harvey-like TSV in Hurricane Irma over Florida at the 33rd AMS Conference on Hurricanes and Tropical Meteorology next week in Ponte Vedra Beach, Florida. The conference will feature a number of other presentations on the devastating hurricanes of 2017, in multiple sessions (Session 1, Session 2, Session 3, Session 4).
Intense wind gusts, likely caused by tornado-scale vortices in Harvey’s eyewall, lofted SUV-type vehicles (red arrows; green arrows point to unlofted vehicles). Wind gusts as intense as 145 mph were measured by a DOW-mounted anemometer 350 m downstream from these lofted vehicles.
Intense wind gusts, likely caused by TSVs in Harvey’s eyewall, lofted SUV-type vehicles (red arrows; green arrows point to unlofted vehicles). Wind gusts as intense as 145 mph were measured by a DOW-mounted anemometer 350 m downstream from these lofted vehicles.

 
Wurman notes that it’s unclear whether the new wind whirls are more numerous in intense or rapidly strengthening hurricanes. But adds that the enhanced damage was palpable, and with an increase in powerful hurricanes possible due to rising global air and ocean temperatures, it’s important to learn more about them, he says.
“Potential climate change may result in more frequent intense and/or rapidly intensifying hurricanes, thus understanding and forecasting the causes of hurricane wind damage is a high priority.”

The New Capital of Lightning

Imagine being awoken late one night by the near constant glow of lightning overhead—often flickering silently but occasionally rumbling deeply with a strike nearby. Then it happens the same time the next night—and the next, and the next, sometimes lasting for many hours at a time.
Now imagine the nocturnal fireworks happening nearly 300 days per year.
Welcome to Lake Maracaibo, Venezuela.
Based on a scientific paper just released by the Bulletin of the American Meteorological Society (BAMS), the Lake Maracaibo region is the newly crowned lightning capital of the world, taking the throne from a celebrated thunderstorm-prone region of Africa.
Lake Maracaibo, the largest lake in South America, is already well known for its lightning. Boats take tourists onto the water to watch the storms, and the flag of the region—the State of Zulia—features a lightning bolt in honor of the lake’s prolific displays.200px-Flag_of_Zulia_State.svg
Nonetheless, Africa’s Congo Basin had previously been identified by scientists as the world’s lightning hotspot. It stayed that way for several years until the new BAMS article (available online) recalculated rankings based on a new, high-resolution dataset of satellite observations of the lightning flash-rate density.
Lake Maracaibo’s pattern of convergent wind flow–mountain–valley, lake, and sea breezes–occurs over warm lake waters nearly year-round and contributes to nocturnal thunderstorm development 297 days per year on average, with a peak in September. These thunderstorms are very localized and their persistent development anchored in one location accounts for the high flash-rate density. While practically the whole lake is averaging 50 flashes per year, only a small portion qualifies as the world leading hotspot, with more than 232 flashes per square kilometer per year (including cloud-to-ground and cloud-to-cloud lightning).
The BAMS article, “Where are the Lightning Hotspots on Earth?” by Rachel I. Albrecht, Steven J. Goodman, Dennis E. Buechler, Richard J. Blakeslee, and Hugh J. Christian, is derived from 16 years of observations by the Lightning Imaging Sensor aboard the now defunct NASA Tropical Rainfall Measurement Mission satellite.
The team—representing the University of Maryland, Universidade de São Paulo (Brazil), NOAA, NASA, and the University of Alabama in Huntsville—cites several factors for the new lightning champion, including its unique geography and climatology. Storms mostly form during the nighttime hours, after the tropical heating of the day allows warm Caribbean air to mix with colder Andes Mountain air. According to the article, “Nocturnal thunderstorms over Lake Maracaibo are so frequent that their lightning activity was used as a lighthouse by Caribbean navigators in colonial times.”

lightning hot spots

The authors noted that previous studies, using the same satellite capabilities, missed the localized peak at Lake Maracaibo for several reasons. Coarser resolution was one problem (the new study partitions the lake into 20 times more sectors than earlier studies), but so were filtering of high-density outbursts of lightning and calculations made to compensate for limited samples of sparse lightning areas. Where the previous studies were aimed at getting the first useful global overviews, the new study is calibrated to identify hotspots.
Located near the border of the Congo and Rwanda, the now second-ranked Kahuzi-Biéga National Park in Kabare has its own mountainous geography that allows five different locations in the region to rank in the top 10 for lightning flash-rate density. Previous research had shown that the Congo basin boasted the largest flash rate per thunderstorm, and the region still has the world’s largest average flash rate density for any particular part of the day. It averages 5.5 flashes per hour at about 5:30 p.m. local time within a 1° latitude x 1° longitude box. That rate is nearly matched by Lake Maracaibo averaging more than 5.4 flashes per hour at about 3 a.m., when nighttime winds descending the mountain valleys converge over the ever-warm lake waters.
Both of the top two hotspots have lengthy lightning “seasons” but neither had a peak spell matching the 90 flashes per day in early August in the 1° x 1° region of Majagual, Colombia.
Before satellite observations were available, scientists estimated that the whole Earth at any one time experienced about 100 flashes per second. Satellite evidence has reduced that estimate to about 44 to 46 flashes per second, which means Earth experiences nearly 1.4 billion lightning flashes per year. The rate is 20% higher during Northern Hemisphere summer. This variation is in part due to the larger amount of land north of the equator, which lends itself to the surface heating that fuels thunderstorms.
The new BAMS study confirms previous findings showing that lightning activity tends to happen at night in areas closer to mountain ranges and/or coasts but continental-wide lightning activity peaks during the afternoons. And yet the new king of lightning is over water and peaks at night.
The new list of the world’s top 10 lightning flash-rate density hotspots (shown below) includes no sites from North America. Four locations, in Guatemala, Cuba, and Haiti, had more than 100 flashes per square km per year (led by 117 in Patulul, Guatemala). The most lightning prone U.S. location, ranked 122nd globally, was in the Everglades not far from Ft. Myers, Florida, with 79 flashes per square km per year.

World rank

Flash-rate density


Location

1

232.52

Lake Maracaibo, Venezuela

2

205.31

Kabare, Dem. Rep. of Congo

3

176.71

Kampene, Dem. Rep. of Congo

4

172.29

Caceres, Colombia

5

143.21

Sake, Dem. Rep. of Congo

6

143.11

Dagar, Pakistan

7

138.61

El Tarra, Colombia

8

129.58

Nguti, Cameroon

9

129.50

Butembo, Dem. Rep. of Congo

10

127.52

Boende, Dem. Rep. of Congo

Flash-rate density indicates the average number of times lightning flashes each year over an area 1 square kilometer in size.
 

A New Metric for Hurricane Destruction Potential

Hurricanes Katrina (2005), Ike (2008), and Sandy (2012) have proven the Saffir-Simpson Scale is inadequate for expressing hurricane destructiveness. This is especially true for storm surge, which the original Category 1-5 wind damage potential rating scale wasn’t designed to classify.
As another Atlantic hurricane season begins, a study now accepted for publication in Monthly Weather Review introduces a new metric for measuring the destructive potential of tropical cyclones: Track Integrated Kinetic Energy. TIKE builds on the earlier concept of Integrated Kinetic Energy to represent destructive potential by computing a storm’s sustained wind field quadrant-by-quadrant along its entire track. Summing up the IKE values over the tropical cyclone’s lifecycle more accurately determines the potential for destruction, the study concludes.
Additionally, TIKE can be accumulated for all of a tropical cyclone basin’s storms in a given year to create “an important metric of that season,” the authors write in a summary of their research (to appear in an upcoming issue of the Bulletin of the AMS).
Vasu Misra, lead author of the study “The Track Integrated Kinetic Energy of the Atlantic Tropical Cyclones,” adds:

Existing metrics such as Accumulated Cyclone Energy (ACE) or the Power Dissipation Index (PDI) only consider the peak wind in the storm, which is difficult to measure and typically only covers a very small area and contributes little to storm surge and wave damage.  TIKE takes into account the wind forcing over a large area surrounding the storm and is therefore much more reliable as an objective measure of hurricane destructive potential. In effect TIKE accounts for the intensity, duration, size, and structure of the tropical cyclones.

The study by Misra and his colleagues also looks at seasonal and season-to-season as well geographic variations of TIKE. Among its findings:

  • TIKE peaks in September along with hurricane season overall, since that’s when the Atlantic Ocean is warm enough to fuel large and long-lived storms;
  • Very active hurricane seasons such as 2005 may not be the most destructive since some large and powerful hurricanes may be short-lived;
  • Annual variations in TIKE are related to sea surface temperature variations in both the equatorial Pacific (warmer temperatures there relate to lower TIKE in the Atlantic) and the Atlantic (its warmer temperatures relate to higher TIKE there).

The MWR article abstract is open to all readers, while subscribers can read the full Early Online Release on the AMS journals website.