Be There: The Daniel Keyser Symposium

Highlighting Key Sessions at AMS 2024

The Daniel Keyser Symposium at the 104th AMS Annual Meeting will advance the science of synoptic-dynamic meteorology and celebrate the contributions of Prof. Daniel Keyser, a multifaceted researcher and educator. Keyser (pictured at right), a Fellow of the AMS and recipient of the AMS Meisinger Award and Lorenz Teaching Excellence Award, is well-known for his seminal work on cold-front updrafts and for co-originating the Shapiro–Keyser cyclone model.

We spoke with Symposium Co-Chair David Schultz, Professor of Synoptic Meteorology at the University of Manchester, about why the AMS community is celebrating synoptic-dynamic meteorology and Daniel Keyser’s contributions to the field. Here are a few excerpts:

Daniel Keyser

How has Daniel Keyser influenced the field of meteorology?

Dan is one of those people who don’t get the attention they deserve. He’s worked on so many things and worked with so many people. Yet he’s done so in a very humble way.

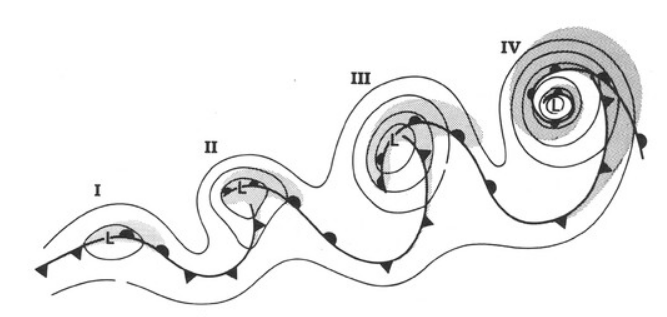
A lot of what we know about cold fronts is from the work that Dan did. Dan’s PhD was about understanding the circulation of cold fronts and the dynamics of that interaction with the boundary layer in driving the updraft air at the leading edge of the cold front. Later, he developed the concepts of vector frontogenesis and partitioning Q/F vectors into front-normal or front-parallel flows, which help us diagnose the frontal-scale circulations and the larger synoptic-scale circulations in which they are embedded. Also, the concept of the Shapiro–Keyser cyclone model is now commonly taught in meteorology programs. The region of high winds called the sting jet, which is common in North Atlantic cyclones that may impact western Europe, only occurs in Shapiro–Keyser cyclones. 

Not only has Dan been a great researcher, but he’s a great teacher at all levels, undergraduate and graduate. Much of my teaching philosophy comes from my time at Albany, from Dan and Lance Bosart. All four of us on the program committee, and so many others, have been influenced by Dan’s education over the years.

The Shapiro–Keyser Cyclone Model, image taken from Shapiro and Keyser (1990).

Give us a few highlights of the Symposium’s program.

The first session gives a perspective on Dan’s career, including Dan’s work on wildfires and how he’s influenced others. Wildfire enthusiasts will want to check that out. The second session is called “Jets and Cyclones,” the meat-and-potatoes of Dan’s work. There will be a number of talks about various aspects of fronts, on the frontal scale but also up to the planetary scale, and how things like predictability and planetary-scale circulations in different climates affect the relationship between things like precipitation and fronts. Then, the third session will feature prominent mid- and senior-career-level people speaking about fronts and frontal circulation, zooming in on the smaller scale.

Session four is about fronts and precipitation, and it closes with Dan’s own presentation. Sub-seasonal effects, precipitation extremes, convection—for anyone interested in severe, hazardous, or extreme weather (for example, the flooding in California), that will be an important talk.

Why is a symposium on synoptic-dynamic meteorology so important right now?

Synoptic-dynamic meteorology is where meteorological research started, and weather forecasts are better because of our research. Now more than ever, people need to understand the dynamics of extreme weather and take a more interdisciplinary approach to weather systems. There’s a lot of hazardous weather out there, losses from weather events are increasing, and of course many people will experience climate change through its impacts on certain weather events. So synoptic-dynamic meteorology still lies at the heart of the problems that humanity faces and learning how to mitigate them. Yet, despite its importance, we’re at this point where we synoptic-dynamic meteorologists have to fight for recognition and institutional support.

That’s one of the things that Dan really wanted to emphasize in his talk at the end of the day: “A Personal Perspective on the Continuing Importance and Value of Doctoral Education in Synoptic-Dynamic Meteorology.” His talk will help people outside synoptic-dynamic meteorology see how these talks all day during the Symposium relate to the importance of synoptic-dynamic meteorology and to societal resilience in general.

The Daniel Keyser Symposium will be held Monday, January 29, 2024 at the AMS 104th Annual Meeting, in Baltimore and online; it will feature invited presentations, a poster session, and a dinner with Keyser as the guest of honor. Learn more about the Symposium and view the program.

Naming Winter Storms: Time for Community Cooperation

by Mary M. Glackin, Senior Vice President, Public-Private Partnerships, The Weather Company
Forecasts of hazardous weather have continually improved, particularly over the past few decades. It is oft-cited fact that 5-day forecasts are now as good as 3-day forecasts were 20 years ago. At the same time, the public has more choices than ever in how it accesses weather information. In particular, we are seeing explosive growth in the web, apps, and social media outlets such as Facebook and Twitter. Yet in the aftermath of a severe event, it is common to hear, “I didn’t know” either from public officials or the public at large.
It is this latter issue that the United Kingdom’s Met Office and the Irish Meteorological Service (Met Éireann) were seeking to address when they recently announced their plans to name storms this fall and winter. And to kick the campaign off, they are soliciting the public’s help in picking the names. After watching other country’s experiences, they believe naming significant storms will increase public awareness of severe weather and thus improve appropriate responses to warnings.
Several European countries name winter storms. For example, the Free University of Berlin’s meteorological institute has been naming them since the 1950s, and these names are adopted and used by the media and the German Met Service, Deutscher Wetterdienst. In the U.S. and elsewhere, very impactful storms become named by the media; think Snowmageddon in the Northeast (2010) and St. Jude Storm in the U.K. (2013). In the U.S., The Weather Company (TWC) began naming winter storms in 2012-13, citing the importance of communicating in social media–especially Twitter, which requires a hashtag. Rightly or wrongly, this effort was roundly criticized as having suspect science and for being a marketing ploy.
After three years experience at TWC, here is what we can report: Twitter alone provides an incredible reach where we routinely see more than one billion people receiving tweets using the storm name. Millions of tweets are sent using the hashtag from government agencies, school districts, utilities, businesses, and the general public. These hashtags also allow the NWS and others to find real-time weather data tweeted by citizens that can be used in nowcasts and other storm reports.
The criteria to name a storm are pretty simple: it must meet the National Weather Service winter-storm warning criteria, and it must be expected to impact at least two million people and/or 400,000 sq. km. We use a formal process and a committee of three meteorologists to review these criteria for each possible storm, and while we consider the criteria strict, the storm-naming committee still reserves the right to override the quantitative decision in certain circumstances. Some of the factors that may influence decisions to override the naming rules include the degree of historical significance of the event (e.g., accumulating snow in South Florida, a summer-season snowstorm, etc.); see more details here.  The U.K. is planning a similar system using their two highest warning levels, so names are only applied to the storms that present a significant threat.
What’s in a name? Well in this case, the name is the headline to attract attention to the threat. It is the beginning. It needs to be backed up with easy-to-understand information that details the threat to a specific locale and appropriate call-to-action statements. But, in this information-saturated world, this headline/hashtag is key. We need to recognize the importance of serving people in the way they find easiest to consume information vs. how we are most comfortable in delivering it.
Could we take this U.K./Ireland announcement as a call to the U.S. weather enterprise to come together to see how we could maximize the use of social media to improve the public response to severe weather events?  Twitter is here to stay, and it requires hashtags to separate the relevant information from an avalanche of incoming data. Hashtags are spilling over into other social media as well. It is easy to create a hashtag from a tropical storm name. If we could come together as a community to address this for winter storms, we’d no doubt learn a lot that could then be applied to significant weather at the local scale. The nomenclature could be something much different than what’s used in tropical storms or what we have been using.
What’s important is to lead as a community in this social media era. For our part, we are willing to share our experiences, transition our system, and/or help set up an enterprise-wide naming system. During major snow events, the reach on Twitter has been over a billion. What would our reach be with all of us working together feeding into the same system to keep people informed during these hazardous events? Are we ready to re-engage on this topic as a community?


Dual Pol Radar Shedding Light on "Wintry Mix"

A recent article in the New Yorker tried in vain to dissect and understand the term “wintry mix,” only to grimly report it’s a weather phenomenon vile and disgusting and that forecasters state it to cover their backsides when a variety of winter precipitation is to descend upon man.
Far from vile and disgusting, a wintry mix is just that: a mixture of winter precipitation—snow, sleet, freezing rain—falling from the sky. No more, no less. Its mention will return to forecasts this weekend as a moisture-laden storm in the nation’s midsection plows into Arctic air and treks across the inland South and into the East next week. Rest assured: research and new technology are ready and are allowing forecasters to view wintry mix in amazing detail, better than ever before, improving predictions of the phenomena by leaps and bounds.
Recently published research on dual polarization (dual pol) weather radar in use, in a handful of AMS journals, is shining a spotlight on its capability to determine different types of precipitation falling at the same time, including the once-dreaded wintry mix. Instead of shying away from such forecasts, meteorologists using the nation’s network of Doppler radars, upgraded in recent years to include polarimetric technology, are beginning to get really good at chronicling the wintry mix in their forecasts.
While the New Yorker implied meteorologists disdain for the term, wintry mix actually is looking more beautiful than ever to scientists–so nice we put the words on the cover of the latest BAMS: “Snow Globe: Dual Pol Deciphers Wintry Mix.”
This cover article in BAMS, by Picca et al., looks at New England’s monster blizzard of 9 February 2013, which unloaded more than 3 feet of snow on much of central Connecticut and Long Island. Dual pol radar’s unique modes deciphered the wintry mix inside an intense snowband producing lightning and snowfall rates of 3-6 inches per hour.

DualPol_BAMS7
A composite of products from the dual pol radar on Long Island, New York (KOKX) shows reflectivity (ZH; top), differential reflectivity (ZDR; middle), and correlation coefficient (CC; bottom) of a heavy band of now and ice in the Northeast blizzard of 9 February 2013 (from Picca et al., BAMS). (Top) Reports of precipitation types around the time of the radar products provide ground-truth to the radar signatures. The speckled areas of reduced CC in southern Connecticut and around KOKX are a result of ground clutter. The black dot indicates the location of KOKX, and the star represents the location of the Stony Brook University surface observations. The dashed and dotted outlines indicate the two areas 1 and 2 of mixed phase precipitation. The underlined “LS” is the location of a “large sleet” report.

 
A similar article in Weather and Forecasting, by Griffin et al., documents for the first time polarimetric radar signatures of the same intense convective band of snow. The transition zone from freezing to non-freezing air (0°C isotherm) was exceptionally distinct in the radar signatures.
PPI displays of the polarimetric variables at (a)–(c) 2216 UTC 8 Feb and (d)–(f) 0236 UTC 9 Feb 2013 at 0.58 elevation. The 08C RAP model TW at the surface is overlaid (boldface, dashed). At 2216 UTC, pure dry snow was located within colder temperatures north of the 08C isotherm, while wet snow and mixed-phase hydrometeors occurred within warmer temperatures south of the 08C isotherm in (a)–(c). The solid black line indicates the location of the 1448 azimuth RHI. At 0236 UTC, dry snow was predominant, while wet snow and ice pellets were also observed within the max ZH region, within negative surface temperatures, north of the 08C isotherm in (d)–(f).
Displays of the polarimetric (i.e., dual pol) variables at (a)–(c) 2216 UTC 8 Feb and (d)–(f) 0236 UTC 9 Feb 2013 — during the Northeast blizzard (from Griffin et al., WAF). At 2216 UTC, pure dry snow was falling within colder temperatures north of the model-indicated 0°C isotherm (bold black dashed line), while wet snow and mixed-phase hydrometeors occurred within warmer temperatures south of the 0°C isotherm in (a)–(c).  At 0236 UTC, dry snow was predominant, while wet snow and ice pellets were also observed within the max ZH region, within below-freezing surface temperatures north of the 0°C isotherm in (d)–(f).

 
In the Journal of Applied Meteorology and Climatology (JAMC), the article by Kumjian et al. discusses the use of intensive radar measurements to study the finescale structure of more than a dozen Colorado Front Range snowstorms. And in Monthly Weather Review, Geerts et al. explain in their article how a specifically synthesized dual Doppler radar technique in an airborne platform was able to directly measure hydrometeor vertical motion, improving the accuracy of the radar.
CSU-CHILL RHI along the 181.998 azimuth at 0852 UTC 9 Apr 2013 for (a) ZH and(b) ZDR. Arrows show the locations of generating cells.
Vertical slices through a 9 April 2013 Colorado snowstorm from Colorado State University’s CHILL dual-pol radar show (a) reflectivity (ZH) as well as (b) differential reflectivity (ZDR), which indicates particle shape and size (from Kumjian, JAMC). Arrows show the locations of generating cells.

 
Conceptual model of a vertical slice through a generating cell with a shroud echo with example particle types present. The shroud of large ZDR and low ZH values (yellow color) indicates the presence of pristine anisotropic crystals with platelike or dendritic habits. The core of the generating cell (bluish color) is characterized by more snow aggragates or rimed crystals, the larger of which are descending (blue dashed lines) The core is also where the strongest updraft speeds (and thus supersaturations with respect to ice) are located, indicated the black vertical arrow).
In Kumjian’s JAMC article, a conceptual model of a vertical slice through a generating snow cell reveals example particle types. The yellow color indicates the presence of pristine anisotropic snow crystals with platelike or dendritic habits. The core of the generating cell (bluish color) is characterized more by snow aggragates or rimed crystals, the larger of which are descending (blue dashed lines) The core is also where the strongest updraft speeds (black arrow) are located.