AMS 2025 Session Highlight: WRN Asks “What If…?”

Graphic text that says, "WRN (w/20Society & 13WWCE) Asks ... What if ..." Text is in a speech bubble surrounded by cartoon clouds and a phone showing the AMS 105th Annual Meeting and WRN (Weather Ready Nation) logos.

For the third year in a row, the AMS Symposium on Building a Weather-Ready Nation (AMSWRN) will host its highly successful, highly interactive “WRN Asks: What If?” session to kick off its program at the AMS 105th Annual Meeting. “WRN Asks: What If…?” takes place at 8:30 a.m. CT on Monday, 13 January, 2025. We spoke to Trevor Boucher, AMSWRN co-chair, about why this session is unique, and why AMS attendees from all disciplines should take part. To learn more about this session and its origins, read our spotlight post from the 104th Annual Meeting.

Why host an interactive session like this?

Trevor: We want our audience to be interacting and collaborating when they all get in the same room once a year. What are those elephant-in-the-room topics that are larger in scale and scope than a single research project or study? More importantly, what are the implications of those topics? 

Since 2013, AMSWRN has brought together meteorologists and other Weather, Water, and Climate Enterprise partners to discuss efforts in advancing what it means to be “Weather-Ready.” We have hosted oral presentations, posters, panels, town halls, and more. But the Weather Ready Nation initiative is about changing how society looks at the weather every day, and how our nation thinks and responds to the environment around us. We are talking about evolving the entire weather paradigm, which means we really need to engage with our stakeholders. This in turn means we have to ask ourselves three crucial questions when it comes to learning and getting input: are we doing things right? Are we doing the right things? And how do we even know what is right? That is why the WRN Symposium will open with the 3rd iteration of a special, interactive session, “WRN Asks: What If…?” which goes beyond the normal conference formats to really get people thinking and facilitate discussion.

What are your goals for the session?

Trevor: The session design fits into a transformative learning model, which we published in the August 2024 issue of Bulletin of the AMS with the encouragement of Dr. Justin Sharpe, one of our first “What If…” session leaders. We aim to understand the forces shaping our sciences, and explore how the enterprise may evolve depending on what changes and what stays the same.

We hope to achieve two main goals: 1) inspire the audience, especially the students in attendance, to keep the “big-picture” in view and encourage double and triple-loop thinking, and 2) inform our call for papers in future years with special sessions called “What Now?” in which we explicitly solicit abstracts in the realm of the previous year’s “What if…” discussions.

What’s in store for attendees at the 2025 session of “WRN Asks: What If…?”

Trevor: We designed this session as a “reverse panel”, where moderators provide a 3-5 minute “state of the science” with respect to their backgrounds and propose an open-ended, “What if…?” question to the audience. Then their role shifts to moderating audience discussion for the remainder of their time slot. So although you see specific speakers on our agenda, they do the least amount of the speaking. The audience are the true panelists, sharing their opinions, their knowledge, and their concerns about these questions. We also make sure to get as much input as possible from students and early career professionals.

Last year’s session was extremely successful, with 60-80 attendees and very active discussions. This year—because we kept having to cut off the discussions last time around!—we have reduced the number of questions to three, to give each question a little more discussion time during our 90-minute session. We have also partnered with the 20th Symposium on Societal Applications: Policy, Research and Practice and the 13th Symposium on the Weather, Water, and Climate Enterprise as a Joint Session this year. Each participating symposium is contributing one “What if…” question and speaker to the discussions. The questions include:

“What if…we never issued weather warnings?”
Dr. Danielle Nagele (NWS Social Scientist) 

“What if…social media was suddenly banned?”
Devon Lucie (Broadcast Meteorologist, WDSU New Orleans)

“What if…all weather observations didn’t suck?”
Garrett Wheeler (Campbell Scientific)

I’ve been on all our coordination calls and dry runs and we have had to cut short our own conversations each time because we just can’t help but discuss these important questions — and that’s just 6-7 of us. I really think AMS attendees will find it to be an invigorating way to begin their week in New Orleans.

About the AMS 105th Annual Meeting

The American Meteorological Society’s Annual Meeting is the world’s largest annual gathering in the weather, water, and climate spheres, bringing together thousands of scientists, other professionals, and students from across the United States and the world. Taking place 12-16 January, 2025, the AMS 105th Annual Meeting will highlight the latest scientific and professional advances in areas from extreme weather to environmental health, from cloud physics to space weather and more. In addition, cross-cutting interdisciplinary sessions will explore the theme, “Towards a Thriving Planet: Charting the Course Across Scales.” The meeting takes place in New Orleans, Louisiana, at the Ernest N. Morial Convention Center, with online/hybrid participation options. Learn more at annual.ametsoc.org.
What’s the Value of a Weather Forecast?

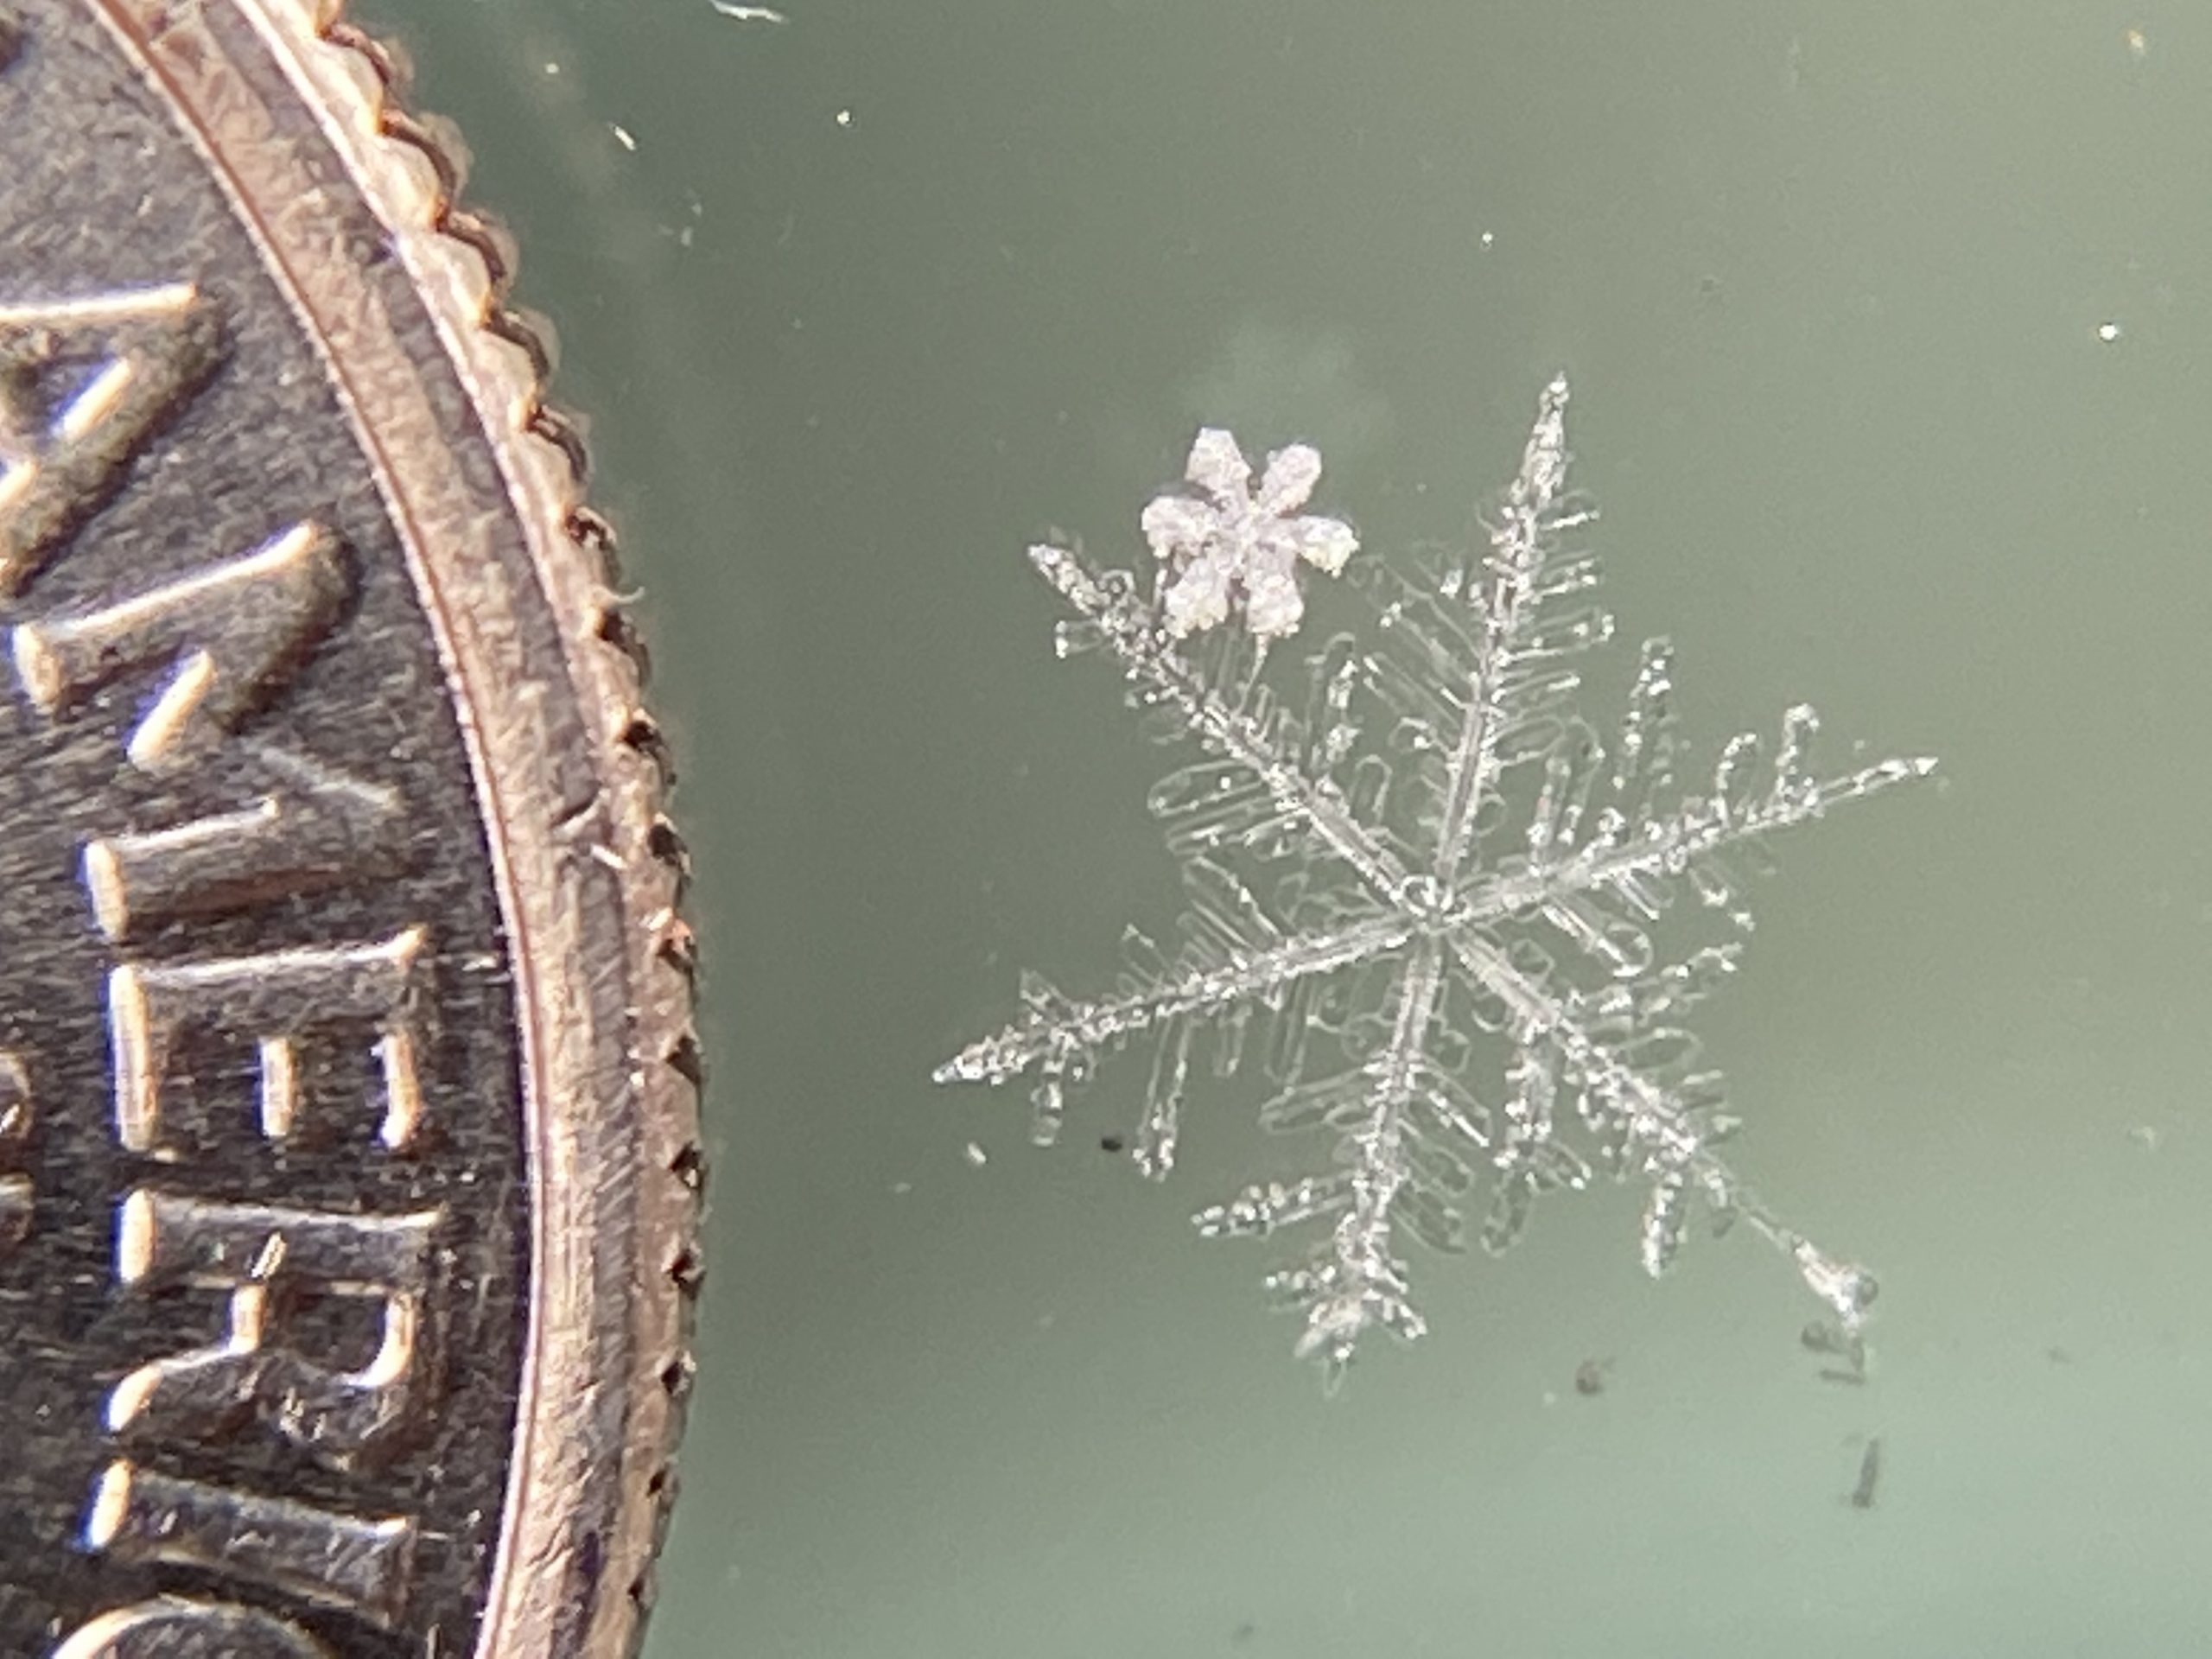
"Colorado Flakes" by Henry Reges

Highlights from the CoFU2 study: Part 2

By Jeffrey K. Lazo

This is part two of my summary of the Communicating Forecast Uncertainty (CoFU) 2 study, a follow-up (based on a 2022 national survey) to the 2009 CoFU 1 study that examines how the U.S. public gets, perceives, uses, and values weather forecasts. In part one we discussed key findings and delved a bit deeper into who uses forecasts the most, what they use forecasts for, and where they get their forecasts from. Read part 1 here.

In this post, we’ll examine public satisfaction with weather forecasts, what people most want from a forecast, and how much money the general public thinks a forecast is worth.

How satisfied are people with weather forecasts?

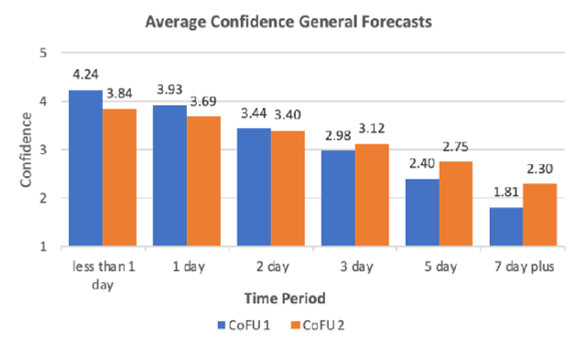
As shown below, people are more satisfied with weather forecasts than before. Overall, satisfaction with weather forecasts on average was 4.03 on a 5-point scale (significantly higher than the 3.78 average in 2006). People with higher education, Latinos, those who use city-specific weather forecasts, and those who access forecasts purely out of interest were more satisfied. People who spent more leisure time outside or used forecasts to plan social activities, however, were less satisfied.

Interestingly, however, there has been a slight decrease when it comes to confidence in weather forecasts—specifically short-term (1-day) weather forecasts. Confidence in 3-day and longer forecasts increased between 2006 and 2022. We don’t know exactly why, and are curious to further explore this question. I am particularly interested in examining whether these changes in public perception actually track with differences in forecast performance.

Average Confidence in Forecasts by Time Period and Survey Version 

Notes: The survey question asked, “How much confidence do you have in weather forecasts for the times listed below?” The times were listed as “Less than 1 day from now, “1 day from now,” and so on, out to “7 to 14 days from now.” (CoFU1 n = 1,465; CoFU2 n = 1,092). Source: CoFU2, Figure ES-5.

What weather factors matter most to people?

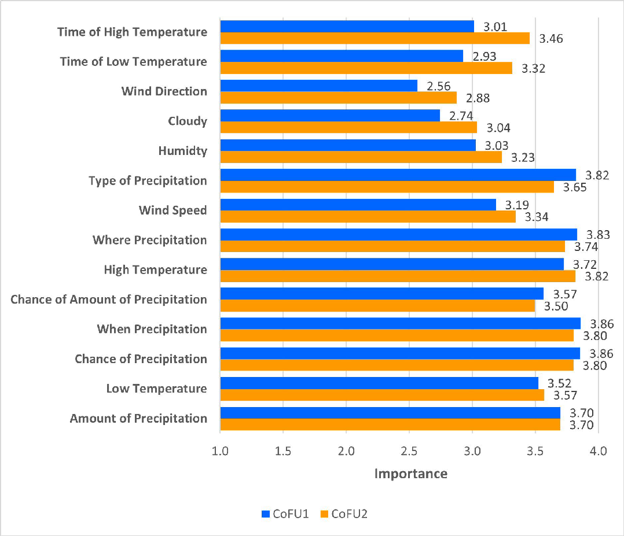
We asked survey respondents which components of a weather forecast were most important to them. In 2006, people most wanted to know when precipitation was going to occur. In 2022, however, high temperature took the top spot. This reflects an overall preference for precipitation information in 2006 vs. temperature information in 2022. That preference could be related to climate shifts, or it may simply be a reflection on when the surveys took place (November in 2006, May in 2022).

Mean Importance of Forecast Attributes Ranked by Difference between Surveys 

Notes: The survey question asked, “How important is it to you to have the information listed below as part of a weather forecast?” (CoFU1 n = 1,465; CoFU2 n = 1,092). Source: CoFU2, Figure ES-7.

How do people value weather forecasts?

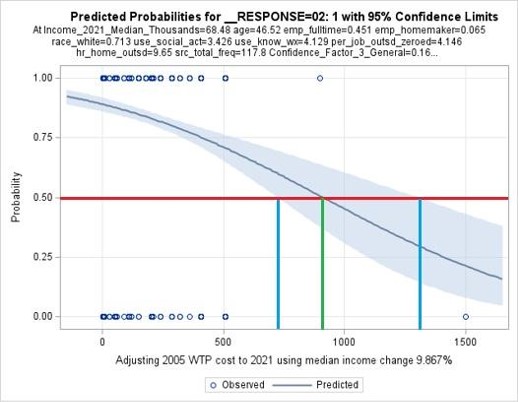
We assigned each respondent a dollar value that they might hypothetically pay in taxes each year to support NWS products and services (including forecasts). We then asked whether NWS services were worth that amount, worth more, or worth less. Using those responses, we calculated the likelihood of saying it was worth that amount for each dollar value, and then calculated the median willingness to pay for weather forecasts as $898.50, with a 95% confidence interval of approximately $700-$1,300 per household per year as shown below.

Fitted Demand Curve for Current Weather Forecast Information

Notes: The survey question asked “Do you feel that the services you receive from the activities of the NWS are worth more than, exactly, or less than $N a year to your household?” (CoFU2 data only n = 1,094). Source: CoFU2, Figure ES-10.

On average, people who were older, who were employed full time or were homemakers, who were white, who spent more recreational time outside, who used forecasts for social activities or just out of interest, and who highly valued knowing the daily high temperature were all less willing to pay for NWS forecasts. Those who spent more working time outside, used forecasts more frequently, placed more importance on NWS information, had more personal weather impacts, considered wind and cloud information more important, and who had greater total weather salience (a measure of attunement to and awareness of weather) were all more willing to pay for current forecasts. Related to the Cultural Theory of Risk, people who were identified as “individualists,” based on cultural risk theory, were significantly less likely to be willing to pay for forecasts. Individualists may perceive themselves to be less at risk from weather events.

If we can take the $898.50 median value as the average household willingness to pay, we can then aggregate this across the entire US population of about 120 million households. Accounting for the portion who say they don’t use forecasts, we calculate a total value to the US of about $102.1 billion for current weather forecast information. 

Like any large-scale study of human beings, this analysis has tried to be as representative and accurate as possible—and yet almost certainly has potential gaps. Hopefully CoFU2 provides a useful picture of weather forecasts and the U.S. public, but its results should be replicated and further studied if they are to be used to inform any real-world decisions. Access to weather information can be a life-and-death matter, and no decision about that should be taken lightly. Read the full study here.

Photo at top: “Colorado Flakes,” by Henry Reges, was a finalist in the 2022 AMS Weather Band Photo Contest.

How Does the U.S. Public Get its Weather Forecasts?

Photo, 'Striking Sunset'

Highlights from the CoFU2 Study: Part 1

By Jeffrey K. Lazo, PhD

In 2006, I, my National Center for Atmospheric Research (NCAR) colleagues Julie Demuth and Rebecca Morss, and Alan Stewart of The University of Georgia began designing and implementing a national study of weather forecast users. We wanted to understand how people are getting their forecasts, how they’re using them, and how much they’re worth to people. 15 years after that study was published, I have released the follow-up study: Communicating Forecast Uncertainty (CoFU) 2. Using essentially the identical 2022 survey, I replicate and extend the findings from the first survey for another look at the public’s relationship with weather forecasts. We believe that our 2022 survey reached a more representative proportion of the U.S. population, including younger adults and certain racial groups, compared with the survey in 2006. 

In this post–part one of two–I delve into a few of the key takeaways.

The big picture

This study estimates that members of the U.S. public access weather forecasts roughly 317 billion times per year—a 7.26% increase since 2006, driven largely by the increase in U.S. population. There was also a significant increase, however, in the number of survey respondents who said they never used weather forecasts. If this result is real, and not just an unusual result of the repeated survey implementation, it would be very important to understand why. Overall, people rated their satisfaction with weather forecasts high, but confidence in short-term (1-day) forecasts has decreased, while people were more confident in longer-term forecasts. 

To get their forecasts, people continue to shift toward sources like web pages and cell phones, from which they specifically seek out weather information, rather than more “passive” sources such as TV and public/private radio broadcasts. 

The estimated monetary value of forecasts to the U.S. public is $102.1 billion (which comes out to about 32 cents per forecast use). However, our approach to obtaining this value was limited, and we feel it should be used only as an estimate of the overall strength of people’s preferences for the information pending more rigorous studies.

Who’s using weather forecasts, and what for?

People with the following characteristics were more likely to say they used weather forecasts: Higher income, female, more highly educated, White, Black, Asian, Native, and those who spend leisure time outdoors.

The percentage of the surveyed population who said they never used weather forecasts increased from 3.62% in 2006 to 9.15% in 2022, a statistically significant difference. This was a basic yes/no question, so we don’t have good information about what people mean when they say they don’t use weather forecasts at all. It’s also possible that our latest survey did a better job of reaching people who don’t use weather forecasts. As noted above, if there has been a real decline in the number of people using forecasts this should be examined in more detail to determine why. 

According to the survey, the most common reason people checked a forecast was simply to know what the weather would be like (they may be simply monitoring the weather in case their plans change or the weather shifts dramatically). The next most common uses were for weekend activities, getting dressed, social activities, and travel. Job-related activities and commuting ranked last.

How and where are people getting their forecasts?

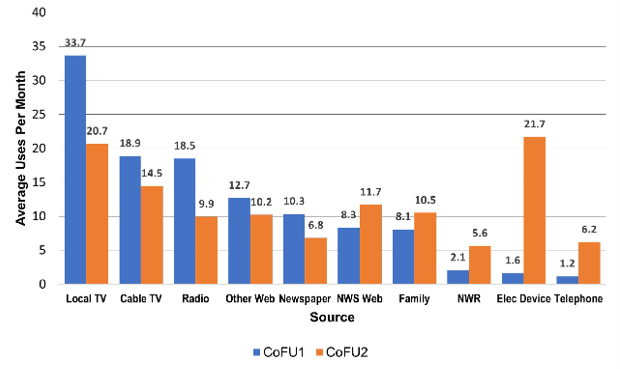
As shown in the figure below, usage of weather forecast sources such as TV, commercial and public radio, and newspapers has decreased since 2006. Notably, these are sources which tend to be more traditional and more “passive,” in that you may come across weather information without specifically looking for a forecast. Meanwhile, the use of more “modern” sources like NWS web pages, phones, and other electronic devices increased, along with the use of social connections and NOAA Weather Radio to find out about weather information. These days, people who use weather forecasts appear to be more likely to actively seek out this information.

Frequency of Use by Source by Survey Version 
Notes: The survey question asked, “How often do you get weather forecasts from the sources listed below?” Response options ranged from “Rarely or never” to “Two or more times a day,” and were conservatively recoded into times per month. (CoFU1 n = 1,465; CoFU2 n = 1,092). Source: CoFU2, Figure ES-2.

The number of times that the average person accessed weather information each month slightly increased between 2006 (115.4) and 2022 (117.8), but the difference was not statistically significant. Time of forecast access has shifted slightly earlier in the day on average, which we suspect may be related to the shift away from TV forecasts, or possibly an increase in people who work from home since the onset of the COVID pandemic.

Tune in for part 2 of this summary to learn more about what people are looking for from weather forecasts, and how we arrived at an economic value for those forecasts. Or, you can read the full study here.

Photo at top: “Striking Sunset,” by Liz Kemp, was an entry in the 2023 AMS Weather Band Photo Contest.

Beach Safety for Broadcasters

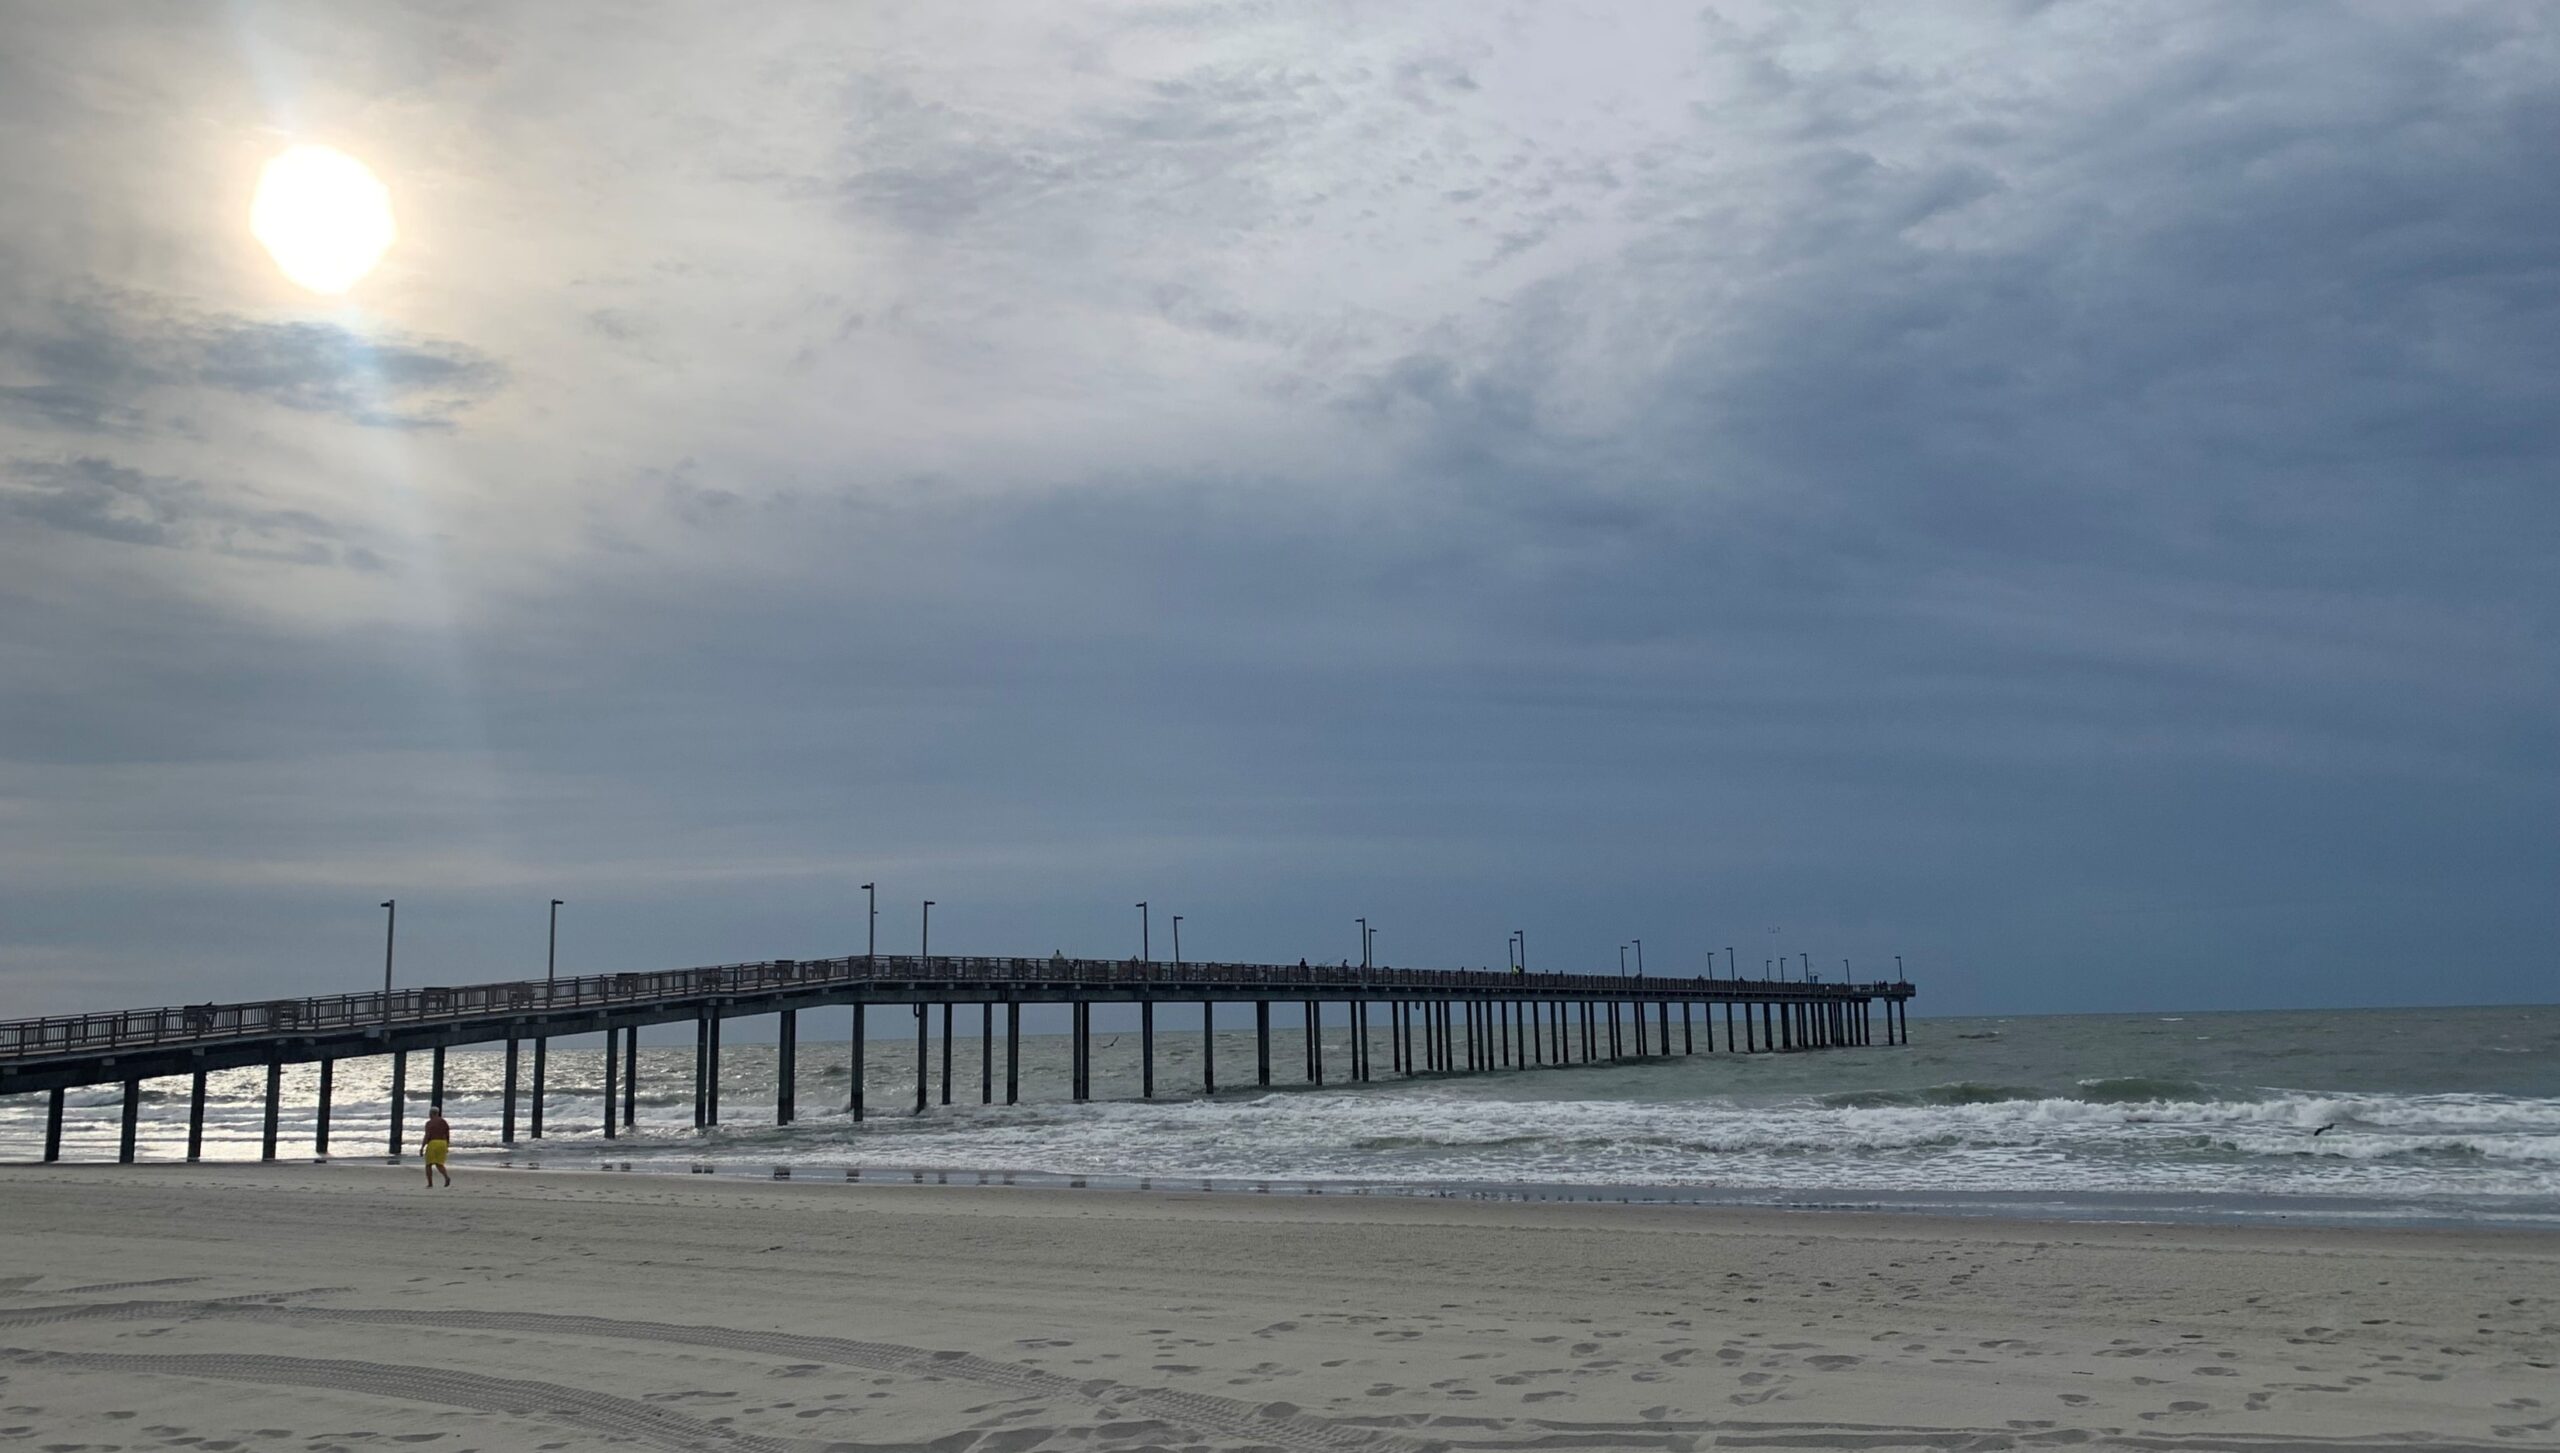
A pier at Myrtle Beach

A session highlight from the 51st Conference on Broadcast Meteorology/7th Conference on Weather Warnings and Communication

By Katie Pflaumer, AMS staff

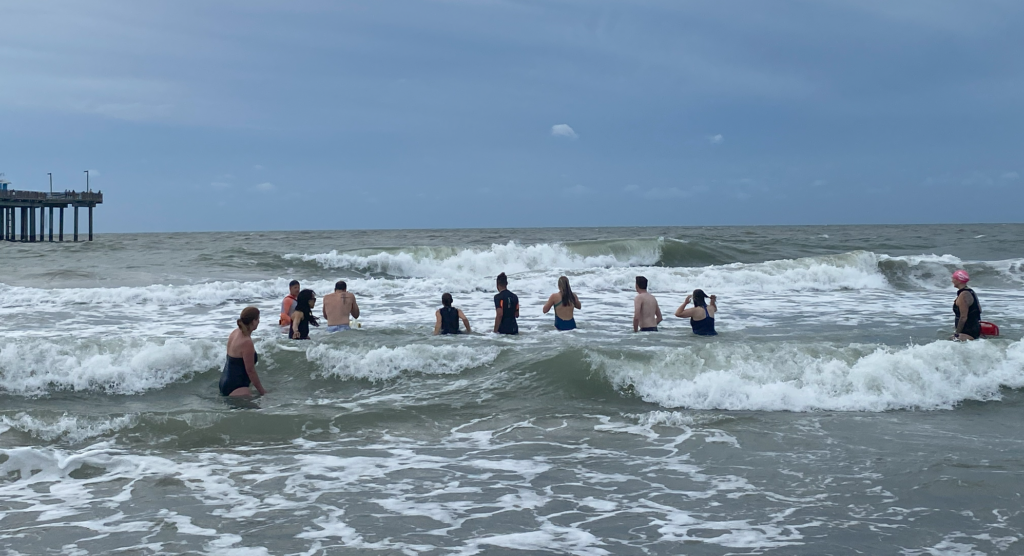
The ocean looked aggressive. It was 6:45 a.m. on June 13 in Myrtle Beach, South Carolina, and my weather app was warning me about the possibilities of dangerous currents. A coastal hazard statement was in effect.

The waves—dark under early-morning cloud—pulled and crashed messily, much stronger than they’d been the day before. Some were coming in at an angle, bending southward down the beach. Whitecaps littered the water’s surface and the air was loud with the waves and wind. 

Bruckner Chase was thrilled. “These are exactly the kinds of conditions we’re trying to teach you about,” he said.

I’d met up with him on the beach, along with his NOAA Wave Safe program colleagues Dr. Michelle Evans-Chase and Patrick Roach, other AMS staff, and several broadcast meteorologists who’d signed up for the “Blue IQ: Water, Waves, Weather and Coastal Safety” course at the 51st Conference on Broadcast Meteorology/Seventh Conference on Weather Warnings and Communication. It was an unusual meeting session, organized to help weather communicators—especially broadcast meteorologists—better engage with the public about beach safety. 

What follows are a few takeaways from that morning, and from a later Weather Band webinar that recapped the session.

As we walked gradually towards the surf, our discussion focused on the three “zones” of ocean safety—the safe zone, the awareness zone, and the impact zone. There are important things to pay attention to in all three.

Safe Zone

The safe zone—far back from where any waves might reach—is a place to take inventory and get the lay of the land, as well as making sure you have all the supplies you may need.

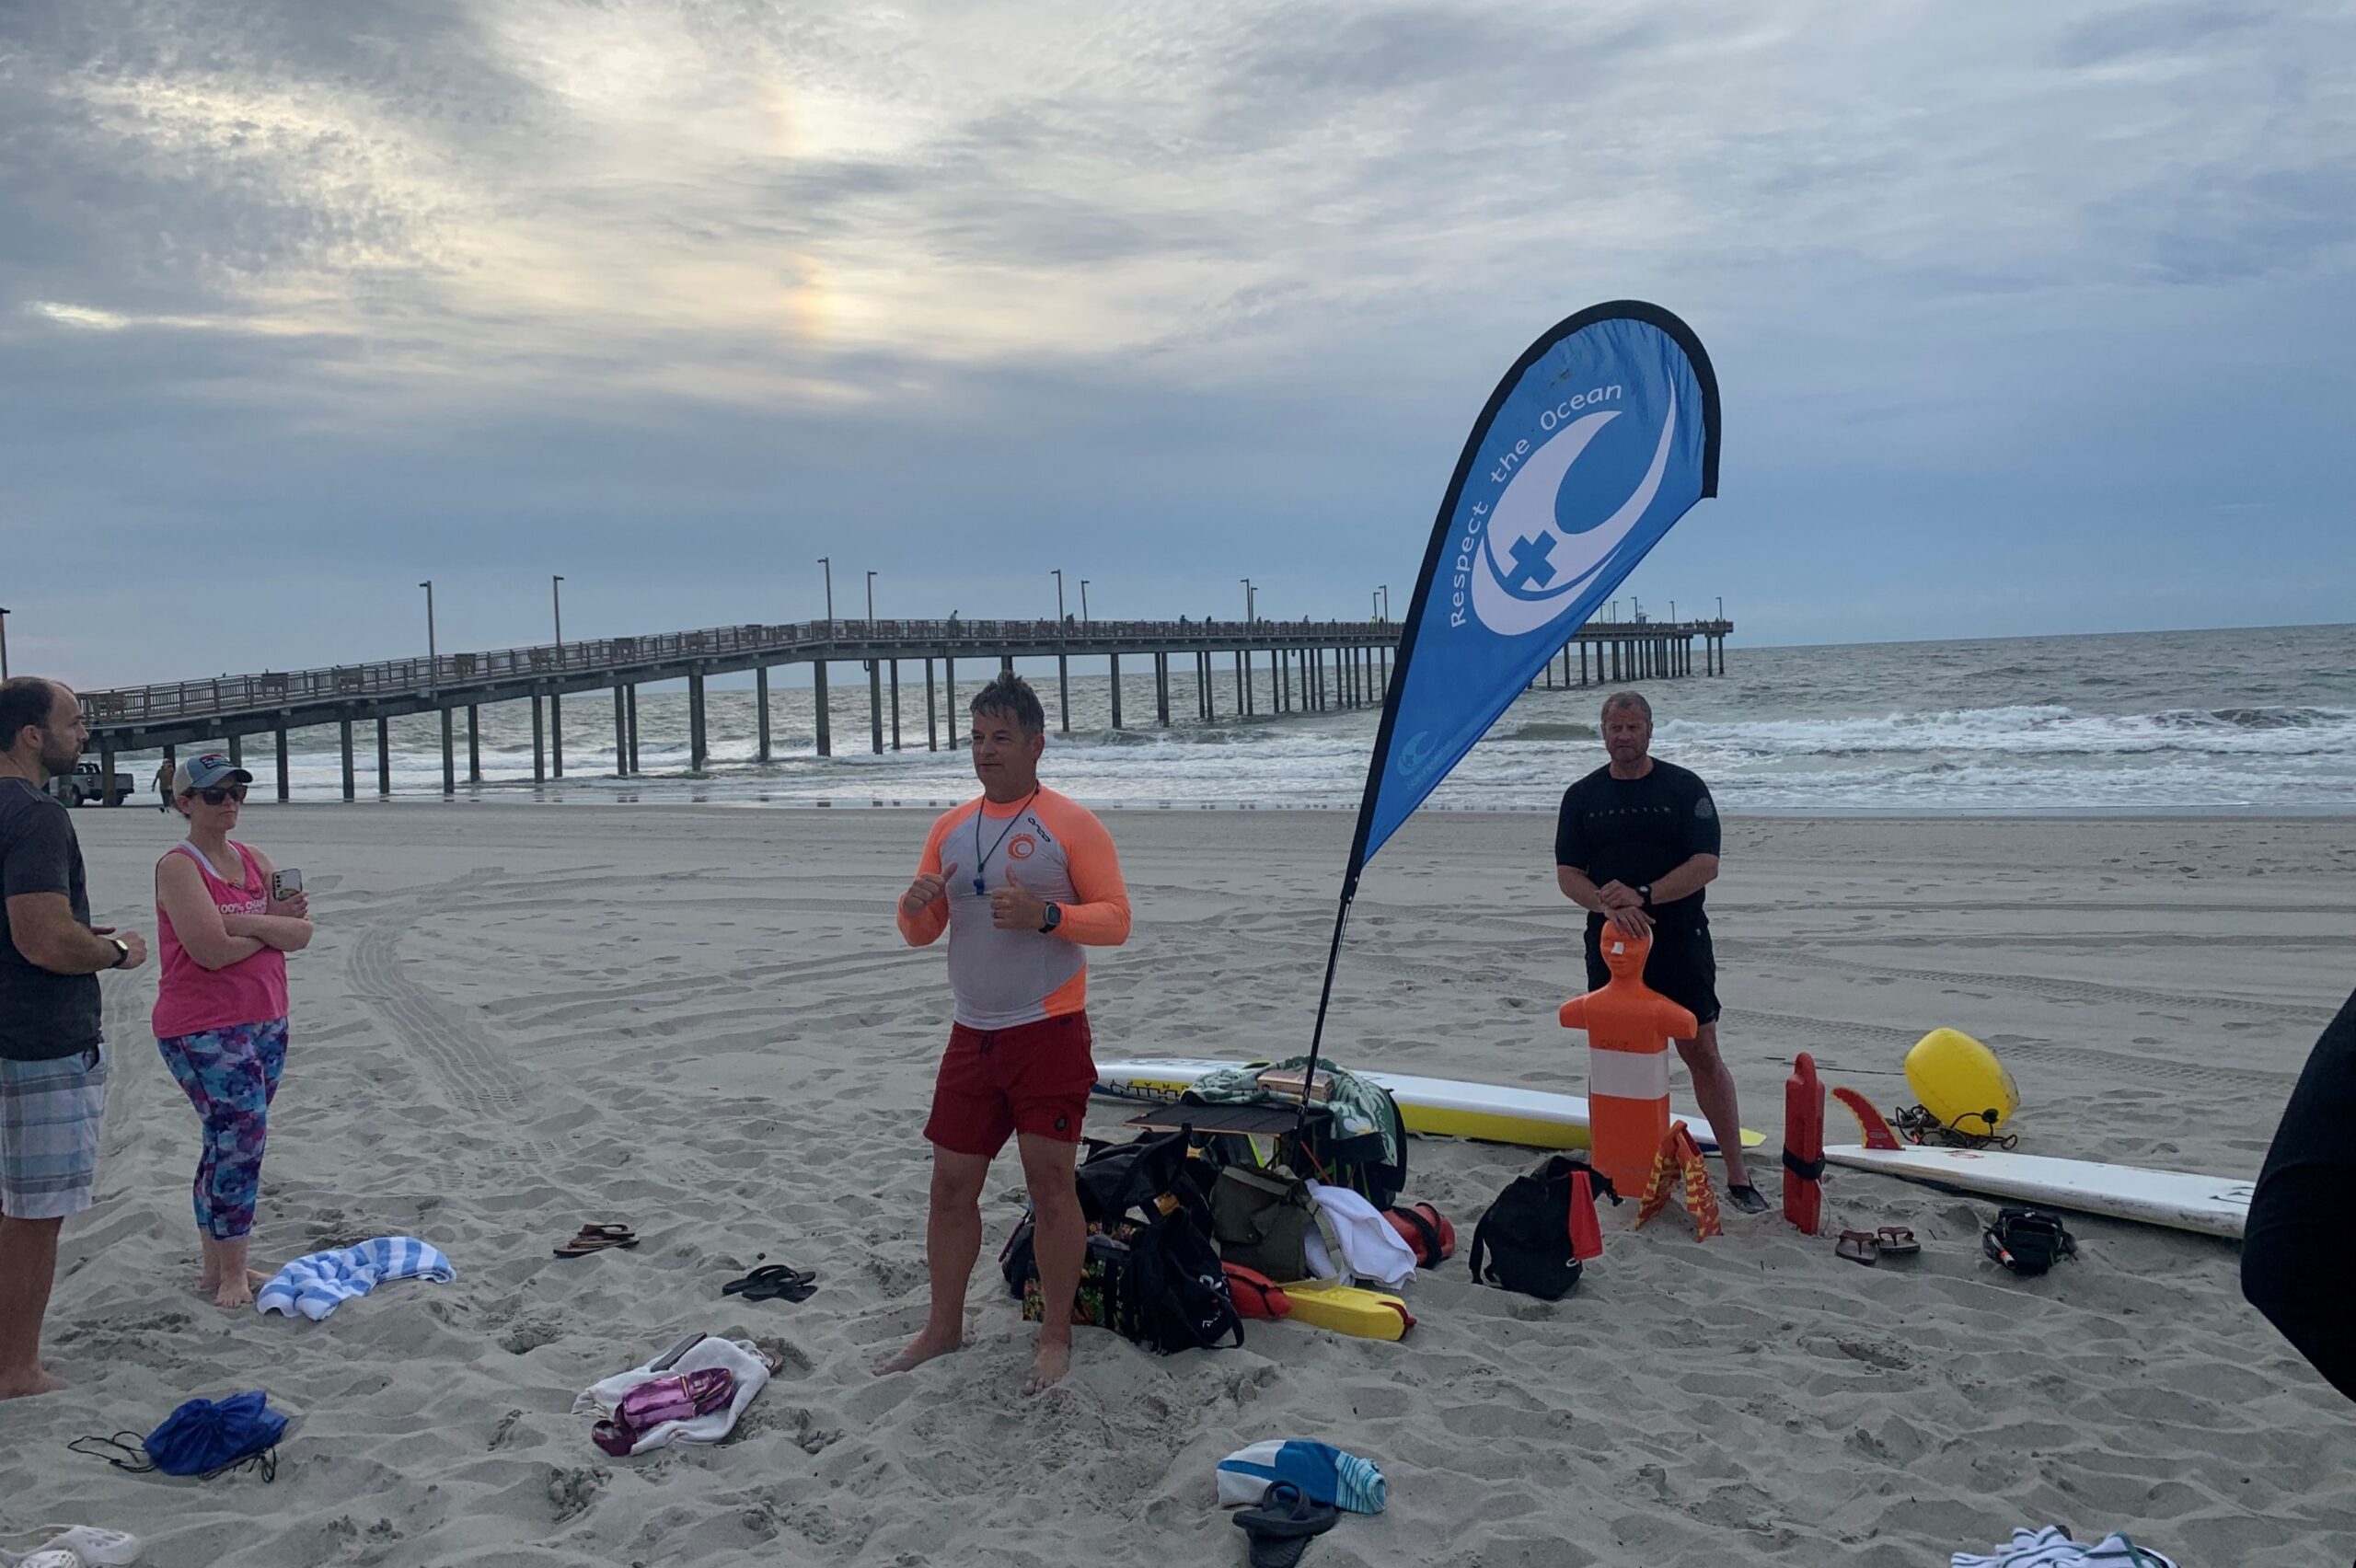
Bruckner Chase (center) and Patrick Roach talk to BlueIQ participants.
Bruckner Chase (center) and Patrick Roach talk to BlueIQ participants in the Safe Zone. Photo: AMS staff.

Wait and Watch. The ocean, as Chase noted, is a constantly changing environment. The most important thing you can do is to pay attention. “Every beach is different [and due to tidal changes], that beach is also different from morning to afternoon,” said Chase during the webinar. “[If] you’ve got a sandbar that was under 3 feet of water and is now under 6 inches … now it’s become dangerous.” 

Note any hazards (like piers or areas where waves are breaking strangely) and think about the height, direction, and roughness of the waves. Wind direction will impact wave behavior, and winds coming from the ocean or along the beach can make for more challenging conditions. Take time to observe what’s happening.

“Many people will look [at the waves] for a minute or two and go, oh, it’s fine. I watch the water 10 to 15 minutes at least, because waves will come in sets, conditions will change, it’s not always the same.”

—Bruckner Chase

Listen to the Experts. Lifeguards and surfers are often great sources for information about your beach. Always swim near lifeguards and pay attention to any signs or messaging about when and where you can swim safely. 

Weather Aware. Conditions at the nearest weather reporting station may not reflect conditions at the coast. For example, in early summer, cold water and warm air can create dense fog right along the beach. “It can get to where you can’t see the shore,” said Michelle Evans-Chase. Weather communicators can help make their audience aware of these possible localized events. 

Yet the general weather forecast is still important. If a storm is approaching, for example, people need to know to get out of the water and off the beach, as lightning can strike miles ahead of a storm. 

Hazards and Tides. Your weather forecast office may also issue information about beach hazards. They had done so for Myrtle Beach today: strong longshore currents (running parallel to the beach) were highly likely, and rip currents (which can pull swimmers out towards the ocean) were moderately likely. Weather reports may also list the times of high and low tide, which can dramatically impact water conditions due to depth changes across sand bars or submerged hazards. Be careful around inlets when the tide is changing; strong tidal-driven currents may funnel through calm-appearing waters.

From our vantage point the day of the session, we could see signs of the longshore current scrambling the waves. Beach forecasts often include rip current risk, but longshore currents can also be very dangerous, sweeping you down the beach and making it hard to get back to shore. If you’re on a small beach surrounded by more challenging terrain, such a current could even drag you past the safe landing area. A final note on the safe zone: Make sure you know where it actually is. “Sneaker” waves—unusually large waves—may come much farther up the beach than expected. On rocky shorelines (common in the Pacific Northwest), these waves can pull people off the rocks into very cold water. The same can happen on piers and jetties. Even if a vantage point appears safe, heed any signage telling you not to go out there, and always pay attention to what’s happening in the water.

Awareness Zone

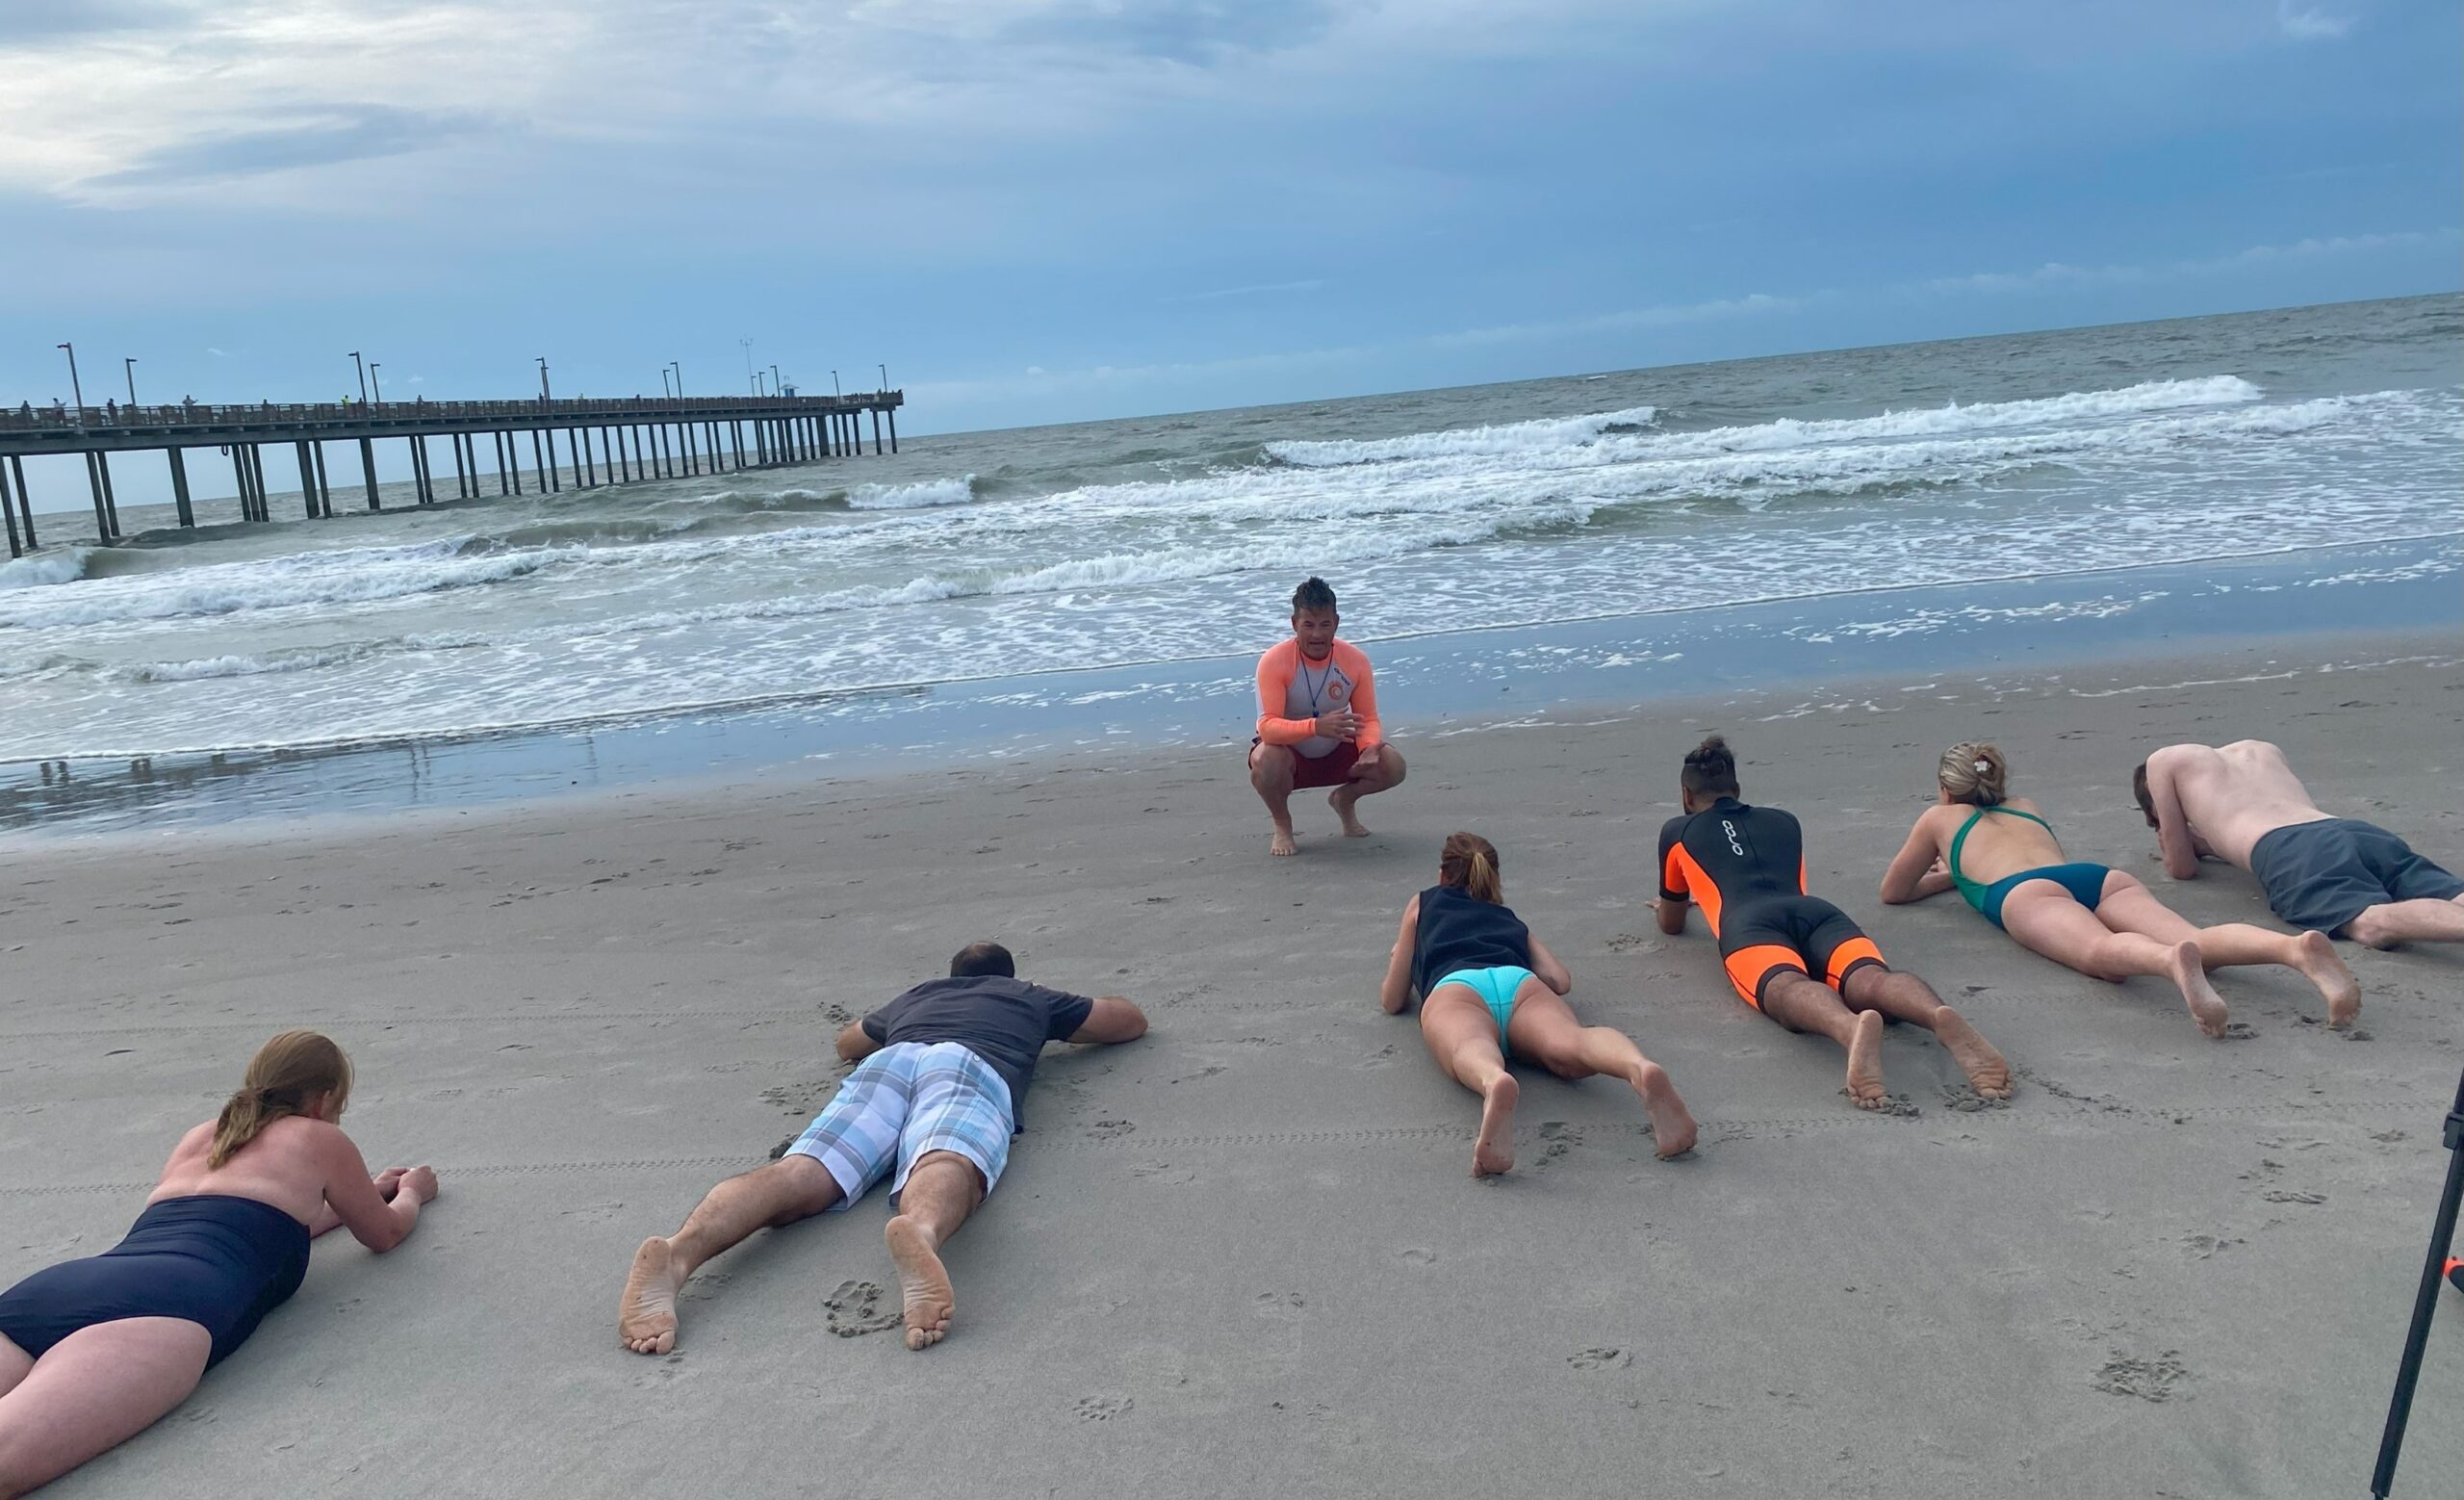
Once you walk closer to the surf, you’ll have a better sense of what your ocean experience will be like. When our little class left the area of the dunes, we were less shielded from the wind, and the waves seemed louder and taller than when we’d looked at them from above. Chase had us all lie down near the edge of the water, noting how large two- or three-foot waves can seem once you’re in them. Getting hit by even a smallish wave at the wrong angle can cause serious injury, so never underestimate surf.

“If … it’s your first trip to the beach, two feet doesn’t sound like much. … But a mass of water moving at you every six seconds that’s two feet high is a lot different and harder to navigate.”

—Bruckner Chase
People lying down at the water's edge
Blue IQ session participants lie down at the edge of the water for a different perspective on the day’s waves. Photo: AMS staff.

Prepare to get in the water by orienting yourself. Line yourself up with a very specific landmark—pick something colorful and uniquely shaped that you can look back and easily identify (we used the water slide in front of our hotel). This is also important in an emergency, as EMS will need to know where to enter the beach to get to you.

Impact Zone

The impact zone, more technically known as the swash zone, is where waves are washing up on the sand and receding. This is where you’re getting into the water. 

Be Prepared. Depending on water temperature, be prepared for a cold shock that could impact motor function. As Chase reminded us, “If you’re in a dangerous situation [and numb from the cold], you may lose the ability to effectively move out of it.” Be aware that the beach can drop off rapidly, and you could suddenly find yourself deeper than expected.

Move Efficiently. Chase outlined techniques for making efficient progress through the surf and conserving energy. Walking in sideways means less of your body has to fight through a wave. Diving underneath approaching waves can be another good way to make progress; things are much more peaceful under the water. Stick your fingers in the sand to make sure you go deep enough and to help you stay oriented.

Remain Calm. Chase’s techniques worked well, yet we all struggled to get out into waist deep water the morning of the session. The longshore current pulled relentlessly, and the waves—which hit us every few seconds as they piled up close to shore—made me grateful to be surrounded by trained lifeguards. Even with our feet mostly on the ground, we were soon swept 30-40 meters down the beach. If we’d gone out further, the currents might have made it hard to get back in.

BlueIQ participants wade in the ocean
Blue IQ session participants wade in waist-deep water. Photo: AMS staff.

If you’re caught in a rip current, standard advice is to swim perpendicular to the direction the current is moving you to escape this narrow, ocean flowing band of water (which will normally weaken once you get further out). Then, carefully swim at an angle towards the shore, always being aware of large waves that may be coming up behind you. 

If you’re struggling in a longshore/long beach current, however, the best course of action is to head directly for the beach, which will be perpendicular to that current. Don’t worry too much about exiting the water exactly where you started—just get out where you can. Chase noted that while many people have heard what to do in a rip current, few are aware of the strength of longshore currents that can move you hundreds of yards or more along a beach.

Even if you’re a strong swimmer in the pool, don’t expect to feel equally strong and fast in the ocean, even on a calm day. “Most swimmers are going to have trouble navigating these dynamic conditions and feeling as comfortable in the surf as they do at their local swimming pool,” Chase told us. So the key thing to remember in a dangerous situation is: relax. Stay calm and use your energy tactically. “Give people time to come and help you, for the EMS system to be activated, for a lifeguard to come and find you.” If you see someone in trouble, take 10 seconds to alert a lifeguard or 911 and find productive ways to help. Watch the NOAA Wave Safe “Take 10” video.

No matter what beach you go to, the philosophy is, respect the ocean. “Even if you’ve been visiting the same beach for 10 years and you know that break and you’re comfortable sending your kids out there, one nor’easter or one storm can dramatically change that,” said Chase. “So it’s not just [that] each beach is different, which it very much is, but that beach can also change from hour to hour and definitely from year to year.”

Learn More

Share NOAA’s Wave Safe videos to help your friends and family, or the public at large, understand beach safety concepts. 

View a news story by Blue IQ session attendee Jeremy Lewan, featuring some of his takeaways from the session.

Watch the Weather Band Webinar

Read Bruckner Chase’s Weather Band article for additional tips.

See experimental beach forecasts at Weather.gov/beach

More NOAA beach safety resources.

About 51Broadcast/7WWC

The 51st Conference on Broadcast Meteorology and Seventh Conference on Weather Warnings and Communication took place in Myrtle Beach, South Carolina, on 12-14 June, 2024, hosted by the American Meteorological Society (AMS). The 51st Conference on Broadcast Meteorology is organized by the AMS Board on Broadcast Meteorology and invites broadcast meteorologists from across the United States to network and share professional knowledge. The Seventh Conference on Weather Warnings and Communication features cutting-edge research on weather communication strategies, challenges, and impacts, and is organized by the AMS Board on Societal Impacts

“Once in a Generation”: The 2022 Buffalo Blizzard

Truck in snowdrift

A Research Spotlight from 32WAF/28NWP/20Meso

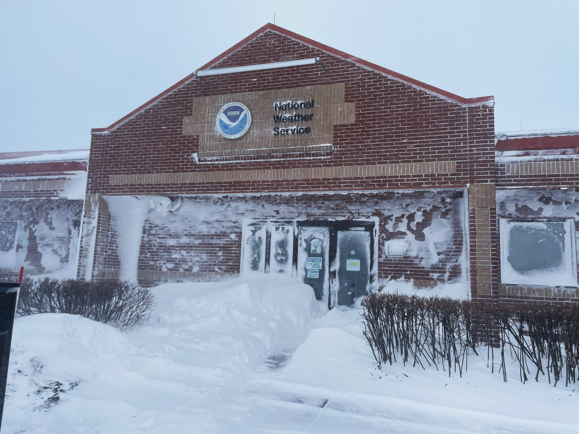
On 23 December, 2022, David Zaff of the National Weather Service’s Buffalo office walked out into a blank white world of howling wind. He headed to his car to get supplies, knowing there was no way to get home. He and his coworkers were trapped at the office, in the middle of one of the most deadly and disastrous blizzards Buffalo has ever seen.

Video by David Zaff, showing whiteout conditions outside NWS Buffalo office, December 23, 2022.

At the height of the 2022 holiday travel season, the four-day blizzard and lake-effect snow event knocked out power for more than 100,000 people, paralyzed emergency services and holiday travel, and left at least 47 dead. New York Governor Kathy Hochul described it as “the most devastating storm in Buffalo’s long, storied history.” Yet days earlier, Zaff and colleagues encountered skepticism from the public as they worked to warn the region.

Presenting at the J3 Joint Session at the 32nd Conference on Weather Analysis and Forecasting, the 20th Conference on Mesoscale Processes, and the 28th Conference on Numerical Weather Prediction, Zaff talked about the disaster and how the NWS countered accusations of hyperbole to get the word out.

Sounding the Alarm

The December 2022 snow was shocking, but not surprising. The pattern was easy enough to recognize, even 7–10 days earlier: a large high-pressure ridge forming over the western U.S., with a major trough in the east. “We knew something big was coming,” said Zaff. Five days before the storm, even low-resolution models suggested a major event. Four days ahead, the NWS started ringing the alarm bell. “We started saying, ‘A powerful storm will impact the region heading into the holiday weekend.’”

Three days out, the NWS issued an unusually emphatic Area Forecast Discussion (AFD):

“Some of the parameters of this intense storm are forecast to be climatologically ‘off the charts’ … One could certainly describe this storm system as a once in a generation type of event.”

NWS Lead Forecaster Robert Hamilton, Tuesday, December 20, 2022

That caused a stir, but many on social media dismissed it as hype. “People started saying, ‘There goes the weather service again,’” says Zaff.

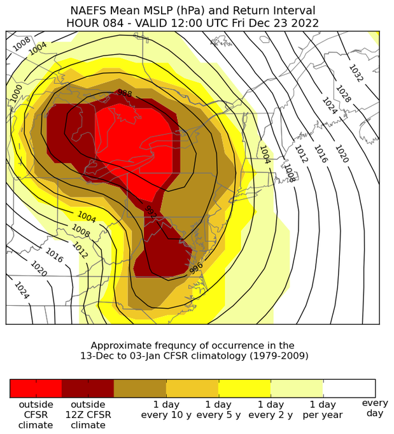
He tried to find a way to show the science graphically, highlighting the forecast as “‘outside’ the climatology” for the time of year.

The graphic and its accompanying description got attention. By then, NWS Buffalo was communicating in earnest, including on social media. A tweet with a text-filled screengrab of the Winter Weather Message received 485,000 views. “A picture is worth a thousand words,” Zaff said, “except when people actually read the words, and see how impressive this event might be.”

Left: Graphic showing forecast surface pressure for Friday, December 23, 2022, with shading showing the relative frequency of the forecast MSLP values in the Buffalo region at that time of year. Source: David Zaff.

Surviving the Storm

Before noon on 23 December, visibility dropped to near zero, and it remained that way until around midnight on 25 December. 500 Millibar heights were “extraordinary” as the pressure trough moved into the Ohio Valley, and surface-level pressure was similarly unbelievable. A top wind speed of 79 mph was measured in downtown Buffalo at 10:10 a.m. on the 23rd, and winds in the 60–70 mph range lasted for 12 hours. “[It was] just an incredible bomb cyclone,” Zaff said. “An incredible storm.”

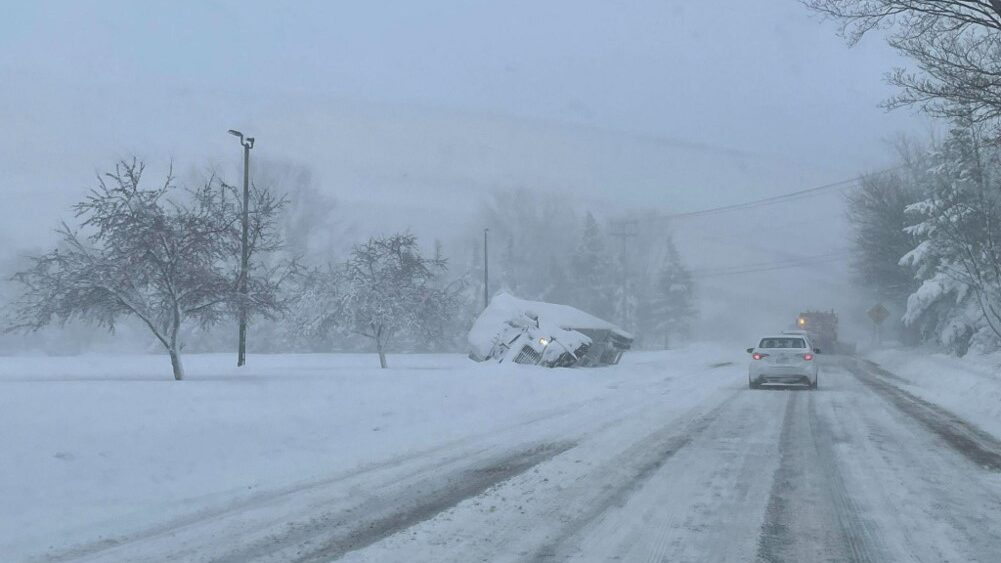
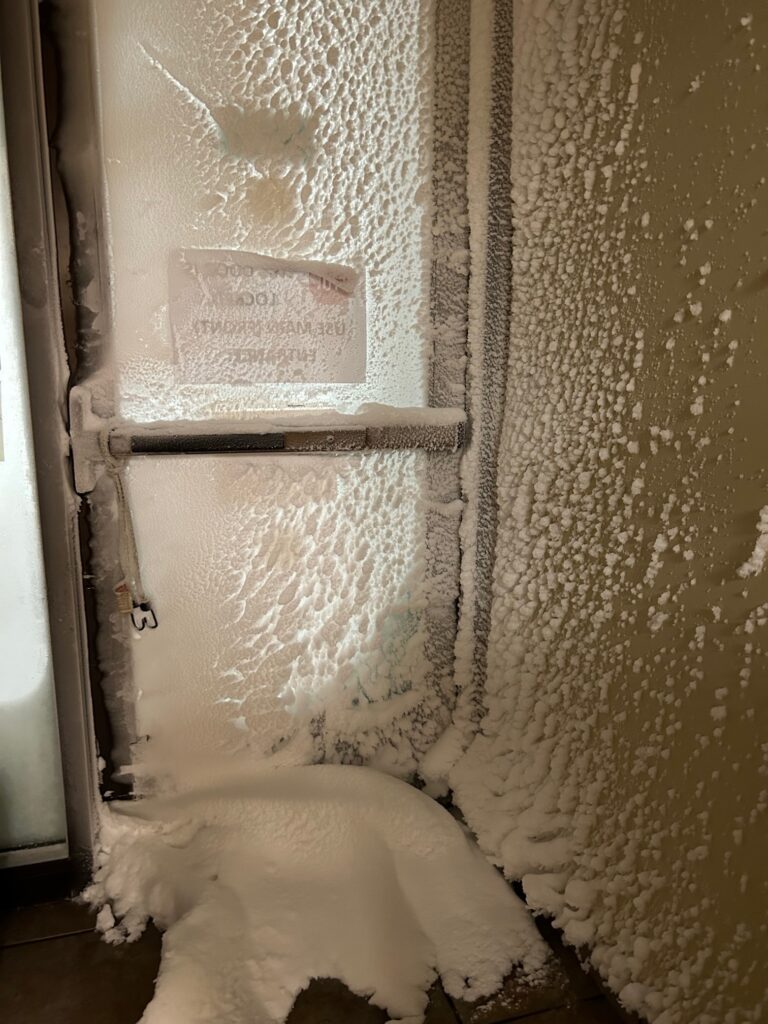
Zaff and some colleagues slept at the office; others attempted to drive in whiteout conditions using GPS alone, while some got stuck in drifts near the office and had to leave their cars to hike the rest of the way. Meanwhile, firefighters and airport employees worked to rescue motorists trapped nearby.

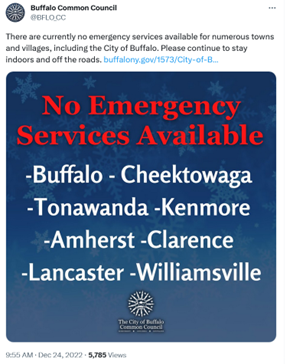
On December 24, the City of Buffalo issued “the scariest tweet I’ve ever seen,” said Zaff. The tweet stated that there were “no emergency services available” for Buffalo and numerous other towns.

“We knew by this time that there were fatalities occurring,” Zaff said. “And it just got worse and worse.”

Blizzard conditions lasted a full 37 hours–and lake effect snow wouldn’t stop for another two days. Three power substations shut down, frozen solid. Hundreds of power poles fell, and a significant percentage of locals were without power during the storm’s peak (some for days afterwards).

The 47 fatalities included people stranded outside, others who died from hypothermia in their homes, and some deaths due to delayed EMS response, according to Erie County. Hundreds of motorists were stranded on roadways during the storm. The Buffalo Niagara International Airport, with a proud legacy of operating under even the most horrific conditions, was closed for six days.

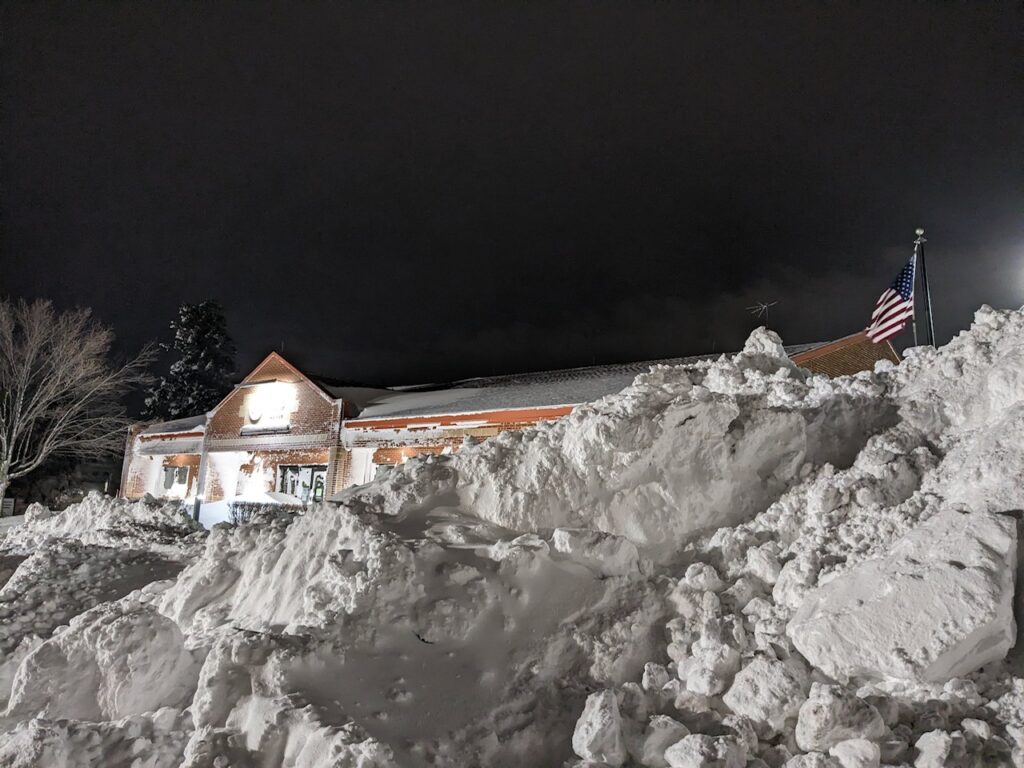
Zaff didn’t return home until late afternoon on the 25th, 18 hours after official blizzard conditions were over and having clocked 50+ hours at the office. On the drive, he saw iced-over buildings and trucks buried in snowdrifts. “It reminded me of [the movie] The Day After Tomorrow. … The impacts were tremendous.”

In his AMS presentation, Zaff compared the 2022 event to disastrous storms in 1977 (20+ fatalities, 69 mph winds, only 12” of snow yet drifts swallowed homes) and 1985 (5 fatalities, 53 mph winds, 33” snow), as well as the “Great Christmas Storm” of 1878, one of the first well-documented lake effect snow events, though lake-effect processes weren’t understood at the time. “This will likely be the storm of comparison now,” he says. “Once-in-a-generation” turned out to be right.

Future Lessons

Moving forward, said Zaff later, “Our intention is to further our relations with our Core Partners, including elected officials, emergency management, and the media [and] provide more probabilistic information that supports our ongoing Impact Decision Support Services. We hope to improve our outreach as well, instilling more confidence with the public.”

NWS will continue to provide improved decision support for partners, which may lead to more proactive road and school closures that could save lives in the future.

Photo at top: Buffalo roadways at 4 p.m. on December 25, 2022, 18 hours after blizzard conditions had passed. Photo credit: David Zaff.

About 32WAF/20Meso/28NWP

Predicting and understanding storms and other weather events is a complex business with real-world impacts. The American Meteorological Society’s 32nd Conference on Weather Analysis and Forecasting/28th Conference on Numerical Weather Prediction/20th Conference on Mesoscale Processes brought researchers, forecasters, emergency managers, and more together to learn about and discuss the latest scientific developments. The conferences took place in Madison, WI, and online 17–21 July, 2023. Recordings of the sessions are available here.

Recent Trends in Tropical Cyclone Fatalities in the United States

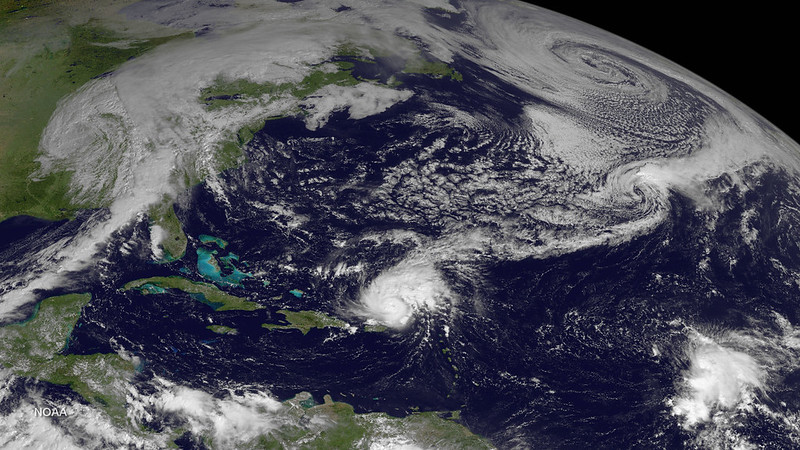
Satellite photo of Hurricane Gonzalo (a ball of swirling clouds) over the Atlantic near Puerto Rico; other larger cloud systems are seen in the upper part of the photo, eclipsed by the curvature of the Earth in the top right. Photo taken by GOES East satellite at 1445Z on October 14, 2014. Photo credit: NOAA.

New data from the past ten years reveal increased prominence of freshwater floods and indirect fatalities in hurricane deaths

Guest post by Dr. Michael Brennan, Director, National Hurricane Center; Daniel Brown, Warning Coordination Meteorologist, National Hurricane Center; and Leah Pope, Hydrologist, Northwest River Forecast Center

The National Hurricane Center’s mission to “save lives and mitigate property loss” is not just achieved by issuing effective watches, warnings, and forecasts of tropical cyclones. We also spend a large portion of the “offseason” educating the public, emergency managers, and our media partners about the risks that tropical cyclones (TCs), including hurricanes, pose to life and property in the United States. Those include natural hazards such as storm surge, wind, and rip currents, and also includes dangerous conditions in the aftermath of a landfalling tropical cyclone, which may lead to “indirect” fatalities. These are deaths which are not directly due to the forces of the storm, but which would not otherwise have occurred. NHC routinely compiles and assesses TC-related information through vehicles such as our Tropical Cyclone Reports (TCRs). Data from the most recent decade reveal that fatality trends may be changing.  

Note:  The fatality data presented here do not include any fatalities from Hurricane Maria in Puerto Rico, since there was no specific, definitive cause provided for those deaths.

Direct Fatalities

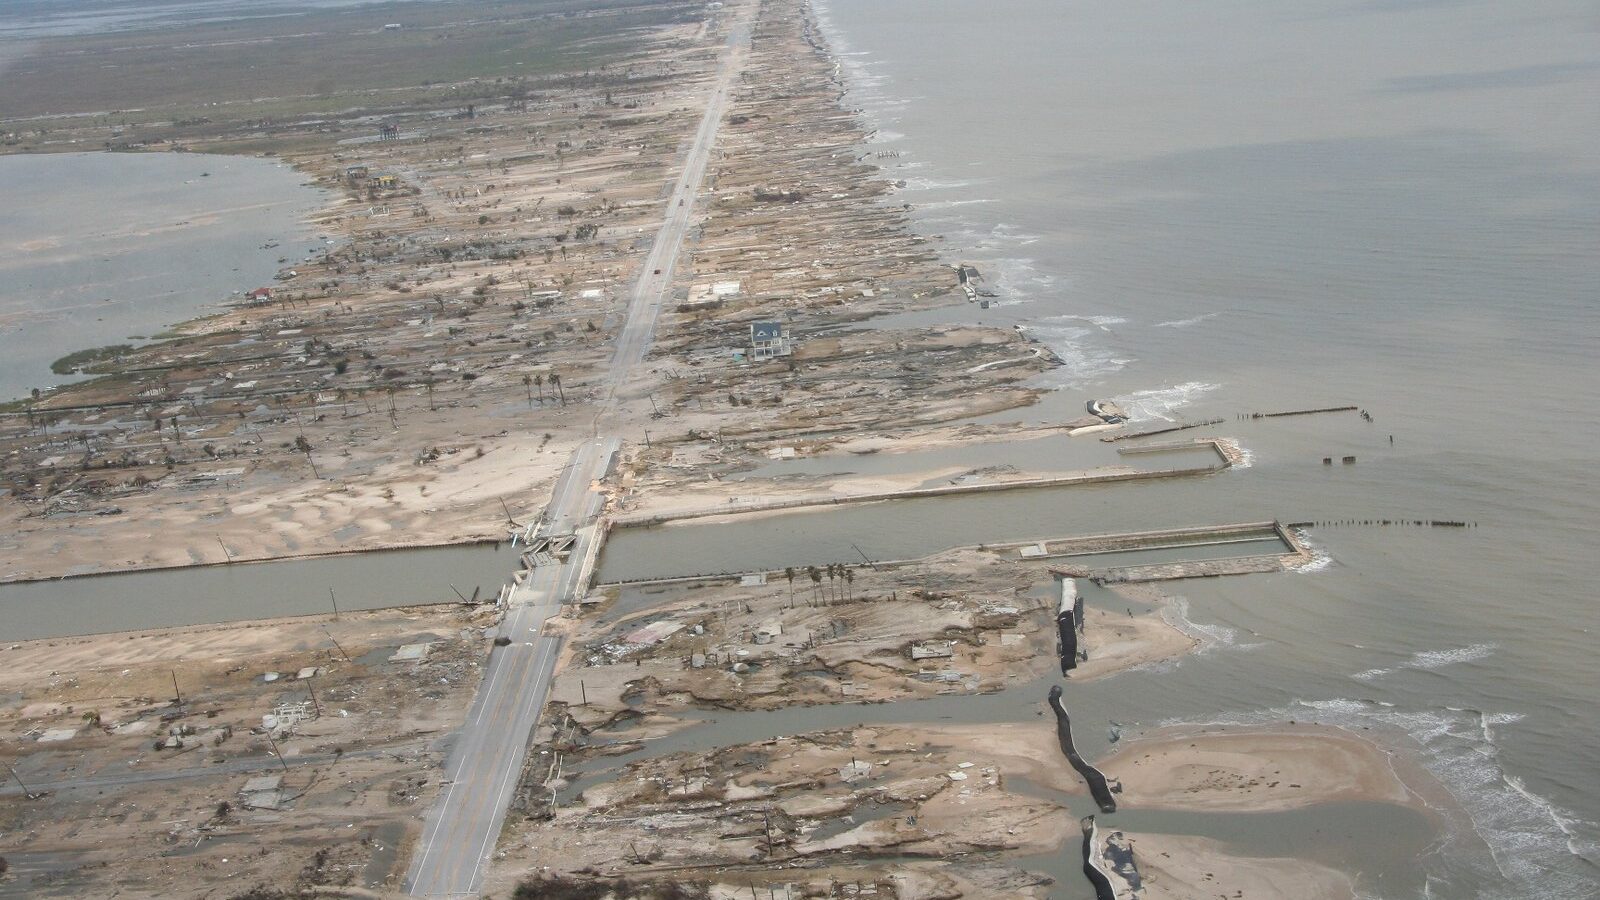
Aerial photo of a peninsula/barrier island that has been breached by a storm surge. Sand, buildings, and other structures have been washed away or damaged, including visible broken lines of sandbags, a damaged bridge, damaged trees, and obliterated buildings; only one house appears to still be standing.
Storm surge damage from Hurricane Ike, Bolivar Peninsula, Texas, 2008. Photo credit: NOAA.

Previous studies by Rappaport (2014) and Rappaport and Blanchard (2016) summarized direct and indirect fatality data from Atlantic basin tropical cyclones in the United States for the 50-year period 1963–2012. During that period, nearly 9 out of 10 tropical cyclone-related direct deaths in the United States were due to water. Storm surge was responsible for nearly half (49%) of the direct deaths, and over one-quarter (27%) were due to rainfall-induced freshwater flooding.  

In response, the National Weather Service (NWS) and NHC worked to improve outreach, education, and communication of storm surge and rainfall hazards. We introduced new real-time storm surge maps in 2014, and in 2017 introduced a storm surge watch/warning that highlights the risk of life-threatening storm surge inundation. 

New Data Suggest Changing Trends

Since 2012, the United States has experienced 21 hurricane landfalls, including 8 major hurricanes, and more than 20 tropical storm landfalls. Eighteen of these hurricane landfalls, including all of the major hurricanes, occurred during 2017–22 after a relatively quiet period. Given the significant number of tropical cyclone landfalls in recent years, and increased deployment of warnings around the storm surge hazard, NHC examined and compared fatality data from the most recent 10-year period (2013–22) to the earlier studies.

Hazard % of direct fatalities from this cause
(1963–2012)
% of direct fatalities from this cause
(2013–2022)
Storm Surge49%11%
Freshwater Flooding27%57%
Wind8%12%
Surf/Rip Currents6%15%
Offshore Marine Incidents6%3%
Tornadoes3%2%
Other1%1%
Note: Due to rounding, numbers may not add up to 100%.

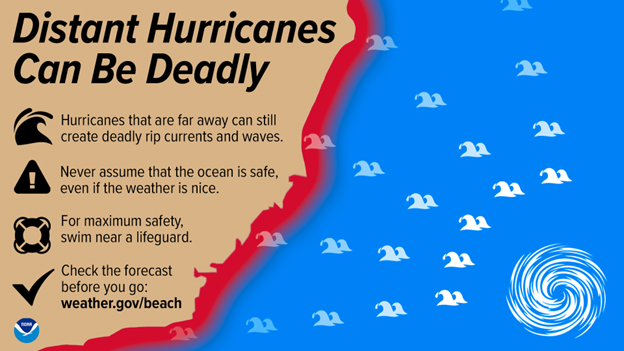
During the most recent 10-year period in the United States, about 57% of direct tropical cyclone deaths were due to drowning from freshwater (rainfall) flooding. Surf and rip current fatalities have become an increasing threat, making up about 15% of direct fatalities in the past decade. These fatalities often occur one or two at a time from distant storms hundreds of miles offshore. Florida, North Carolina, and New Jersey experienced the highest number of TC-related surf and rip current fatalities. Storm surge and wind-related deaths account for 11% and 12% of the direct fatalities, respectively.  

Every hurricane is different, however. Hurricane Harvey in 2017 had the largest number of direct deaths—68, 65 of which were due to freshwater flooding in Texas—in the past decade. Hurricane Ian (2022) was the second deadliest with 66 direct fatalities, 41 of which were due to storm surge in Florida. More than 65% of those who died from direct causes were men, with about 60% of the victims over the age of 60.

Indirect Causes

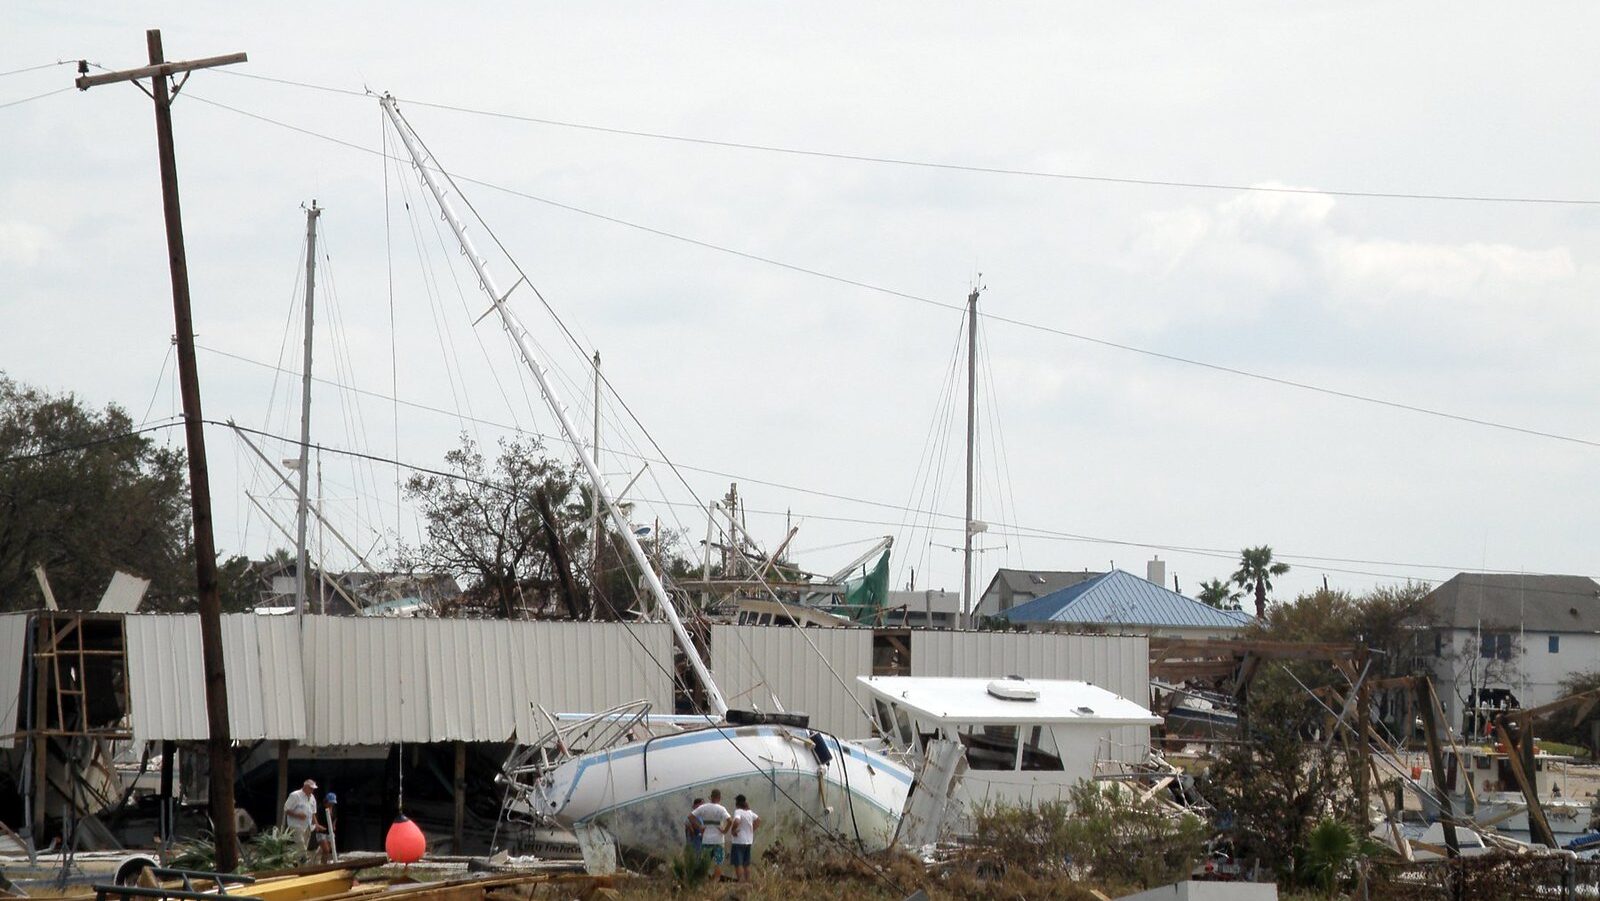
Image of a boat stranded on land, leaning against a wind-destroyed structure and a power line, amid other debris, including destroyed buildings and cars. Three people stand next to the boat observing the damage.
Aftermath of Hurricane Ike in Galveston, Texas, 2008. Photo credit: NOAA.

The recent study revealed that over the past 10 years there has been nearly an equal number of indirect deaths as direct fatalities. Indirect fatalities are due to a wide range of causes, including traffic accidents (16%), preparation/cleanup accidents (15%), carbon monoxide poisoning (12%), lack of medical care (11%), power problem/electrocution (11%), post-storm heat deaths (9%), unknown causes (9%), cardiac-related deaths (7%), and evacuation-related deaths (5%). 

The largest number of indirect deaths in the past decade occurred in association with Hurricanes Ian (90), Irma (82), Michael (43), Harvey (35), and Laura (34). Most (75%) of the indirect deaths are associated with major hurricane landfalls, which leave communities very vulnerable and often with long-duration, widespread power outages. More than half (57%) of the victims were over the age of 60. Younger victims tended to die in vehicle accidents; for older victims, medical-related issues, heat, evacuation, and other accidents were more likely causes of death.

Improving Warnings and Public Understanding

The results of these most recent studies have led the NWS and NHC to increase messaging on the hazards and causes of both direct and indirect fatalities. We continue to highlight rainfall flooding and storm surge risk through the Weather Prediction Center’s Excessive Rainfall Outlook, Flood Warnings from local NWS offices, and increased emphasis on the Storm Surge Warning. These warnings are the loudest “bells” that the NWS can ring during life-threatening flooding. We encourage our media and emergency management partners to work with us to encourage timely public response and personal preparedness ahead of these threats. 

Additionally, with the increased percentage of rip current fatalities associated with high surf and swells from distant hurricanes, the NWS has created new infographics to explain this deadly beach hazard, and is working on graphics to better highlight the threat in real time.

During the highly impactful 2020 hurricane season in the United States, there were more fatalities associated with carbon monoxide poisoning from the improper use of generators than there were from storm surge. After that season, NHC and the NWS developed infographics and worked with media and emergency management partners to highlight that threat. While it is difficult to determine the effectiveness of that messaging, it is encouraging to know that there were no carbon monoxide related-fatalities in the aftermath of Hurricane Ian in 2022 in Florida, despite its devastating impacts and widespread power outages in that state.   

NHC relies on relationships with media, emergency management partners, and the entire weather enterprise to help reach the public before, during, and after tropical cyclone threats. These efforts undoubtedly increase awareness, encourage preparation, and save lives. We hope to continue to improve our messaging and understanding of the threats and causes of injuries and fatalities to better meet our collective mission.  

Visit the National Hurricane Center online.

Header photo: Hurricane Gonzalo in the Atlantic. Photo taken by GOES East satellite at 1445Z on October 14, 2014. Photo credit: NOAA.

This post was invited based on a presentation given by Dr. Brennan at the 50th Conference on Broadcast Meteorology, which took place in Phoenix, Arizona, June 21–23, 2023. The conference was organized by the American Meteorological Society Board on Broadcast Meteorology and chaired by Danielle Breezy and Vanessa Alonso.

Southeasterners Perceive Tornado Risk Dangerously Different Than They Should, Especially at Night

While a major winter storm last month was plastering the United States from Texas and New Mexico to New England with heavy snow and ice, volatile conditions in the Southeast (SE) spawned damaging and deadly tornadoes. One of these overnight Monday, February 16, tragically took the lives of 3 people and injured 10 in coastal North Carolina. Such nocturnal tornadoes are common in the Southeastern U.S.—a unique trait—and represent an extreme danger to sleeping residents.


Compounding this problem, new research in the AMS journal Weather, Climate, and Society suggests there may be a deadly disconnect between tornado perception and reality in the region right when residents instead need an acute assessment of their tornado potential.
The article “Do We Know Our Own Tornado Season? A Psychological Investigation of Perceived Tornado Likelihood in the Southeast United States,” by Stephen Broomell of Carnegie Mellon University, with  colleagues from Stanford and NCAR, notes the tragic results of the regional misperception:

The recurring risks posed by tornadoes in the SE United States are exemplified by the significant loss of life associated with recent tornado outbreaks in the SE, including the 2008 Super Tuesday outbreak that killed over 50 people and the devastating 27 April 2011 outbreak that killed over 300 people in a single day.

Their survey of residents in seven states, from Louisiana and Arkansas to Georgia and Kentucky, representing the Southeastern region, finds that the residents perceive their tornado likelihood differently than meteorologists and experts familiar with Southeastern tornado risk. This puts them at great risk because residents’ experiences don’t match what actually happens where they live.

Broomell and his fellow researchers contend that Southeast residents may be misusing knowledge of Great Plains tornado events, ubiquitous in tornado chasing reality shows and social media videos, when determining their own risk. A fatal flaw since tornado behavior is different between the two regions.
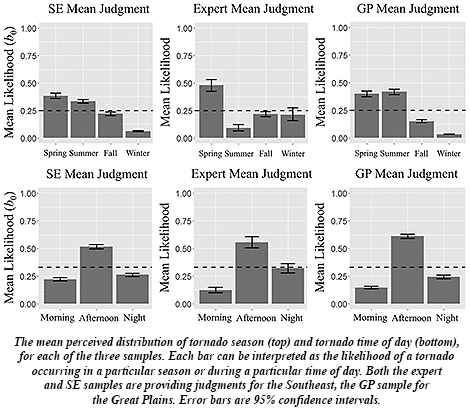
WCAS SE tornado season survey2For starters, unlike in infamous “Tornado Alley” states of Texas and Oklahoma north through Nebraska and Iowa into South Dakota, the Southeast lacks a single, “traditional” tornado season, with tornadoes “spread out across different seasons,” Broomell along with his coauthors report, including wintertime. The Southeast also endures more tornadoes overnight, as happened last week in North Carolina. And they spawn from multiple types of storm systems in the Southeast, more so than in the Great Plains. This makes knowledge about residents’ regional tornado likelihood especially critical in Southeastern states.

Another recent study published in the Bulletin of the American Meteorological Society, “In the Dark: Public Perceptions of and National Weather Service Forecaster Considerations for Nocturnal Tornadoes in Tennessee,” by Kelsey Ellis (University of Tennessee, Knoxville), et al., surveyed residents of Tennessee and came away with similar findings about tornado timing: about half of Tennessee’s tornadoes occur at night, and yet less than half of those surveyed thought they would be able to receive nighttime tornado warnings.

Local forecasters and broadcast meteorologists as well as emergency managers are tuned into the mismatch. In the BAMS study, NWS forecasters said they fear for the public’s safety, particularly with nighttime tornadoes, because they “know how dangerous nocturnal events are”—fatalities “are a given,” some said.

Ellis and her colleagues recommended developing a single, consistent communication they term “One Message” to focus on getting out word about the most deadly aspect of the tornado threat. Forecasters, broadcasters, and emergency managers through regular and social media would then be consistent in their messaging to residents, the researchers state, decreasing confusion. For example:

Nighttime tornadoes expected. Sleep with your phone ON tonight!

With severe weather season ready to pop as spring-like warmth quickly overwhelms winter’s icy grip in the next couple of weeks, the nation’s tornado risk will blossom across the South and Southeast. And nocturnal tornado threats will only increase, particularly in the Southeast, as February turns into March, and then April—a historically deadly month.
For residents in places more prone to nighttime tornadoes, Ellis et al. say the ways to stay safe are clear:

Have multiple ways to get tornado warnings, do not rely on outdoor sirens, sleep with your phone on and charged during severe weather, and do not stay in particularly vulnerable locations such as mobile homes or vehicles.

"Sleep with your phone on!": Messaging for Nighttime Tornadoes

With Hurricane Delta poised to strike Louisiana today, the risk of embedded tornadoes will increase as rainbands spiral ashore, along with the primary threats of storm surge and damaging winds. Delta is forecast to plow well inland Friday night into the weekend, continuing a low risk for tornadoes, some of which could occur at night in Alabama, Mississippi and into southern Tennessee. The threat is more than a bit worrisome as new research in BAMS finds through phone surveys and followup interviews in Tennessee that people are woefully unprepared for nocturnal tornadoes.
In their article,” Kelsey Ellis and colleagues found a host of poor practices by residents when it comes to tornadoes at night. The authors recommend forecasters narrow their messaging about nocturnal tornadoes in the Southeast to a single important message to limit confusion.
Almost half of Tennessee’s tornadoes occur at night, as in other Southeast states with large numbers of nocturnal tornadoes, and are two-and-a-half times as deadly as daytime tornadoes. This creates detection, warning, and public response challenges. Yet, respondents in the western part of the state overestimated tornado occurrence at night while those in the east substantially underestimated the number.
Additionally, nearly half of participants in the survey say they rely on sirens to receive tornado warnings. This is despite the fact that sirens are not designed to warn people inside nor be loud enough to wake anyone up. Instead, Wireless Emergency Alerts (WEAs) “should be a constant,” the authors say. Also, people mentioned they rely on TV and social media for receiving warnings even though generally neither will wake you up.
The authors felt it was “dangerous” that even the more tech savvy and tornado aware respondents answered they were compelled to look outside for evidence of a tornado—even in the dark. Interviewees explained they were “checking for sounds instead of visual cues.”
NWS forecasters were also surveyed about nocturnal tornadoes. The forecasters mentioned the lack of ground truth and fear for public safety among challenges to the nighttime warning service. They noted few spotter or social media reports inform them if “the storm is actually showing the signs on the grounds that radar is indicating aloft.” Forecasters said they felt “fearful, worried, or nervous for the public during nocturnal tornadoes because fatalities ‘are a given.’”
The survey responses moved Ellis et al. to recommend a single-emphasis message be presented to residents to combat the nighttime tornado problem:

One strategy that may improve public safety during a nocturnal tornado event, and which addresses the forecaster challenge of communication prior to and during an event, is to develop “One Message”—a consistent message that EMs and the media use throughout broadcasts, briefings, and social media. Examples of messages could be: “Nighttime tornadoes expected. Sleep with your phone ON tonight!” or “Tornadoes will form quickly! Make plans now where you will take shelter!” or “If you live in a manufactured home, you may not have much time to seek shelter tonight!” One Message may decrease confusion for receivers, making them more likely to make safe decisions. Messages could similarly be used to dispel misconceptions about local geography in ways relevant to the specific listening area, for example: “You are not protected by nearby hills. Seek shelter immediately!”

With Hurricane Delta’s nighttime tornado threat ramping up, the authors suggest people use multiple ways to receive warnings, keeps phones on and charged, don’t rely on tornado sirens, and if possible relocate ahead of the weather from “particularly vulnerable” situations, such as mobile homes and vehicles.

“Sleep with your phone on!”: Messaging for Nighttime Tornadoes

With Hurricane Delta poised to strike Louisiana today, the risk of embedded tornadoes will increase as rainbands spiral ashore, along with the primary threats of storm surge and damaging winds. Delta is forecast to plow well inland Friday night into the weekend, continuing a low risk for tornadoes, some of which could occur at night in Alabama, Mississippi and into southern Tennessee. The threat is more than a bit worrisome as new research in BAMS finds through phone surveys and followup interviews in Tennessee that people are woefully unprepared for nocturnal tornadoes.

In their article,” Kelsey Ellis and colleagues found a host of poor practices by residents when it comes to tornadoes at night. The authors recommend forecasters narrow their messaging about nocturnal tornadoes in the Southeast to a single important message to limit confusion.

Almost half of Tennessee’s tornadoes occur at night, as in other Southeast states with large numbers of nocturnal tornadoes, and are two-and-a-half times as deadly as daytime tornadoes. This creates detection, warning, and public response challenges. Yet, respondents in the western part of the state overestimated tornado occurrence at night while those in the east substantially underestimated the number.

Additionally, nearly half of participants in the survey say they rely on sirens to receive tornado warnings. This is despite the fact that sirens are not designed to warn people inside nor be loud enough to wake anyone up. Instead, Wireless Emergency Alerts (WEAs) “should be a constant,” the authors say. Also, people mentioned they rely on TV and social media for receiving warnings even though generally neither will wake you up.

The authors felt it was “dangerous” that even the more tech savvy and tornado aware respondents answered they were compelled to look outside for evidence of a tornado—even in the dark. Interviewees explained they were “checking for sounds instead of visual cues.”

NWS forecasters were also surveyed about nocturnal tornadoes. The forecasters mentioned the lack of ground truth and fear for public safety among challenges to the nighttime warning service. They noted few spotter or social media reports inform them if “the storm is actually showing the signs on the grounds that radar is indicating aloft.” Forecasters said they felt “fearful, worried, or nervous for the public during nocturnal tornadoes because fatalities ‘are a given.’”

The survey responses moved Ellis et al. to recommend a single-emphasis message be presented to residents to combat the nighttime tornado problem:

One strategy that may improve public safety during a nocturnal tornado event, and which addresses the forecaster challenge of communication prior to and during an event, is to develop “One Message”—a consistent message that EMs and the media use throughout broadcasts, briefings, and social media. Examples of messages could be: “Nighttime tornadoes expected. Sleep with your phone ON tonight!” or “Tornadoes will form quickly! Make plans now where you will take shelter!” or “If you live in a manufactured home, you may not have much time to seek shelter tonight!” One Message may decrease confusion for receivers, making them more likely to make safe decisions. Messages could similarly be used to dispel misconceptions about local geography in ways relevant to the specific listening area, for example: “You are not protected by nearby hills. Seek shelter immediately!”

With Hurricane Delta’s nighttime tornado threat ramping up, the authors suggest people use multiple ways to receive warnings, keeps phones on and charged, don’t rely on tornado sirens, and if possible relocate ahead of the weather from “particularly vulnerable” situations, such as mobile homes and vehicles.

Eulerian Weather, Lagrangian Lives

by Alan E. Stewart, University of Georgia

It is clear that Covid-19 will be with us for a while. So will the weather, however. We’ve been through flooding in Michigan in mid-May; an outbreak of 140 tornadoes from Texas to Maryland in April; a deadly and destructive derecho in Iowa; hurricane landfalls in Louisiana, Alabama, and Florida; and massive wildfires in the West. In other words, the weather, as always, just is—it exists and occurs as a series of events that intertwine with the activities and challenges of our daily lives. Here, I would like to borrow from dynamic meteorology and apply the concepts of the Eulerian and Lagrangian perspectives to discuss our experiential journeys through the weather and Covid-19. I also will query what this means for how we cope when severe weather threatens us during this pandemic.

From the Eulerian perspective, we depict the current weather or make a forecast for a given space (county warning area, city, state, region) for a time (6 hours, 12 hours, and so on). We concern ourselves with what will occur inside the grid boxes of a model—what is the flux of weather into and out of the area? Similarly, when we look out of the windows of our life-spaces we see and experience the weather. And what is so striking about what we see is that most of the time the weather seems within its usual seasonal limits—climatologically speaking. The weather is often pleasant. It seems not to have gotten the message about Covid-19.

How could it? The weather just is. Some people have told me that during the pandemic, the closures, and the quarantines, the weather is about the only thing that has remained normal in their lives—and this has provided some degree of comfort. But with a wildfire or a hurricane, this can change quickly. Some of the same states that are threatened by hurricane landfall already have been ravaged by Covid-19.

We can think of peoples’ paths through the meteorological and nonmeteorological events in their lives with the Lagrangian perspective—metaphorically speaking. Life is a journey, a narrative, a path or a force that moves forward in time; sometimes the trajectory changes unexpectedly. The Lagrangian perspective involves the accumulated experiences of the weather through the eyes of the perceivers— individual people. Such Lagrangian living with or “under” the weather builds a corpus of weather experiences that subtly or sometimes significantly changes peoples’ subsequent responses to the weather . All of us are, to varying extents, products of what we have experienced, including the Covid-19 pandemic. So many people—in Michigan, Iowa, California, Louisiana, and elsewhere—have experienced life with both Covid-19 and disaster and displacement.

In dynamic meteorology we learn to use both the Eulerian and Lagrangian perspectives; we segue between the two to build a fuller understanding of the atmosphere. What might we learn and what questions arise when we juxtapose my uses of these perspectives? These are timely questions to consider as we deal with hurricanes, winter storms, and other weather threats during the Covid-19 pandemic.

Trust of Message Sources: During the Covid-19 pandemic, different state and federal agencies often have issued confusing, sometimes contradictory reports and recommendations about the virus. How have peoples’ experiences of this messaging affected the ways that they may receive and act upon forecasts, watches, and warnings for severe/extreme weather? How might weather-related messages from local emergency managers or health departments be received? To what extent has the trust in the weather enterprise been affected by pandemic-related messaging?

Risk Perception and Tolerance: People have dealt with multiple risks thus far during the pandemic: health, economic/financial, social, and psychological, among others. Have the experiences of these risks affected how people perceive additional risks from thunderstorms, tornadoes, floods, and hurricanes? Because people may have successfully survived an infection with Covid-19, does this affect how they perceive their risks to natural hazards? Do some people feel lucky? Because people may be more desperate for work or to keep a job, might they take additional risks to do their jobs during bad weather? Might some businesses take extra risks in bad weather to build a competitive advantage—to make up for past losses?

Preparation: As word of the pandemic spread, people in many places stocked up on consumables for daily living, leading to shortages of some items. Given how the pandemic has unfolded in different parts of the country, are people still prepared? Have they exhausted those supplies and are people fatigued from stocking up? Are suppliers ready for further waves of Covid-19 and/or a major hurricane landfall? Has stocking up and preparing made people more ready for severe weather? Is there a new appreciation for being prepared for the unexpected?

Sheltering in Place: Some severe weather events involve sheltering in place. Given the extensive sheltering in many places in the spring because of Covid-19, would some prefer to shelter in place rather than risk Covid-19 exposure elsewhere? Alternatively, would some be less likely to shelter in place because they are fatigued from it?

Evacuation Planning: Important questions involve what happens when evacuations are necessary: For example, how can the spread of Covid-19 infection be limited? Are separate shelters needed for those who are infected? How does social distancing work in the close quarters of a shelter? Are more shelters needed? Do the existing shelters have a supply of face masks and other personal protective equipment?

Interdisciplinary social and atmospheric science points to an ever-motivating realization: Often it is not simply a matter of providing a timely and accurate forecast, but it is what people do with the information they have that affects the outcomes. This is unsettling because it is often out of the direct control of the weather enterprise—much as epidemiologists and physicians cannot control how people deal with the risks of Covid-19. Efforts to communicate effectively, educate, and persuade stakeholders about the weather take on great importance. Forecasts and warnings are absorbed by people who have experienced the varying and cumulative effects of Covid-19. Being mindful of this reality may help us to better prepare people and communities.