Tornado Risks: Perceptions and Realities

A session spotlight from the 31st Conference on Severe Local Storms

By Katie Pflaumer, AMS Staff

The session “Perception and Risk Associated with Severe Weather” at the 31st Conference on Severe Local Storms highlighted the interactions between severe weather and societal impacts. Here are a few takeaways.

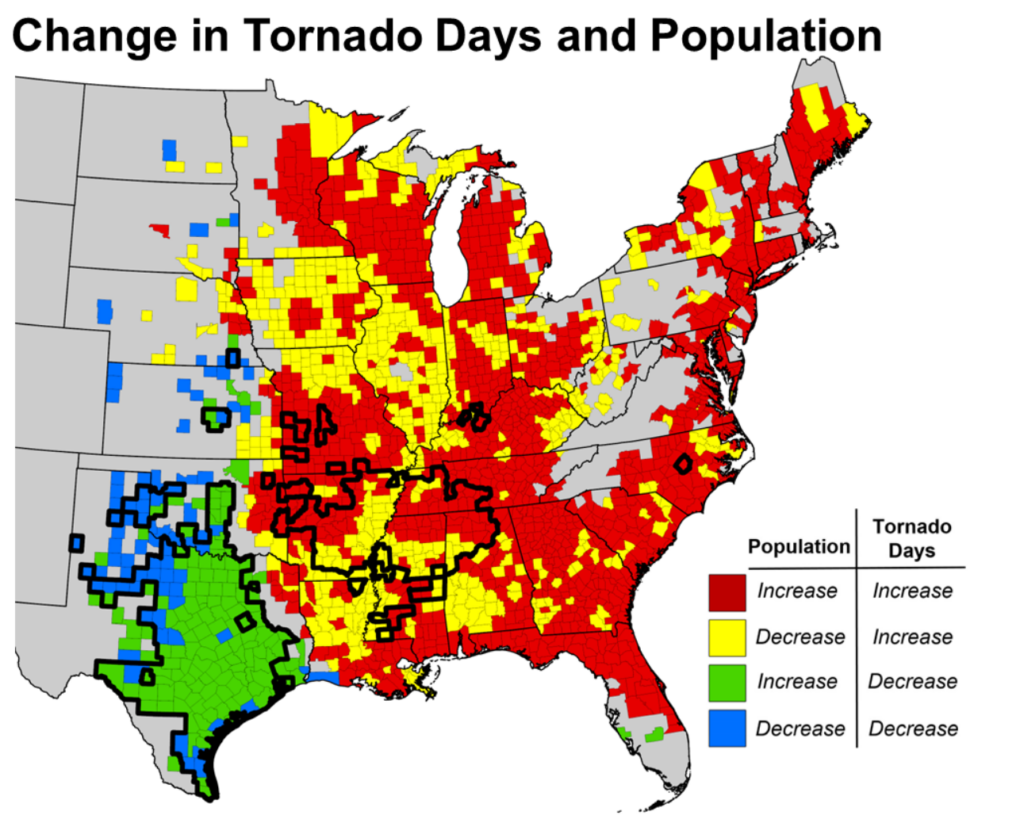
Tornado impacts are increasing across the United States–despite variation in where tornadoes hit. A presentation by Stephen Strader (Villanova University) highlighted the importance of considering all factors to understand tornado impacts, not just climate. Using 40 years of observational data, plus a statistical model depicting changes in societal factors, researchers found that increased housing and population growth in tornado-prone areas is a key driver of increased tornado damage/human risk. 

While the number of days with tornadoes is trending down in the U.S. Southern Plains and trending upward in the mid-South; the likelihood of tornado damage has increased in both regions due to increased human occupation. However, the combination of tornado increases with population growth and spread has tripled tornado impact potential in the mid-South since 1980, surpassing the Southern Plains. Strader noted that stricter enforcement of building codes, investments in tornado shelters and safe rooms, and public education could help mitigate tornado damages–if scientists can get across the message that human factors matter.

“We have to get away from this idea that climate change is a cause of a disaster … climate change is a contributor to a disaster, not a cause. [Disaster] is inherently linked to societal factors. … With environmental changes and exposure changes/housing growth, you see an increasingly disaster-prone society.”

—Stephen Strader

Graphic from: Strader, S.M., Gensini, V.A., Ashley, W.S., and A.N. Wagner (2024) “Changing Tornado Environments Vs. Changing Societal Vulnerability and Exposure.” (Poster presented at 31st Conference on Severe Local Storms, October 21.) Originally from Strader et al. (2024), “Changes in tornado risk and societal vulnerability leading to greater tornado impact potential.” NPJ Natural Hazards, 19 June. https://doi.org/10.1038/s44304-024-00019-6

Wireless Emergency Alerts are critical—and confusing—for Spanish speakers in the U.S. Southeast. A study presented by Joseph Trujillo-Falcón (University of Illinois) found that Spanish-language wireless emergency alerts (WEAs, phone notifications about severe weather) from the National Weather Service are crucial safety tools. For some tornado survivors in Kentucky, for example, the WEA had been their only trigger to get to safety. In-depth conversations with 27 Spanish speakers from across the U.S. found that WEAs were highly respected and useful, yet needed some redesign to avoid confusion. For example, the Spanish translation of the NWS acronym (SNM) called to mind medical conditions or kink. The word “proyectiles” (projectiles), used to warn about airborne debris, evoked war zone imagery rather than weather. Using the word “aviso” for “warning” struck many as less urgent than the term “alerta.” In addition, 360-word warnings (versus those of 90 words or less) helped readers better understand what was going on and what to do in response. This was especially important for people who hadn’t encountered a tornado in their country of origin. Direct links to information and instructions on how and where to shelter were also seen as key, especially in areas with many mobile or manufactured homes.

“The information source that I take most seriously as a recently arrived immigrant are WEAs. Since everyone gets it at the same time, if one ignores it, the other reads it.”

Gabriela, Venezuelan immigrant who has limited English proficiency (Trujillo-Falcón 2024).

People want different forecast information as a threat evolves. A study presented by Makenzie Krocak (National Severe Storms Laboratory) analyzed data from the Severe Weather and Society survey to determine what information members of the public want and need at different times in relation to weather threats. They found that respondents’ priorities changed over time. In longer time frames (e.g., three days in advance) survey respondents overwhelmingly ranked location information and event probability as the most valuable information; people wanted to know, ‘Should I prepare for severe weather to occur in my area?’ A day to an hour in advance, people wanted to know about the timing of the event, as well as its potential severity. In the warning time frame (60 minutes or less) their desire for information about potential impacts and necessary protective actions increased.

For additional insight, the researchers painstakingly categorized, geo-located, and analyzed 9000+ social media comments from the National Weather Service Facebook and Twitter/X accounts before and after severe weather events. A poster presented by undergraduate student Emily Allen (University of Louisiana Monroe) delved into this side of the equation.
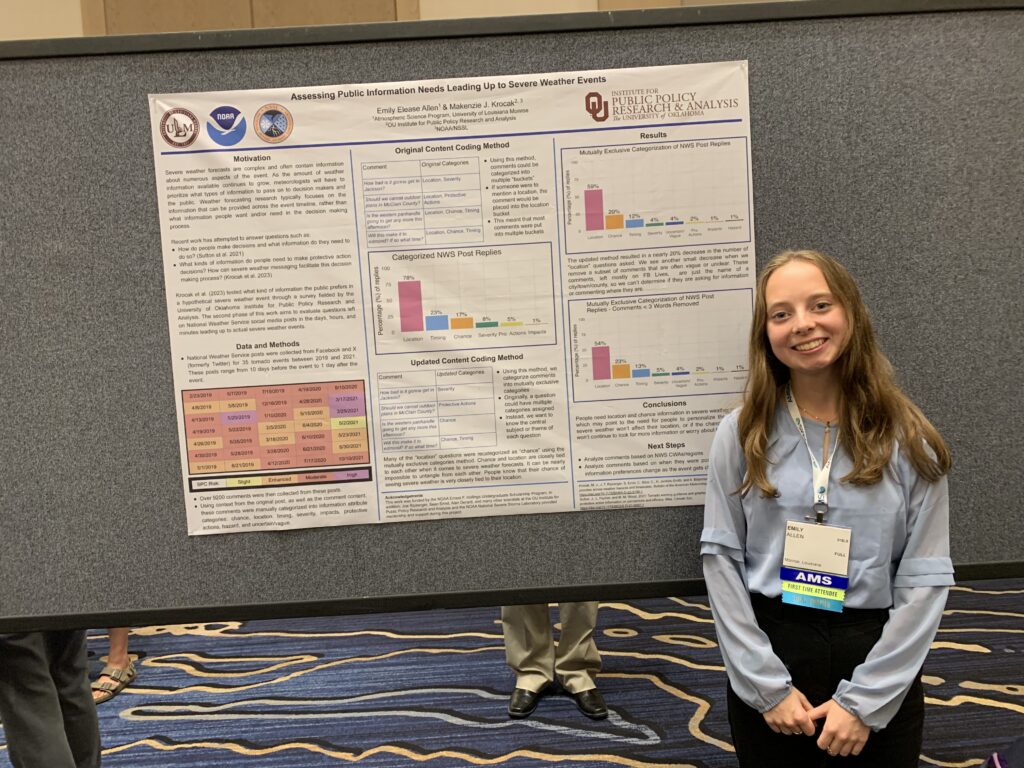
Emily Allen with her poster, “Assessing Public Information Needs Leading Up to Severe Weather Events.” (E.A. Allen and M. Krocak, 2024)

Three days out from an event, commenters largely asked about the chance of an event happening, but for nearer time frames, location became the dominant question—i.e., ‘Will this hit my specific area?’ Krocak emphasized the need to include very clear landmarks in warning graphics to help people find their location. She also noted that certain groups still require information about protective actions to take—especially those with the least experience dealing with a particular hazard.

Making severe weather products usable and understandable. Two presentations dealt with public perceptions of evolving probabilistic weather forecast information—that is, communicating changes in severe weather risks across time and geography. 

Christopher Wirz (NSF NCAR) presented preliminary results of a study about public perceptions of evolving probabilistic tornado forecasts and warnings. On average, respondents’ sense of risk was about the same as for a deterministic (e.g., warning vs no-warning) forecast; most were likely to be on high alert during a tornado warning in any case, and not underestimate their risk. However, there were differences in how participants responded based on where they were located relative to a given warning polygon. For example, some felt they were in more danger if they were ‘in front’ of the warning polygon, despite the graphics showing equal tornado risk in other directions. Warn-on forecasts—alerts issued when a significant risk is predicted, often long before a tornado is detected by radar—were seen as less actionable by some, but others appreciated knowing to ‘keep an eye out.’ Overall, the study found that members of the public don’t take probabilistic information at face value—rather, they interpret it based on context, including existing local knowledge and other warning products they encounter. In addition, for half of the respondents, level of trust in a forecast didn’t change when they received more/updated information, because trust was instead based on how much they trusted the source of the forecast.

Kristin Calhoun (NOAA National Severe Storms Laboratory) presented about new products and communications that are in development to help NWS forecasters and emergency managers use storm-based probabilistic hazard information (PHI) in the severe weather watch-warning timeframe. These included PHI tools layered with threats-in-motion (TIM) information, in which warning polygons are moved (and removed) with the motion of the storm, helping downstream areas prepare sooner and allowing those for whom danger has passed to redeploy their resources more strategically; potential new protocols for the NOAA/NWS Storm Prediction Center, rather than local weather forecast offices, to add or remove an area from a watch/warning once the threat has passed; a blended PHI plus warn-on forecast product that can help emergency managers plan better by seeing storms in motion along with trends in likelihood and potential impact; and a new product based on SPC’s ‘Mesoscale Discussions,’ created by local NWS forecasters and called ‘Local Discussions,’ with an increased focus on potential impacts, timing, and location of hazards versus highly technical information.
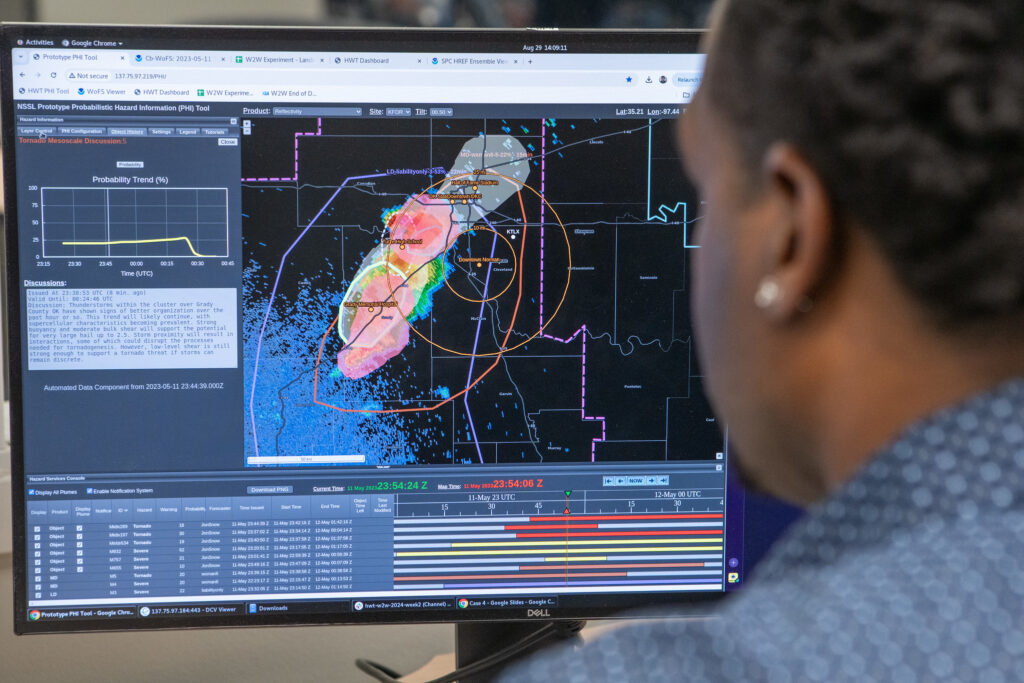
Photo: National Severe Storms Laboratory, Watch-to-Warning Experiment.

Social pressure may impact campus tornado safety. Alicia Klees (University of Illinois at Urbana-Champaign) presented work conducted largely by undergraduate student Kyla Wolski that has implications for student safety. The University of Illinois’s Illini-Alert system warns students when tornado threats are approaching; most students are aware of the alerts, and most have experienced a tornado warning before. Students were asked in a survey what they would do if they were in a vulnerable location—such as a fourth-floor classroom with glass windows—and received a tornado warning. 75% said they would change their location to seek shelter. However, when a hypothetical professor kept teaching through a tornado warning (as some faculty reportedly did during the last real tornado warning on campus), 22% of students who had planned to seek shelter said they would probably stay in class. These students said they trusted the professor’s judgment—yet professors do not receive extensive formal training on tornado safety. Klees recalled an anecdote from a student in which one faculty member remarked, “I don’t hear the sirens anymore, so it’s fine.”

In addition, most students did not view tornadoes as a major risk, and most were unaware that tornadoes could happen at any time of year. Klees identified future collaborations with Emergency Management to survey faculty and TAs on tornado warning response, with the goal of keeping students safe.

If you are registered for the 31st Conference on Severe Local Storms, you can view the full session recording at this link.

About the 31st Conference on Severe Local Storms

The American Meteorological Society’s 31st Conference on Severe Local Storms takes place 21-25 October, 2024, in Virginia Beach, VA, and online. The conference is the premiere gathering for scientists, forecasters, educators, and communicators engaged in all aspects of work related to hazardous deep convective weather phenomena. Attendees present and discuss cutting-edge research regarding the analysis, prediction, communication, and theoretical understanding of the structure and dynamics of severe thunderstorms, including their associated hazards of tornadoes, damaging winds, large hail, lightning, and flash floods. View the conference program here.
BEST: Capturing the Worst Tornado Winds

Greenfield tornado

Greenfield, Doppler on Wheels, and what happens where a twister meets the ground

By Katie Pflaumer, AMS Staff

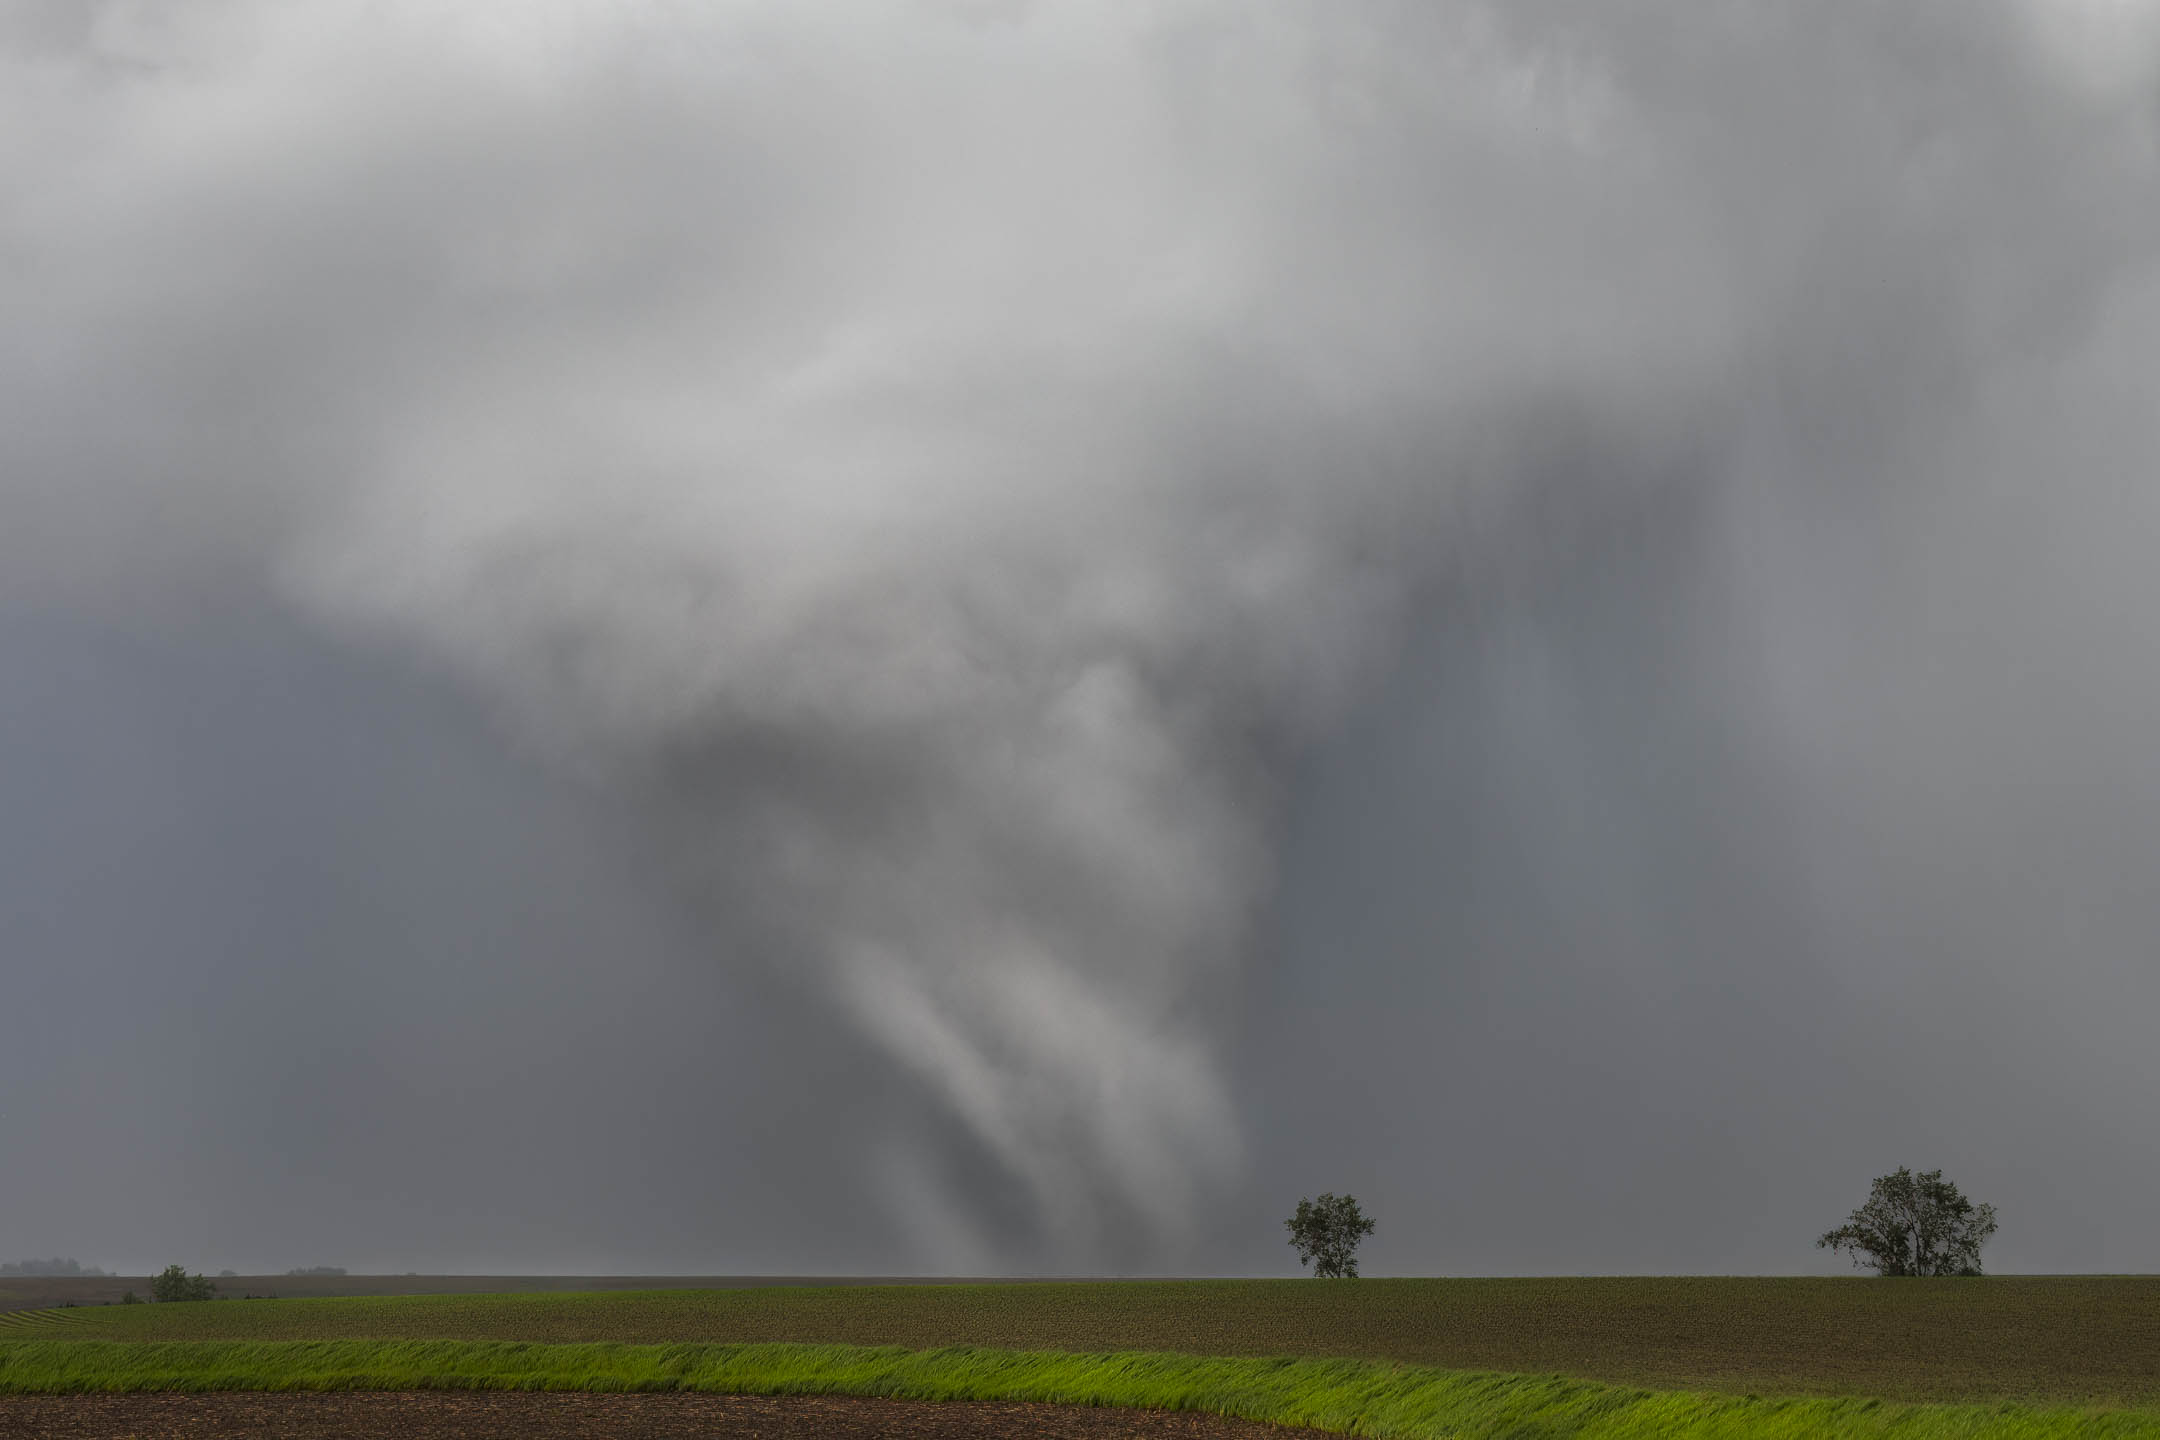
Featured image: The Greenfield tornado, south of the town. Photo credit: Lauren Baca.

On 21 May, 2024, a powerful tornado hit the town of Greenfield, Iowa. A mobile team from the NSF BEST project was able to capture radar and instrument data, measuring one-second gusts among the highest ever recorded. Karen Kosiba, PhD, Principal Investigator (PI) of the BEST project, and Jen Walton, founder of AMS partner organization Girls Who Chase, were both part of the team who intercepted the Greenfield tornado. We spoke with them about what it was like, and what their valuable data might yield.

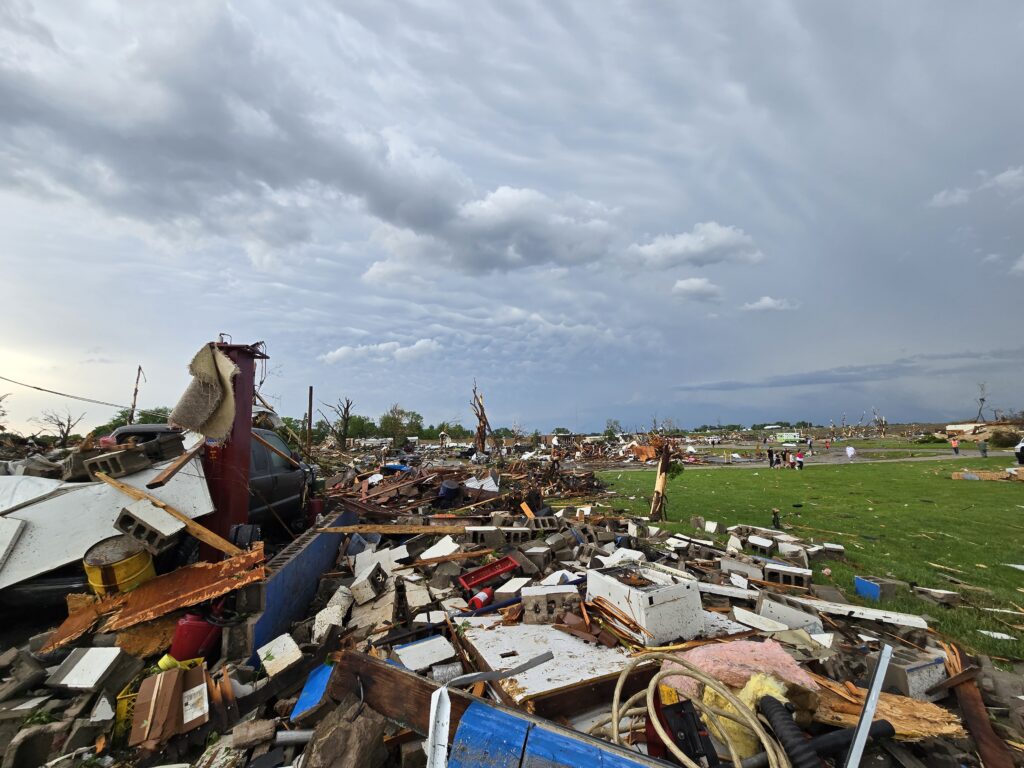
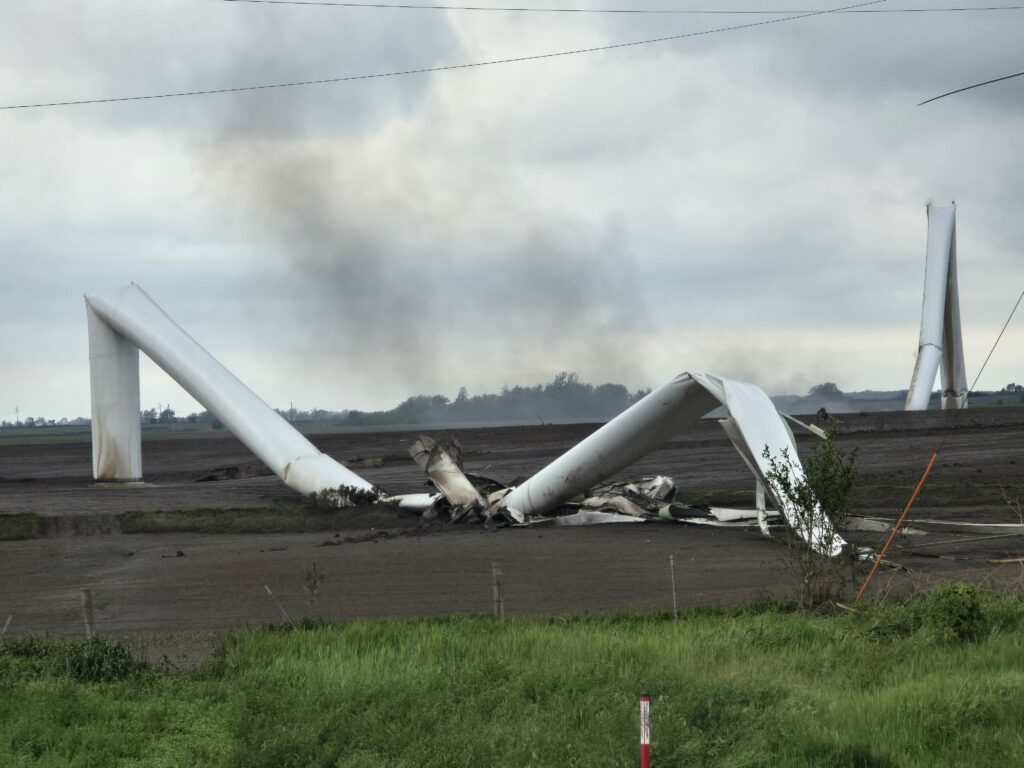
The tornado that hit Greenfield was fast, narrow, and violent, cutting a 44-mile path through southwestern Iowa. Moving into town from the southwest, it had already destroyed wind turbines and family farms, with multiple vortices visibly rotating around its center. 

But as it neared Greenfield, where it would kill five people, the tornado was obscured by a cloak of rain. Racing toward the town with her colleagues, Jen Walton told me, “We could see nothing but a wall of white ahead of us.” They were trying to put themselves right in the path of a hidden monster.

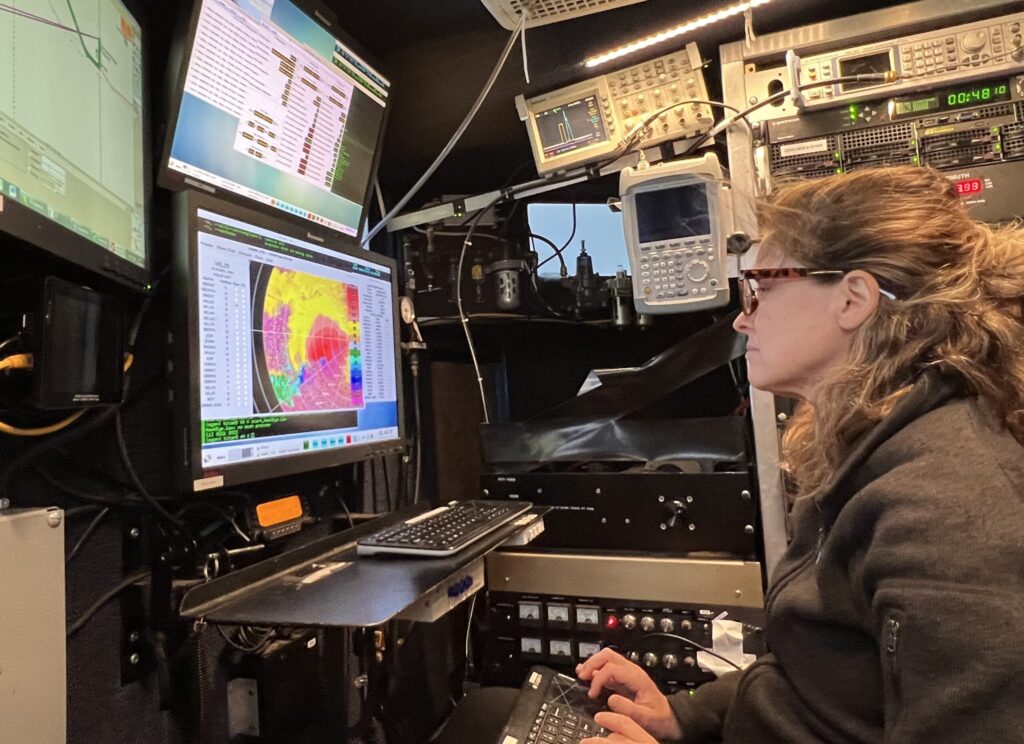
Karen Kosiba wouldn’t have seen it anyway, although she was less than a quarter of a mile from the vortex. “I [almost] never look out the window,” she told me. Her attention was glued to the radar screen. As Principal Investigator on the NSF-funded BEST (Boundary-layer Evolution and Structure of Tornadoes) project, her job was to track the path of the tornado on radar so their team could get close enough to obtain high-resolution dual-Doppler radar and weather instrument data of the tornadic winds closest to the surface of the earth. 

They had sped through Greenfield, and her mobile radar vehicle was now parked just to the east of town, hoping for a clear line of sight in the hilly, tree-covered terrain. “I’m operating the radar, we’re basically scanning through this [storm], tracing the path of the tornado, and it was getting more and more obvious it was going to go through Greenfield,” she said.

Karen Kosiba in DOW
Dr. Karen Kosiba reading the radar screen in a DOW vehicle. Photo credit: Jen Walton/FARM Facility.

DOW(n) Low with Tornadoes

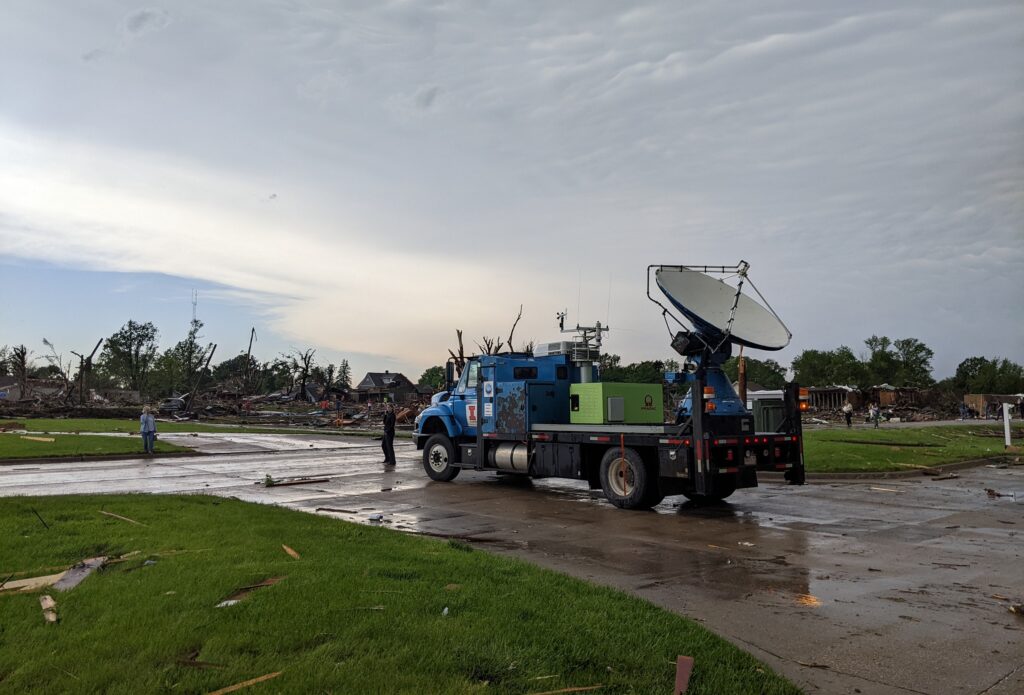
Obtaining high-resolution data from tornadoes is incredibly difficult using stationary instruments and radars — especially for near-surface conditions. The earth’s curvature and obstacles like trees and topography mean that far-away radars simply can’t get a good view of where a twister meets the ground. Also, because of beam spreading, far away radars have worse spatial resolution. Josh Wurman invented the Doppler on Wheels (DOW) network of truck-mounted Doppler radars — now part of the University of Illinois’ Flexible Array of Radars and Mesonets (FARM) Facility — in the 1990s to address challenges like these. DOWs have been used all over the world to look at everything from hurricanes to flooding and wildfires.  

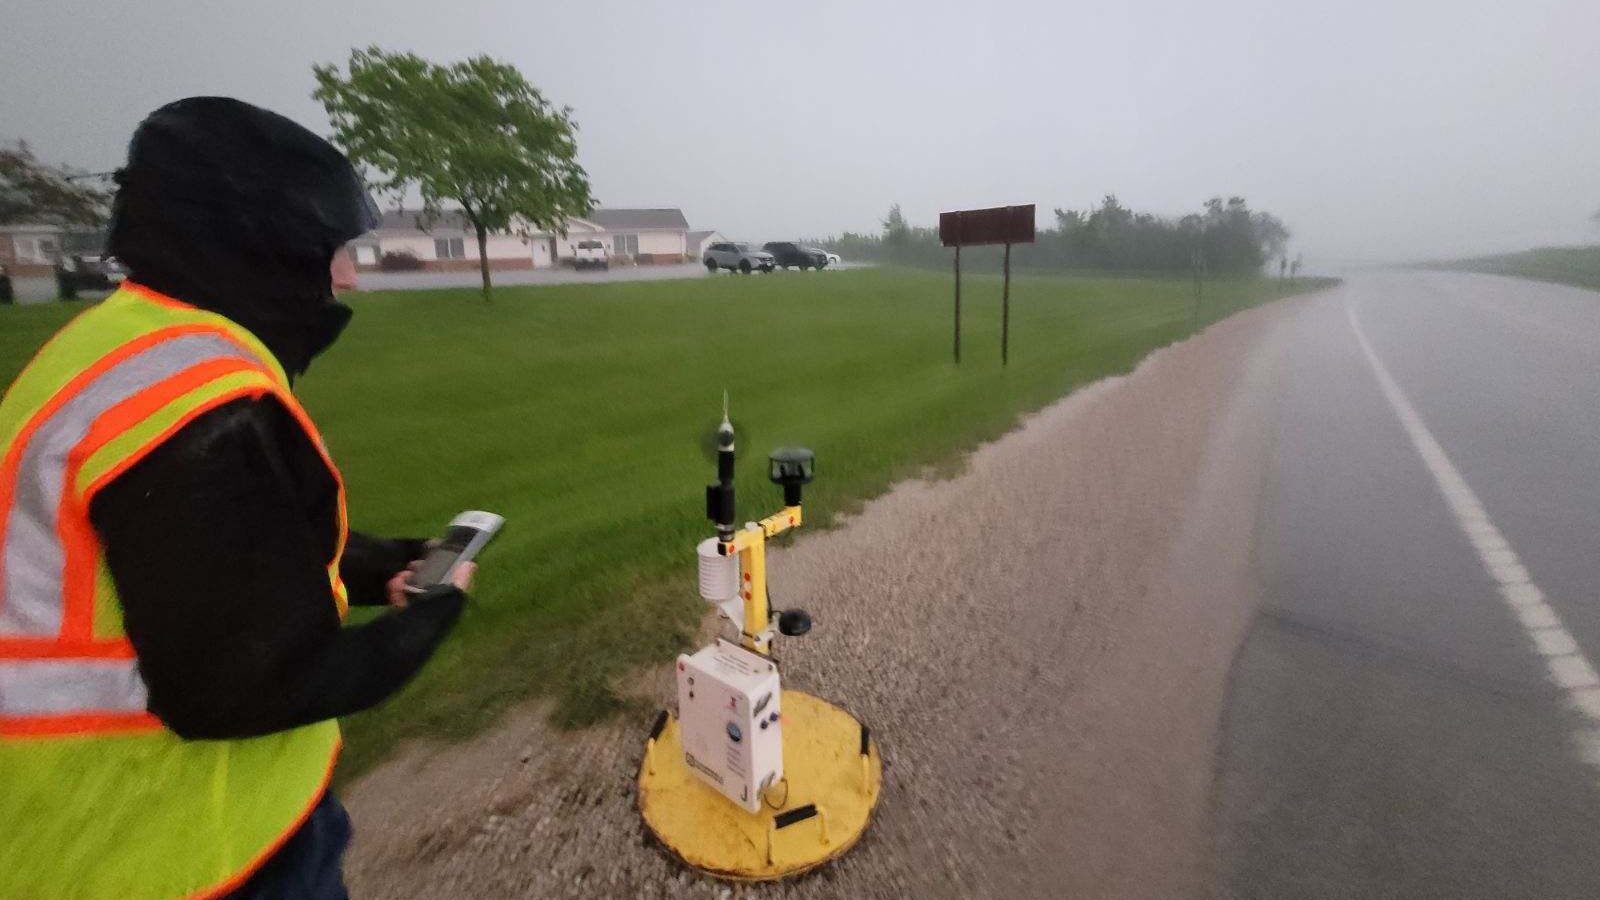
FARM missions currently involve some combination of their four DOWs, a variety of support vehicles equipped with mesonets, and quickly deployable weather stations (Pods), as well as weather balloon-borne instrumentation. The equipment has advanced greatly since the ’90s, Kosiba says. “We scan fast, with really short gates that get us fine-resolution … dual-pol data, which is important for understanding debris signatures and inferring microphysics.” 

The BEST project (which Kosiba co-leads with Wurman) deploys DOWs, Pods, and weather balloons to study boundary-layer tornado winds. “We’re looking at … near-surface wind profiles, and how those vary as a function of tornado structure,” said Kosiba. “We’re also looking at thermodynamics — the relative humidity and temperature, more or less buoyant air, where it originates from — and how that affects tornado intensity, structure, and longevity. Is [the tornado] intensifying, weakening, going on for a long or short time?” It’s the kind of assignment the DOWS were made for.

“Some, rare, observations show that tornado winds can exceed 300 mph, and that the most intense winds are very near the ground, where they are especially hard to measure. In order to mitigate the hazards posed by tornadoes, it is critical to better understand their basic structure and intensity.”

—Excerpt from NSF Boundary-layer Evolution and Structure of Tornadoes (BEST) project grant description

In Greenfield

As TV screens and tornado sirens blared warnings to the town of Greenfield, the BEST team frantically tried to find a place to deploy as the tornado bore down. 

“It was evolving too quickly,” Kosiba told me. One DOW raced to get about 10 miles out, while Kosiba’s DOW truck tried to get closer — and Jen Walton and colleagues went even closer to the tornado, attempting to drop a Pod. Pods are placed in the projected path of the tornado, with the hope that they will obtain surface wind observations from within the radius of maximum winds. Positioning the Pod was difficult with a storm moving at close to 45 mph. 

“As we drove back west toward Greenfield … it was absolutely pouring, making it difficult to make out any features of the tornado-producing storm entering town. But as we pulled up and began to deploy the Pod, the rain bands took on a left-to-right motion indicative of rotation,” said Walton. “That’s when we knew we were in the bear’s cage — chaser slang for the mesocyclone portion of a supercell where a tornado can typically be found, if there is one. As we took GPS coordinates and prepared to depart, debris began falling slantwise out of the rain. We knew it was time to go.”

As it turned out, the Pod team wasn’t the only group having a close encounter. Kosiba’s DOW vehicle ended up directly in the path of a weaker tornado that was forming as they collected data near Greenfield. “The storm was going through a cyclic thing, and there was a new tornado forming very near us. It got windy and rainy.” Although they noticed this in real-time, there wasn’t much they could do except keep collecting data. Luckily, the tornado strengthened after it passed their location.  

As so often happens with this work, for Kosiba at least, there was no time even to be nervous. “Tornadoes are so fast, and you’re so focused on getting people in the right place, in a safe place, and getting the data, so there’s no time to think about anything other than that.” 

What was harrowing was driving into Greenfield once the tornado had passed. “There’s clearly a path of destruction … In that narrow region [where the tornado went through], it was pretty raked over. People were still coming out of their houses, animals were still trying to get oriented.”

Rare Data from a Disaster

The radar data from the BEST team is high-resolution enough that researchers will be able to examine how specific structures in Greenfield failed in the high winds. “Measuring low-level winds very close to a town is very rare … we can see in a very localized area what these structures experienced,” Kosiba said. These grim analyses could assist damage assessors after future storms, and perhaps even help those building and maintaining man-made structures to make them safer.

“We’re in the preliminary stages of inventorying what we’ve got and what we can do,” said Kosiba. “But it’s a rich and unusual dataset.”

DOW8 in Greenfield
DOW8 vehicle in Greenfield after the tornado’s passage. Photo credit: Maiana Hanshaw/FARM Facility.

Strongest Winds Ever?

During the storm, the team was concerned only with acquiring good data. When they actually looked at the Greenfield readings, however, they were surprised to note winds of around 270 miles per hour, with gusts well above that. These one-second wind speeds are difficult to pinpoint exactly, said Kosiba, as the particles measured by radar — “debris, raindrops, grass, two-by-fours” — are all moving differently through the air and at different angles to the radar beam. “We’re trying to give a range, which puts this event at 309–318 mph.” The two strongest known tornadoes, El Reno in 2013 and Bridge Creek in 1999, both had DOW-measured wind speeds within that range.

Yet the Greenfield tornado was “only” deemed an EF4 by the National Weather Service (indicating three-second wind speeds up to 200 mph). This is likely because the EF scale is based on the structural damage a tornado leaves, not radar/instrument measurements. To receive the highest rating, EF5, a tornado has to damage structures to a degree that only an EF5 could. “It’s possible there was nothing [in its path] that could have sustained an EF5 level of damage,” said Kosiba. 

In addition, the highest wind gusts measured by the DOW team were for very short intervals, often less than one second, rather than longer-period averages. Due to the relative dearth of close-up measurements, we don’t know enough to say how unusual such high wind speeds near the surface really are.

Chasing the Data

“Twisters,” the long-anticipated sequel to the 1996 movie “Twister,” has hit movie screens, highlighting the awe of dangerous storms–and the divisions sometimes drawn between scientific researchers and those who chase storms because it’s their passion. As researchers and storm chasers who work together to get vital information about tornadoes, what do Kosiba and Walton think?

Jen Walton deploys a Pod of weather instruments in the path of the Greenfield tornado. Photo credit: BEST/FARM Facility.

“In my opinion, storm chasers are fonts of historical knowledge and expertise that are underutilized by the scientific community, and this is something I’m discussing with AMS and the broader research community,” said Walton. “We get a bad rap for being adrenaline junkies seeking our next thrill, and of course some folks are. But many people, myself included, would love to have more tangible ways to contribute in addition to already serving as eyes on the ground for the National Weather Service and/or working with local broadcast meteorologists. When Karen mentioned the opportunity to support the BEST Project, I jumped at the opportunity to use my own knowledge and expertise to contribute to work I know will truly make a difference in peoples’ lives – and even though my 2024 looked very different than a typical season, my time in the field with the DOWs is an experience I wouldn’t trade.”

“This kind of data collection is high risk but high payoff. You have to be out in the field to do it,” said Kosiba. “People who storm chase can make very valuable parts of the scientific team. Jen knows storm structure and forecasting … We want people who know what they’re looking at, who can think about exits; they need to be able to make some autonomous decisions out there. … If you just have a textbook understanding of storms, you have to get ramped up [on the practical side]. But people who’ve been looking at these storms for a long time and making decisions, that’s a great skill.”

To learn more about Girls Who Chase, listen to podcast interviews with experts like Dr. Kosiba, or even start your storm chasing education, check out girlswhochase.com.

To learn more about BEST and the DOWs, AMS Members and Weather Band members can watch our 23 July, 2024 webinar featuring Drs. Kosiba and Wurman and moderated by Jen Walton: Tornado on the Ground: DOW insights from 2024 tornadoes, including the Greenfield, IA EF4.

Asian American and Pacific Islander Heritage Month Spotlight: Dr. Tetsuya “Ted” Fujita

Tidal Basin with cherry blossoms and ducks (NPS photo)

By AMS President Anjuli S. Bamzai

Blossoming cherry trees are stars of springtime in Washington, D.C., and the most popular place to visit the cherry blossom trees is the Tidal Basin. Their bloom is one of the most joyful events of the year, awaited with much anticipation by tourists, meteorologists, local businesses, and the National Park Service.

Celebrating the friendship between the Japanese and American peoples, the Tidal Basin cherry trees were a gift from the Mayor of Tokyo to the United States in 1912. While the precise timing of peak bloom varies from year to year (April 4 on average, driven largely by winter/early spring temperatures), peak bloom has been occurring earlier due to warming trends. Furthermore, a combination of rising sea level and sinking land has necessitated plans for a new seawall that requires many existing trees to be removed. Yet the government of Japan has promised new trees to replace those that were lost.

This year’s beautiful blossoms strongly reminded me of the remarkable contributions of Japanese Americans — in particular Japanese American meteorologists. Our science would be especially bereft without the contributions of several scientists who, after receiving their advanced degrees at the University of Tokyo in the so-called “Syono school” of dynamic meteorology, immigrated to the U.S. from postwar Japan. Among them were Tetsuya Fujita, Akio Arakawa, Akira Kasahara, Kikuro Miyakoda, Takio Murakami, Katsuyuki Ooyama, Michio Yanai, and of course, Syukuro ‘Suki’ Manabe, one of the three recipients of the Nobel Prize in Physics in 2021.

Celebrating AAPI Heritage Month, in this post I chose to showcase the contributions of the legendary Dr. Tetsuya Theodore ‘Ted’ Fujita. Nicknamed “Mr. Tornado,” he linked tornado damage with wind speed and in 1971, developed the Fujita scale for rating tornado intensity based on ground and/or aerial damage surveys. He is also recognized as the discoverer of downbursts and microbursts, which are serious potential threats to aviation safety. Thus his discoveries made aviation safer.

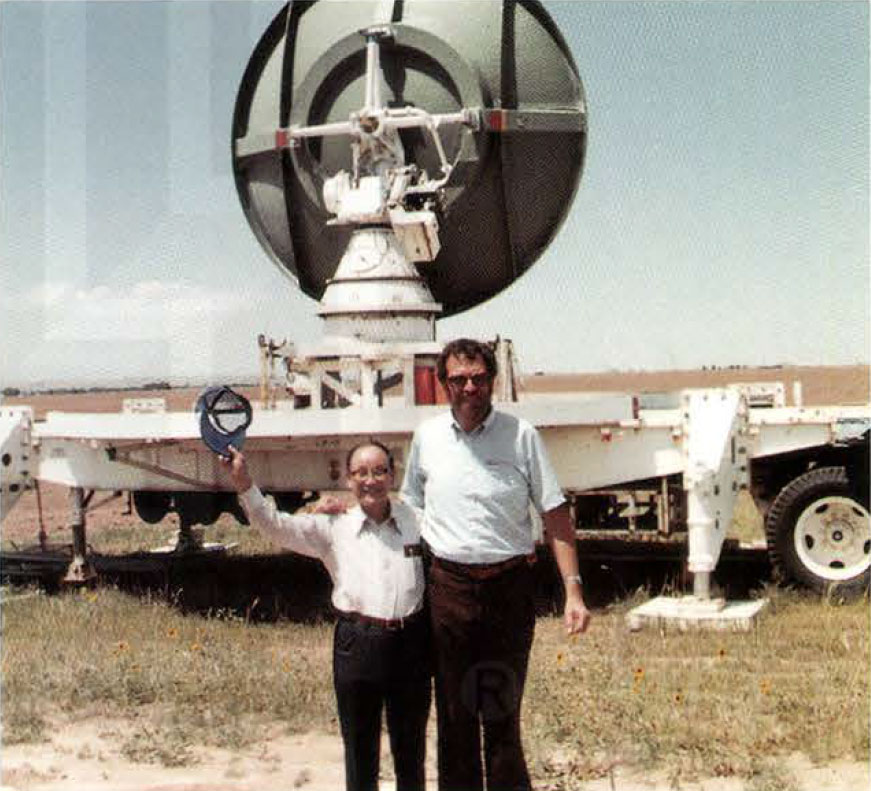
Fujita (left) with John McCarthy, Inaugural Director of NCAR-RAP/RAL, in 1982. After studying tornadoes for over two decades, Fujita had just seen his first one in person. Photo: Texas Tech, found in Fujita’s memoir, “Memoirs of an Effort to Unlock The Mystery of Severe Storms During the 50 Years, 1942–1992,” in the Texas Tech Southwest Collection/Special Collections Library.

But let’s take a step back. How did Fujita get interested in tornadoes in the first place? In part, his involvement was yet another legacy of the Manhattan Project: Fujita began his life’s work studying damage in Hiroshima and Nagasaki in the aftermath of the atomic bombs.

Fujita was working as assistant professor in physics at Meiji College of Technology in Tobata, exactly halfway between the two cities. A couple of years earlier, in compliance with his dying father’s wishes, he had opted to go to Tobata for his studies in mechanical engineering rather than Hiroshima. In the month following the bombings, Fujita and his team of students went on an observational mission to study the blast zones at both sites. At Nagasaki, through studying the burn marks of various objects, Fujita had the goal of estimating the position of the atomic bomb when it exploded. At ground zero, most trees, though scarred black by radiation, were still standing upright while buildings were in ruins. Seen from above, it looked like a giant starburst pattern.

After WWII ended, he joined the University of Chicago. By a stroke of genius, the Japanese American meteorologist was able to draw comparisons between severe weather and the nuclear shock waves he had studied some twenty-five years earlier at Hiroshima and Nagasaki, through studying the debris and damage of tornadoes before cleanup. He led the development of the Fujita Scale to categorize tornado intensity, a modified version of which remains in use today.

Following the Super Outbreak of 3–4 April, 1974, which covered over 2,600 miles and produced nearly 150 tornadoes in an 18-hour period, Fujita carried out aerial and ground damage surveys covering over 10,000 miles. Through meticulous analysis of the observational data, he demonstrated the existence of smaller tornadoes — suction vortices — within the parent tornado. The aerial surveys also led to the discovery of microbursts.

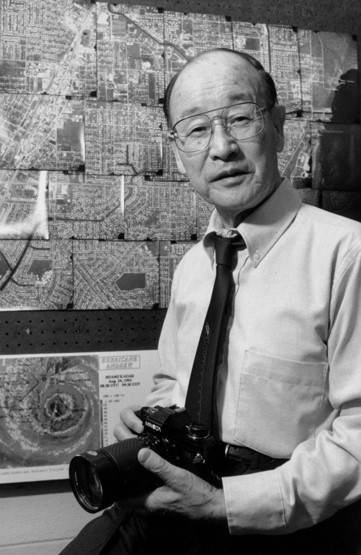
Photo: Dr. Fujita as a professor of Geophysical Sciences at the University of Chicago, photo taken in April 1961. Special Collections Research Center, University of Chicago Library.

You can read more about his discovery of the downburst and its contributions to aviation safety (including his work as a principal investigator for the National Intensive Meteorological Research On Downburst [NIMROD] project) here.

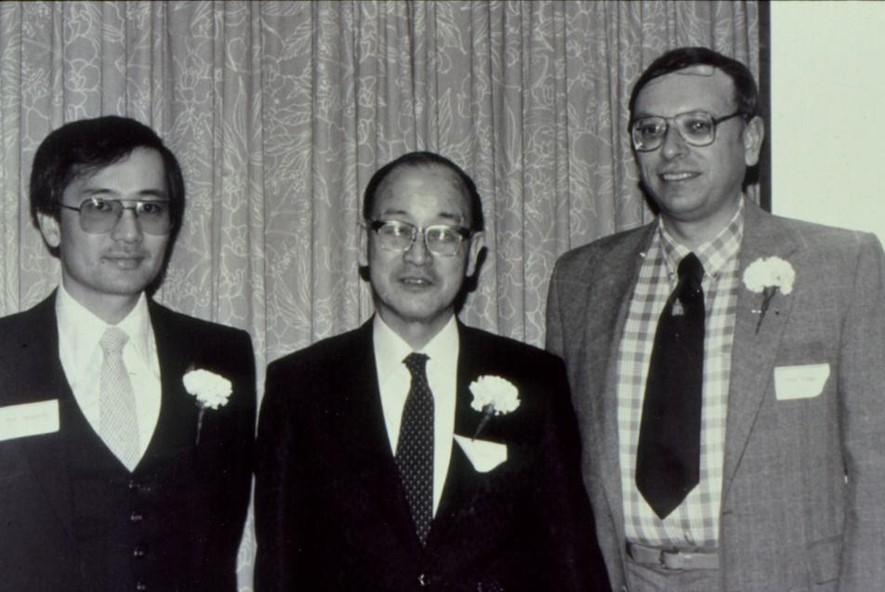
In 2000, two of his former students organized the “Symposium on the Mystery of Severe Storms: A Tribute to the work of T. Theodore Fujita,” held at the 80th AMS Annual meeting. They were none other than Gregory S. Forbes from The Weather Channel and Roger M. Wakimoto from UCLA, both distinguished meteorologists in their own right. Roger was of course our AMS President in 2017–2018. The photo below shows the three of them at an event at the University of Chicago from the early 1980s.

Dr. Roger Wakimoto (left), Dr. Ted Fujita (middle) and Dr. Gregory Forbes (right), taken in the early 1980s when all were at the University of Chicago. Photo Courtesy of Roger Wakimoto, honorary member of the AMS.

You can read the proceedings of the Symposium here to get a fuller sense of Fujita’s immense contributions to atmospheric science. In this short piece, I have barely scratched the surface.

You can also learn about Fujita through the PBS American Experience series, which describes events and people who have shaped the landscape over the course of history. Fujita is profiled in the episode titled, “Mr. Tornado.”

Featured image: Cherry blossoms surround the Tidal Basin in Washington, D.C. Photo: National Park Service, Kelsey Graczyk

Anjuli is grateful to Katherine ‘Katie’ Pflaumer for providing useful edits.

Be There: Estimating Wind Speeds of Tornadoes and Other Windstorms

Tornado photo

By James LaDue, NOAA/NWS Warning Decision Training Division (symposium co-chair)

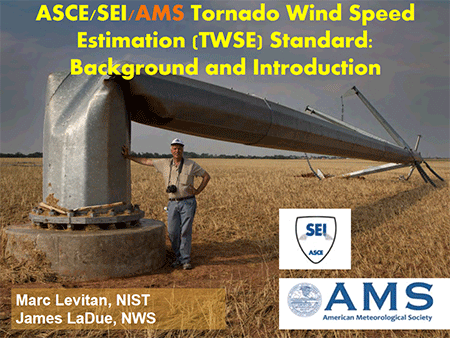
Did you know that the AMS is co-branding a standard with the American Society for Civil Engineers and that you can be involved as a member? For the past several years, both organizations have signed together to develop a standard on wind speed estimation for tornadoes and other severe storms. To learn more about this standard, and the methods it’s developing, the standards committee on Wind Speed Estimation is hosting a symposium this Thursday at the AMS 104th Annual Meeting, aptly named “Estimating Wind Speeds of Tornadoes and Other Windstorms.” In this conference you will learn more about how you can be involved in the process.

Ever since the EF scale was implemented in 2007, damage surveyors found reasons for improvement. They formed a grassroots stakeholder group in 2010 and published a paper in 2013 highlighting areas needing improvement. Then after the Joplin, MO tornado of 2011, an investigation led by NIST recommended that a committee be formed to improve the EF scale. But that’s not all there was to estimating wind speeds. New methods were maturing quickly to estimate winds in severe storms: methods such as Doppler radar, tree-fall patterns left behind tornadoes, probabilistic wind speed analysis forensics, multispectral passive remote sensing, and in-situ observations. Many of these methods can also be applied to other windstorm types.

The committee on Wind Speed Estimation, begun within the ASCE in 2015, is devoted to refining all of these methods into an ANSI standard (American National Standard).  Comprised of engineers, meteorologists, architects, forest ecologists, an arborist, and an emergency manager, we are now deep in the internal balloting phase of the standard’s individual chapters. While the ASCE provides the logistical support for our committee, the AMS was added and the standard co-branded under both organizations. The process by which a standard forms is one of the most rigorous vetting processes known in the STEM fields and often can take a decade or more. We’ve been conducting internal ballots for several years, and this may last a couple more. Once the internal balloting phase is over, the standard goes to a public comment phase.  

The Wind Speed symposium is designed to let you know how and why we have this standards process, how the methods are designed in the standard, and how you can be involved, especially when the public comment period commences. We have a panel discussion at the beginning to give you a chance to engage with the committee, followed by more in-depth presentations on the methods. There are also oral and poster presentations regarding new science coming out that could provide more advances in the standard and its application. We hope to see you there! 

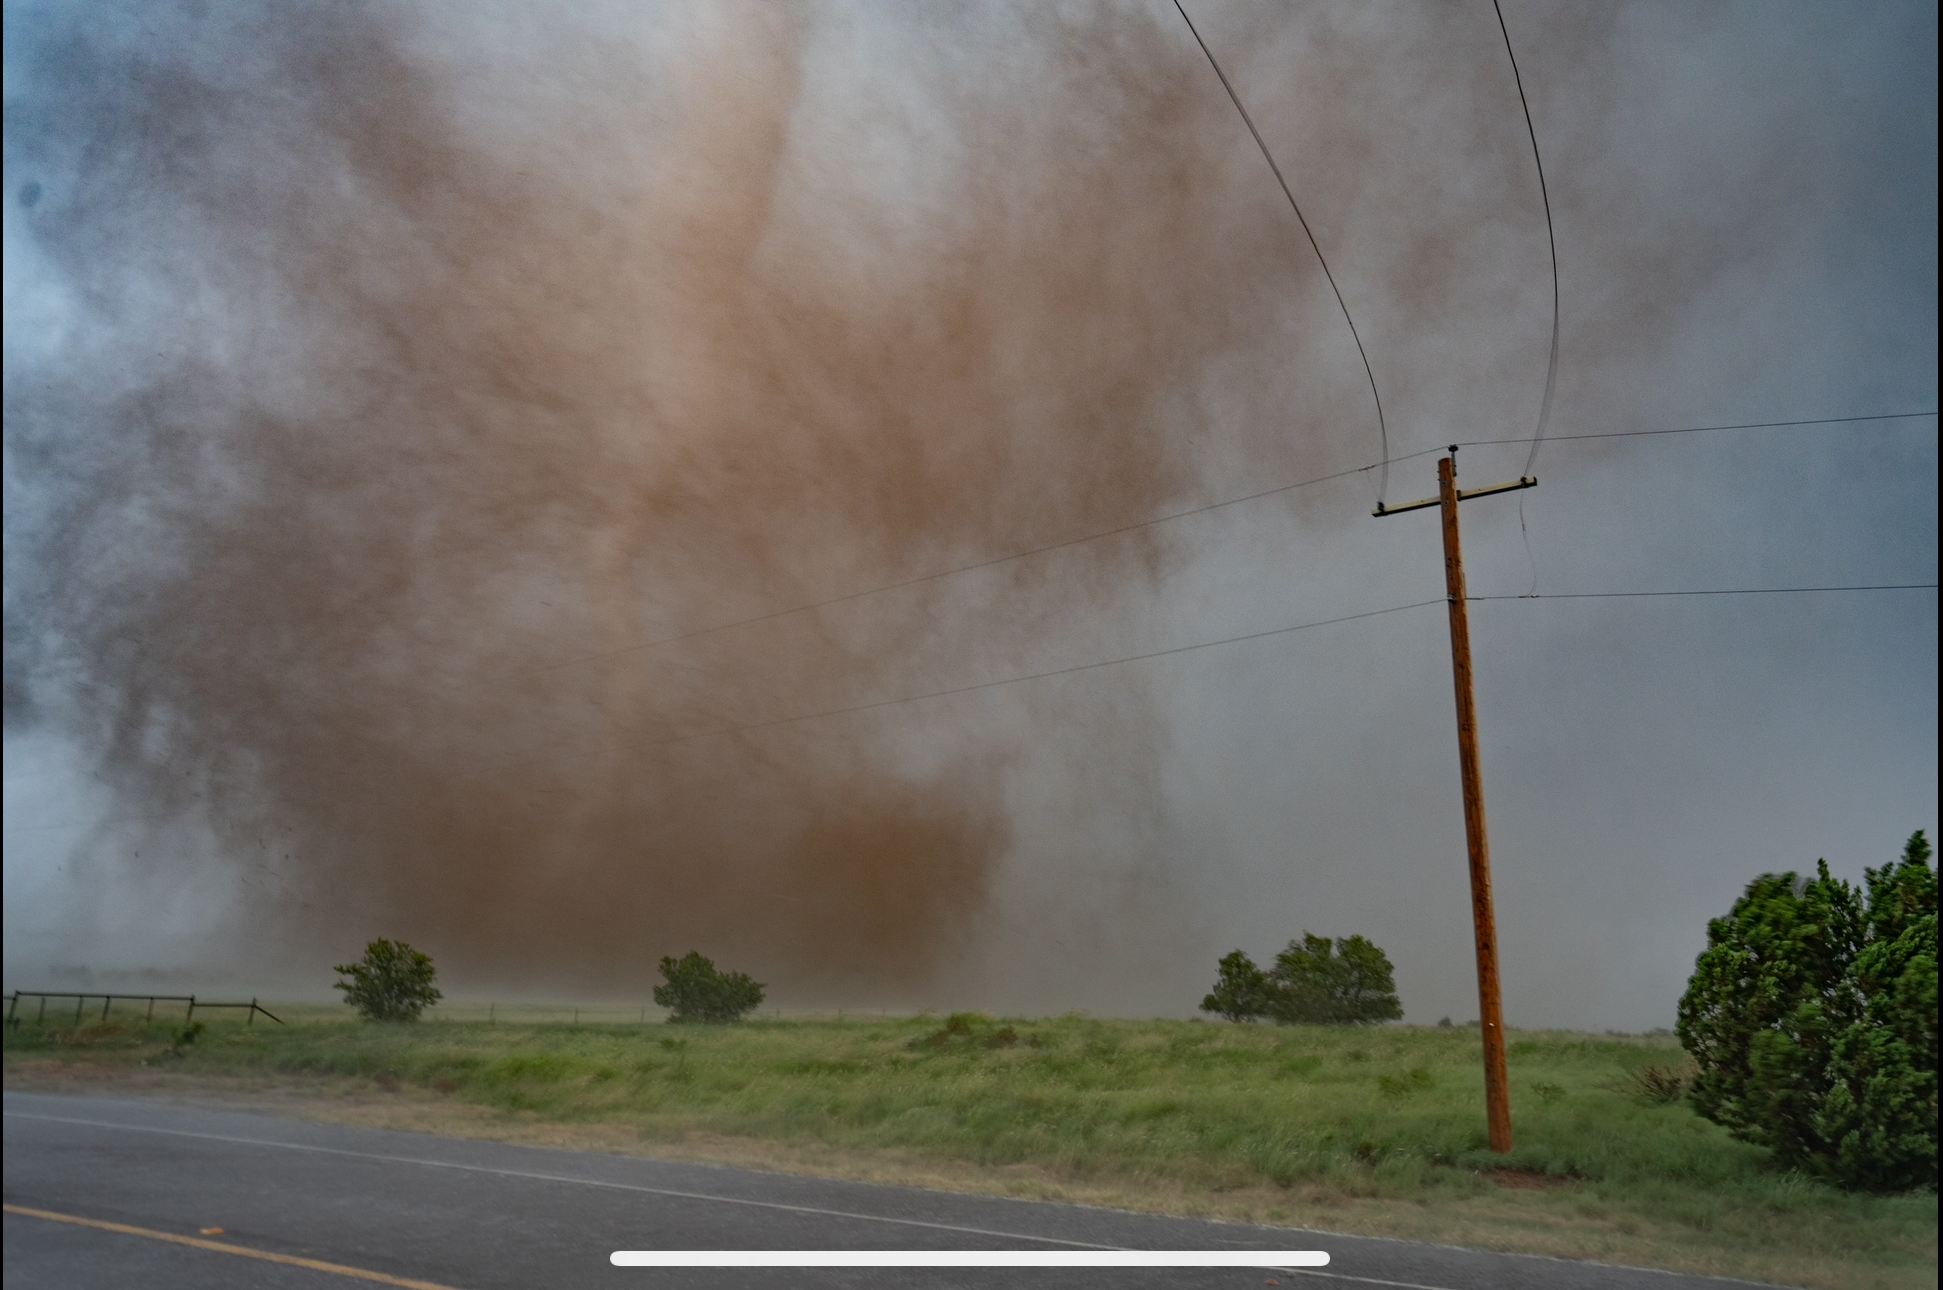
Featured image: Photo of tornado with dust cloud near power lines in Matador, TX, taken 21 June 2023. Image credit: James LaDue.

The Estimating Wind Speeds of Tornadoes and Other Windstorms Symposium will be held Thursday, 1 February, 2024 at the AMS 104th Annual Meeting, in Baltimore and online. Learn more about the Symposium and view the program.

Southeasterners Perceive Tornado Risk Dangerously Different Than They Should, Especially at Night

While a major winter storm last month was plastering the United States from Texas and New Mexico to New England with heavy snow and ice, volatile conditions in the Southeast (SE) spawned damaging and deadly tornadoes. One of these overnight Monday, February 16, tragically took the lives of 3 people and injured 10 in coastal North Carolina. Such nocturnal tornadoes are common in the Southeastern U.S.—a unique trait—and represent an extreme danger to sleeping residents.


Compounding this problem, new research in the AMS journal Weather, Climate, and Society suggests there may be a deadly disconnect between tornado perception and reality in the region right when residents instead need an acute assessment of their tornado potential.
The article “Do We Know Our Own Tornado Season? A Psychological Investigation of Perceived Tornado Likelihood in the Southeast United States,” by Stephen Broomell of Carnegie Mellon University, with  colleagues from Stanford and NCAR, notes the tragic results of the regional misperception:

The recurring risks posed by tornadoes in the SE United States are exemplified by the significant loss of life associated with recent tornado outbreaks in the SE, including the 2008 Super Tuesday outbreak that killed over 50 people and the devastating 27 April 2011 outbreak that killed over 300 people in a single day.

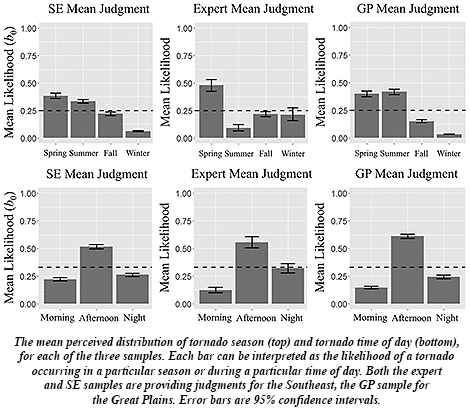
Their survey of residents in seven states, from Louisiana and Arkansas to Georgia and Kentucky, representing the Southeastern region, finds that the residents perceive their tornado likelihood differently than meteorologists and experts familiar with Southeastern tornado risk. This puts them at great risk because residents’ experiences don’t match what actually happens where they live.

Broomell and his fellow researchers contend that Southeast residents may be misusing knowledge of Great Plains tornado events, ubiquitous in tornado chasing reality shows and social media videos, when determining their own risk. A fatal flaw since tornado behavior is different between the two regions.
WCAS SE tornado season survey2For starters, unlike in infamous “Tornado Alley” states of Texas and Oklahoma north through Nebraska and Iowa into South Dakota, the Southeast lacks a single, “traditional” tornado season, with tornadoes “spread out across different seasons,” Broomell along with his coauthors report, including wintertime. The Southeast also endures more tornadoes overnight, as happened last week in North Carolina. And they spawn from multiple types of storm systems in the Southeast, more so than in the Great Plains. This makes knowledge about residents’ regional tornado likelihood especially critical in Southeastern states.
Another recent study published in the Bulletin of the American Meteorological Society, “In the Dark: Public Perceptions of and National Weather Service Forecaster Considerations for Nocturnal Tornadoes in Tennessee,” by Kelsey Ellis (University of Tennessee, Knoxville), et al., surveyed residents of Tennessee and came away with similar findings about tornado timing: about half of Tennessee’s tornadoes occur at night, and yet less than half of those surveyed thought they would be able to receive nighttime tornado warnings.

Local forecasters and broadcast meteorologists as well as emergency managers are tuned into the mismatch. In the BAMS study, NWS forecasters said they fear for the public’s safety, particularly with nighttime tornadoes, because they “know how dangerous nocturnal events are”—fatalities “are a given,” some said.

Ellis and her colleagues recommended developing a single, consistent communication they term “One Message” to focus on getting out word about the most deadly aspect of the tornado threat. Forecasters, broadcasters, and emergency managers through regular and social media would then be consistent in their messaging to residents, the researchers state, decreasing confusion. For example:

Nighttime tornadoes expected. Sleep with your phone ON tonight!

With severe weather season ready to pop as spring-like warmth quickly overwhelms winter’s icy grip in the next couple of weeks, the nation’s tornado risk will blossom across the South and Southeast. And nocturnal tornado threats will only increase, particularly in the Southeast, as February turns into March, and then April—a historically deadly month.
For residents in places more prone to nighttime tornadoes, Ellis et al. say the ways to stay safe are clear:

Have multiple ways to get tornado warnings, do not rely on outdoor sirens, sleep with your phone on and charged during severe weather, and do not stay in particularly vulnerable locations such as mobile homes or vehicles.

"Sleep with your phone on!": Messaging for Nighttime Tornadoes

With Hurricane Delta poised to strike Louisiana today, the risk of embedded tornadoes will increase as rainbands spiral ashore, along with the primary threats of storm surge and damaging winds. Delta is forecast to plow well inland Friday night into the weekend, continuing a low risk for tornadoes, some of which could occur at night in Alabama, Mississippi and into southern Tennessee. The threat is more than a bit worrisome as new research in BAMS finds through phone surveys and followup interviews in Tennessee that people are woefully unprepared for nocturnal tornadoes.
In their article,” Kelsey Ellis and colleagues found a host of poor practices by residents when it comes to tornadoes at night. The authors recommend forecasters narrow their messaging about nocturnal tornadoes in the Southeast to a single important message to limit confusion.
Almost half of Tennessee’s tornadoes occur at night, as in other Southeast states with large numbers of nocturnal tornadoes, and are two-and-a-half times as deadly as daytime tornadoes. This creates detection, warning, and public response challenges. Yet, respondents in the western part of the state overestimated tornado occurrence at night while those in the east substantially underestimated the number.
Additionally, nearly half of participants in the survey say they rely on sirens to receive tornado warnings. This is despite the fact that sirens are not designed to warn people inside nor be loud enough to wake anyone up. Instead, Wireless Emergency Alerts (WEAs) “should be a constant,” the authors say. Also, people mentioned they rely on TV and social media for receiving warnings even though generally neither will wake you up.
The authors felt it was “dangerous” that even the more tech savvy and tornado aware respondents answered they were compelled to look outside for evidence of a tornado—even in the dark. Interviewees explained they were “checking for sounds instead of visual cues.”
NWS forecasters were also surveyed about nocturnal tornadoes. The forecasters mentioned the lack of ground truth and fear for public safety among challenges to the nighttime warning service. They noted few spotter or social media reports inform them if “the storm is actually showing the signs on the grounds that radar is indicating aloft.” Forecasters said they felt “fearful, worried, or nervous for the public during nocturnal tornadoes because fatalities ‘are a given.’”
The survey responses moved Ellis et al. to recommend a single-emphasis message be presented to residents to combat the nighttime tornado problem:

One strategy that may improve public safety during a nocturnal tornado event, and which addresses the forecaster challenge of communication prior to and during an event, is to develop “One Message”—a consistent message that EMs and the media use throughout broadcasts, briefings, and social media. Examples of messages could be: “Nighttime tornadoes expected. Sleep with your phone ON tonight!” or “Tornadoes will form quickly! Make plans now where you will take shelter!” or “If you live in a manufactured home, you may not have much time to seek shelter tonight!” One Message may decrease confusion for receivers, making them more likely to make safe decisions. Messages could similarly be used to dispel misconceptions about local geography in ways relevant to the specific listening area, for example: “You are not protected by nearby hills. Seek shelter immediately!”

With Hurricane Delta’s nighttime tornado threat ramping up, the authors suggest people use multiple ways to receive warnings, keeps phones on and charged, don’t rely on tornado sirens, and if possible relocate ahead of the weather from “particularly vulnerable” situations, such as mobile homes and vehicles.

“Sleep with your phone on!”: Messaging for Nighttime Tornadoes

With Hurricane Delta poised to strike Louisiana today, the risk of embedded tornadoes will increase as rainbands spiral ashore, along with the primary threats of storm surge and damaging winds. Delta is forecast to plow well inland Friday night into the weekend, continuing a low risk for tornadoes, some of which could occur at night in Alabama, Mississippi and into southern Tennessee. The threat is more than a bit worrisome as new research in BAMS finds through phone surveys and followup interviews in Tennessee that people are woefully unprepared for nocturnal tornadoes.

In their article,” Kelsey Ellis and colleagues found a host of poor practices by residents when it comes to tornadoes at night. The authors recommend forecasters narrow their messaging about nocturnal tornadoes in the Southeast to a single important message to limit confusion.

Almost half of Tennessee’s tornadoes occur at night, as in other Southeast states with large numbers of nocturnal tornadoes, and are two-and-a-half times as deadly as daytime tornadoes. This creates detection, warning, and public response challenges. Yet, respondents in the western part of the state overestimated tornado occurrence at night while those in the east substantially underestimated the number.

Additionally, nearly half of participants in the survey say they rely on sirens to receive tornado warnings. This is despite the fact that sirens are not designed to warn people inside nor be loud enough to wake anyone up. Instead, Wireless Emergency Alerts (WEAs) “should be a constant,” the authors say. Also, people mentioned they rely on TV and social media for receiving warnings even though generally neither will wake you up.

The authors felt it was “dangerous” that even the more tech savvy and tornado aware respondents answered they were compelled to look outside for evidence of a tornado—even in the dark. Interviewees explained they were “checking for sounds instead of visual cues.”

NWS forecasters were also surveyed about nocturnal tornadoes. The forecasters mentioned the lack of ground truth and fear for public safety among challenges to the nighttime warning service. They noted few spotter or social media reports inform them if “the storm is actually showing the signs on the grounds that radar is indicating aloft.” Forecasters said they felt “fearful, worried, or nervous for the public during nocturnal tornadoes because fatalities ‘are a given.’”

The survey responses moved Ellis et al. to recommend a single-emphasis message be presented to residents to combat the nighttime tornado problem:

One strategy that may improve public safety during a nocturnal tornado event, and which addresses the forecaster challenge of communication prior to and during an event, is to develop “One Message”—a consistent message that EMs and the media use throughout broadcasts, briefings, and social media. Examples of messages could be: “Nighttime tornadoes expected. Sleep with your phone ON tonight!” or “Tornadoes will form quickly! Make plans now where you will take shelter!” or “If you live in a manufactured home, you may not have much time to seek shelter tonight!” One Message may decrease confusion for receivers, making them more likely to make safe decisions. Messages could similarly be used to dispel misconceptions about local geography in ways relevant to the specific listening area, for example: “You are not protected by nearby hills. Seek shelter immediately!”

With Hurricane Delta’s nighttime tornado threat ramping up, the authors suggest people use multiple ways to receive warnings, keeps phones on and charged, don’t rely on tornado sirens, and if possible relocate ahead of the weather from “particularly vulnerable” situations, such as mobile homes and vehicles.

Website Tracks Public Understanding of Tornadoes

Imagine you live in a part of the country where few people have experienced tornadoes. It would make sense that your neighbors wouldn’t know the difference between a tornado watch or warning, or know how to seek safety.

A new, openly available online tool shows exactly that, by combining societal databases with survey results about people’s understanding of weather information. But there are some surprising wrinkles in the data. For example, the database drills down to county-level information and finds “noteworthy differences” within regions of similar tornado climatology.

How is it that Norman, Oklahoma, residents score higher in what people think they know of severe weather information than those in Fort Worth, Texas? And why is there a similar gap between what people actually do know, as tested in Peachtree City, Georgia, versus Birmingham, Alabama?

“Differences like this create important opportunities for research and learning within the weather enterprise,” say Joseph T. Ripberger and colleagues, who describe the weather demographics tool in a recently published Bulletin of the American Meteorological Society article. “The online tool—the Severe Weather and Society Dashboard (WxDash)—is meant to provide this opportunity.”

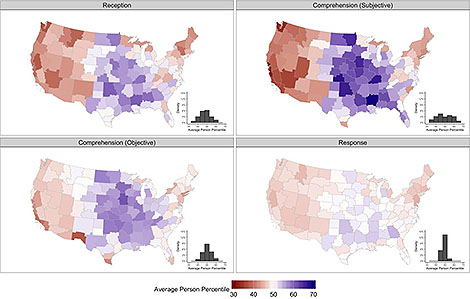
For example, in one key set of metrics, the WxDash website looks at survey data on how well people receive and pay attention to tornado warnings (reception), how well they understand that information (both “subjective” comprehension—what people think they know—and “objective” comprehension—what they actually know), and response to tornado warnings.

From the BAMS article, a figure showing knowledge and response to average person percentile (APP) estimates of tornado warning reception, subjective comprehension, objective comprehension, and response by county warning area (CWA). The inset plots indicate the frequency distribution of APP estimates across CWAs. These estimates compare the average percentile of all adults who live in a CWA to the distribution of all adults across the country. For example, an APP estimate of 62 indicates that, on average, adults in that CWA score higher than 62% of adults nationally. The range of APP scores is wide. CWAs range from 38 to 61 on the reception scale, 32 to 69 on the subjective comprehension scale, and 37 to 60 on the objective comprehension scale. Response scores vary less. Not surprisingly, all categories broadly reflect the higher frequency of tornadoes in middle and southeastern CWAs.


WxDash combines U.S. Census data with an annual Severe Weather and Society Survey (Wx Survey) by the University of Oklahoma Center for Risk and Crisis Management. The database then “downscales” the broader scale information to the local level, in a demographic equivalent to the way large scale climate models downscale to useful information on regional scales.

The site also provides information on public trust in weather information sources, perceptions about the efficacy of protective action, vulnerability to beliefs about a variety of tornado myths, and other weather-related factors that can then be studied in light of regional and demographic factors.

Some of the key findings seen in the database:

  • Men and women demonstrate roughly comparable levels of reception, objective comprehension, and response, but men have more confidence in subjective warning comprehension than women.
  • Tornado climatology has a relatively strong effect on tornado warning reception and comprehension, but little effect on warning response.
  • The findings suggest that geography, and the community differences that overlap with geographic boundaries, likely exert more direct influence on warning reception and comprehension than on response.

Even the relatively expected relation of severe weather climatology to severe weather understanding is problematic, Ripberger and colleagues write.

Tornadoes are possible almost everywhere in the US and people who live on the coasts can move—both temporarily and permanently— throughout the country. These factors prompt some concern about the low levels of reception and comprehension in some communities, especially those in the west.

In addition to interacting with these data, you can download one of the calculated databases for community-scale information, the raw survey data, and the code necessary to reproduce the calculations.

The idea is social scientists can dig in and figure out why what we know about weather isn’t nearly as closely correlated with what we experience as we might think. The hope is an improvement in public education and risk communication strategies related to severe weather.

10-m Resolution Quarter-Trillion Gridpoint Tornadic Supercell Simulation Mesmerizes

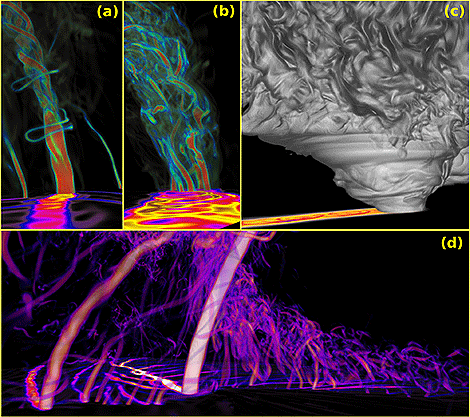
An exceptionally high resolution simulation of a supercell thunderstorm fascinated conferees Tuesday at the AMS 100th Annual Meeting in Boston. Leigh Orf of the University of Wyoming presdented imagery and animations of the simulation that ran on the Blue Waters Supercomputer. With a 10 m grid spanning 11,200 X 11,200 X 2,000 (251 billion) grid volumes, the 270 TB subdomain contains the entire life cycle of the tornado, including 10 minutes prior to tornado formation.

Image created with VAPOR3 of a 10-m supercell simulation. (a) Volume rendered cyclonic vertical vorticiy, highlighting the 3D structure of the tornado shortly after formation.
Image created with VAPOR3 of a 10-m supercell simulation. (a) Volume rendered cyclonic vertical vorticity, highlighting the 3D structure of the tornado shortly after formation. The 2D surface field traces the maximum surface cyclonic vertical vorticity, providing a representation of the tornado’s path. The view is following the tornado’s path. (b) As in (a), but later in the simulation when the tornado exhibits a multiple vortex structure. (c) Volume rendered cloud mixing ratio, with parameters chosen to present a quasi-photorealistic view of the cloud field. The 2D surface field traces the minimum pressure found in the tornado’s path. (d)  As in (a) and (b), but a different, wider view and utilizing different opacity and color map choices. The vortex to the left, which merges with the tornado later in the simulation, is weaker than the nascent tornado as evidenced by the vortex’s more transparent and darker visual presentation and path.


Tornado Researchers Gather to Improve Wind Speed Estimation

The Wind Speed Estimation (WSE) standards committee–jointly supported by AMS and the American Society of Civil Engineers–is holding its 9th meeting this week in conjunction with an NSF-funded Tornado Hazard Wind Assessment and ReducTion Symposium (THWARTS) at the University of Illinois in Champaign-Urbana.
The WSE committee began in 2014 to develop standards for an improved process to estimate extreme storm winds. Currently, NWS and private post-storm damage surveys use the EF-Scale and treefall pattern analysis, real-time radar and in situ observations, remote sensing, and forensic investigations. The WSE committee includes a data archival team as well as an international working group to broaden the scope of the standard. (Click here for more information about the committee.)
WSE
This is the second joint meeting of WSE/THWARTS and will focus on sharing the latest findings on the multidisciplinary aspects of severe local storms, including the fields of meteorology, wind science and engineering, structural engineering, social science, and policy. A flyer about the symposium with basic information is available online.
Keynote speaker for THWARTS will be Erik Rasmussen. He was the field coordinator of the first of the VORTEX projects in 1994-1995 and a lead principal investigator for VORTEX2 from 2009-2010 and VORTEX-SE from 2016-2017. He currently consults with NOAA’s National Severe Storms Laboratory and the Cooperative Institute for Meteorological Satellite Studies.
The WSE meeting begins after the final session of THWARTS. The meeting is the first step toward a request for public comment on WSE, likely next year.