A Research Spotlight from 32WAF/20Meso/28NWP
An irrigation oasis in Inner Mongolia, China, is providing unusual, real-world evidence about the effects of sharp vegetation contrasts on local and regional weather. Several presentations at the 32nd Conference on Weather Analysis and Forecasting, the 20th Conference on Mesoscale Processes, and the 28th Conference on Numerical Weather Prediction (32WAF/20Meso/28NWP) discussed findings from the 2022 DEsert-oasis COnvergence line and Deep convection Experiment (DECODE).
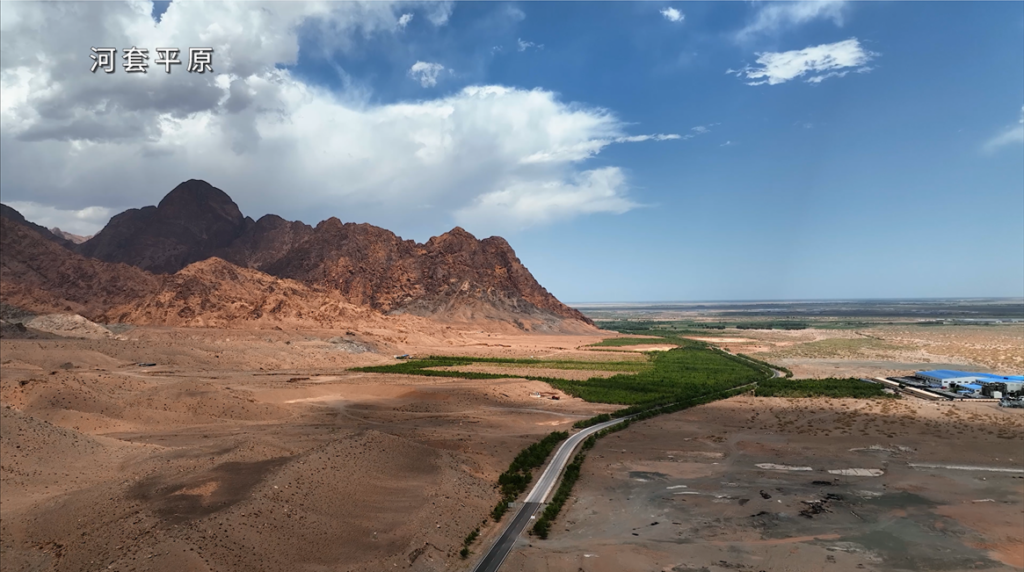
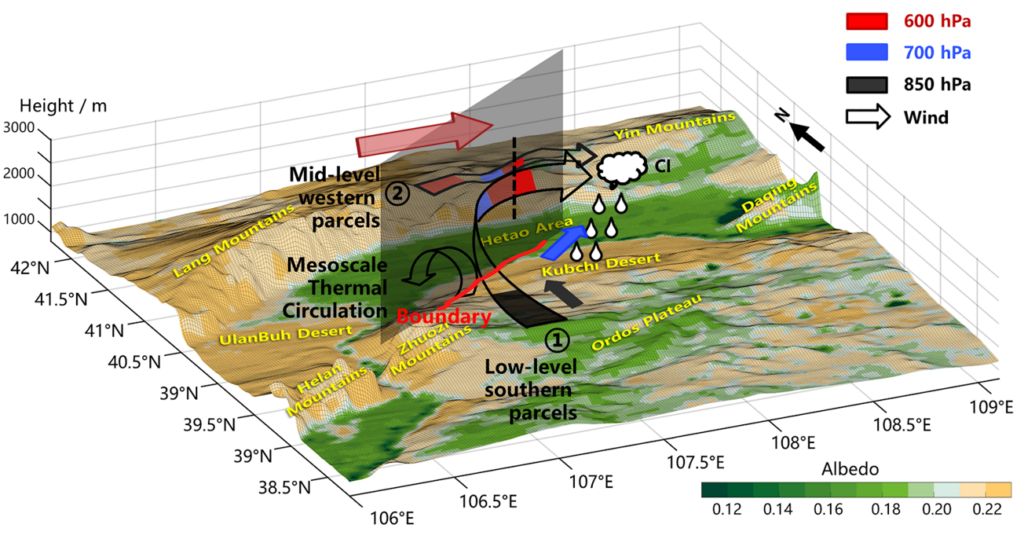
In Bayannur City, on the north side of a bend in the Yellow River, sits one of China’s largest irrigated areas: the 2,200-year-old, 769,333 hectare Hetao Irrigation District (HID), which was recognized as a World Heritage Irrigation Structure in 2019. All around this irrigation oasis is arid and semi-arid land, including the Kubuqi Desert to the south. We know that borders between land and water influence weather patterns, but there has been less real-world evidence gathered about the effects of differences in vegetation—and you can’t find a sharper divide than this one.
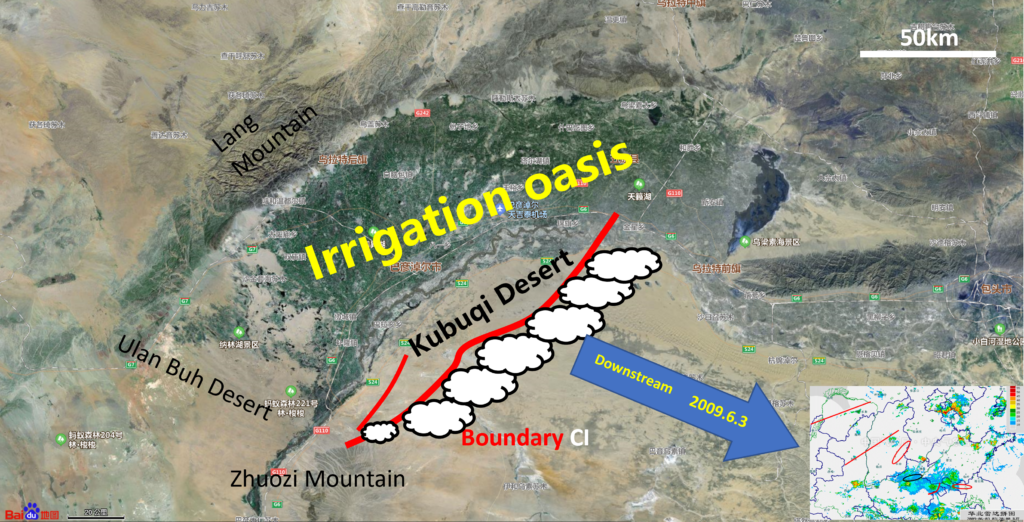
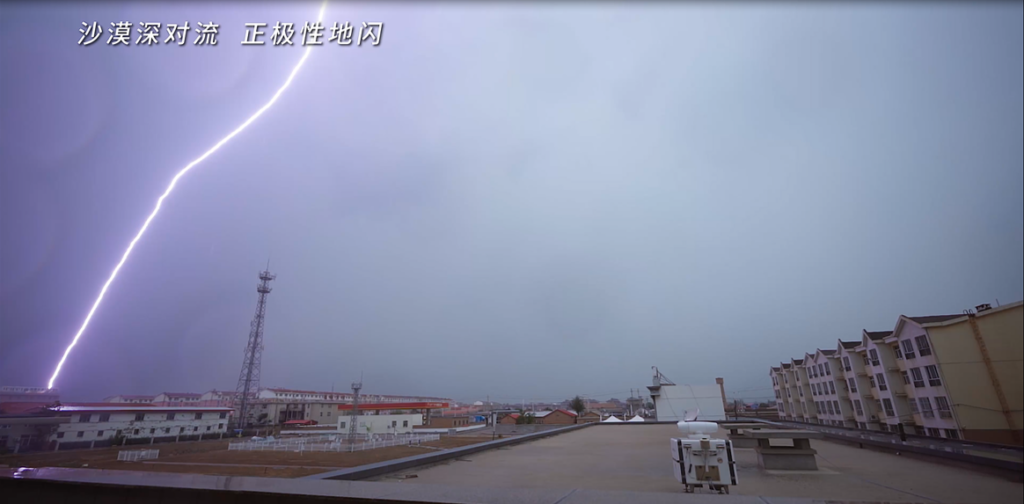
When cooler air from the Irrigation District meets warm wind from the desert, an atmospheric boundary line can sometimes be seen on radar. During the summer, convection often initiates at this boundary—sometimes leading to impressive storms that can travel long distances. DECODE researchers used a comprehensive set of observations—from radar and satellite to balloon sondes to flyovers—to examine this phenomenon. Their mission was to understand how the boundary forms and under what circumstances it might create unusual weather.
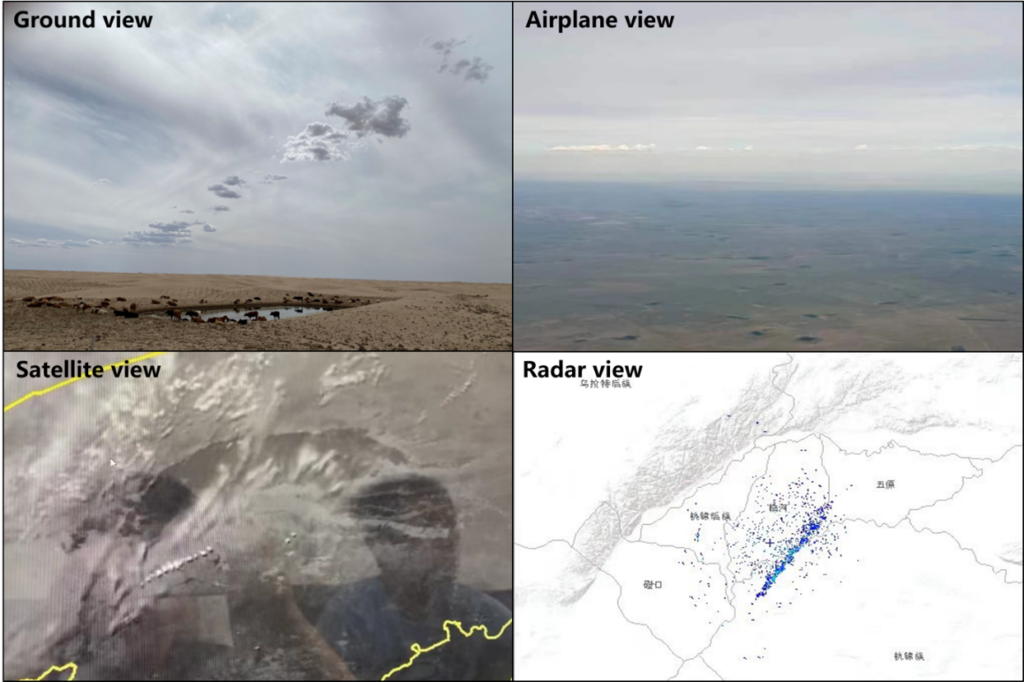
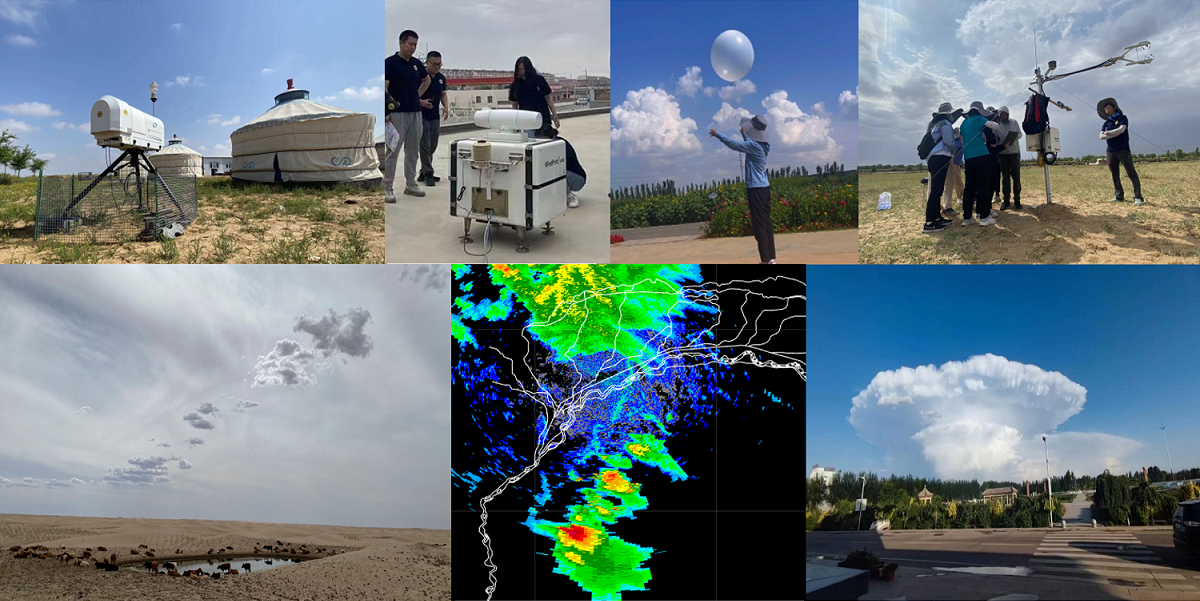
Different views of the boundary. Images courtesy of Zhiyong Meng.
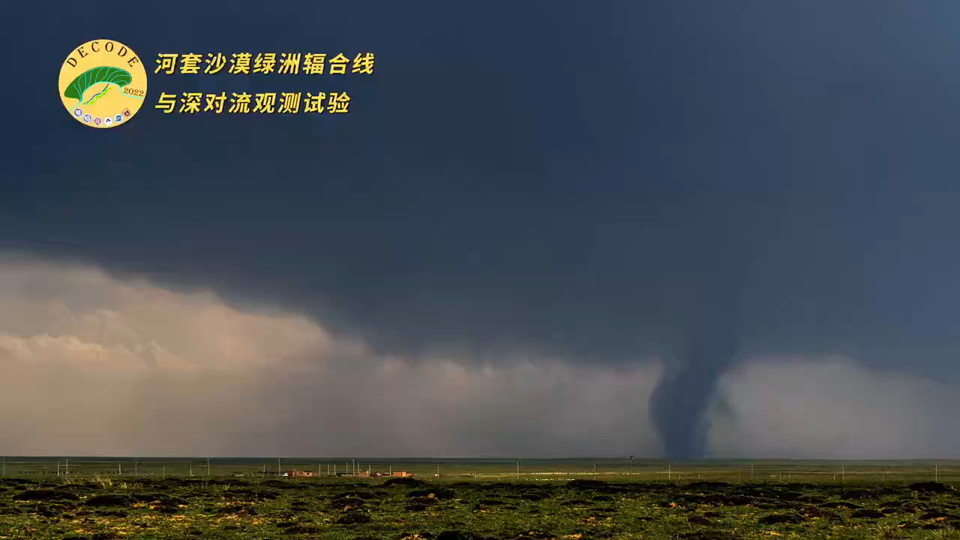
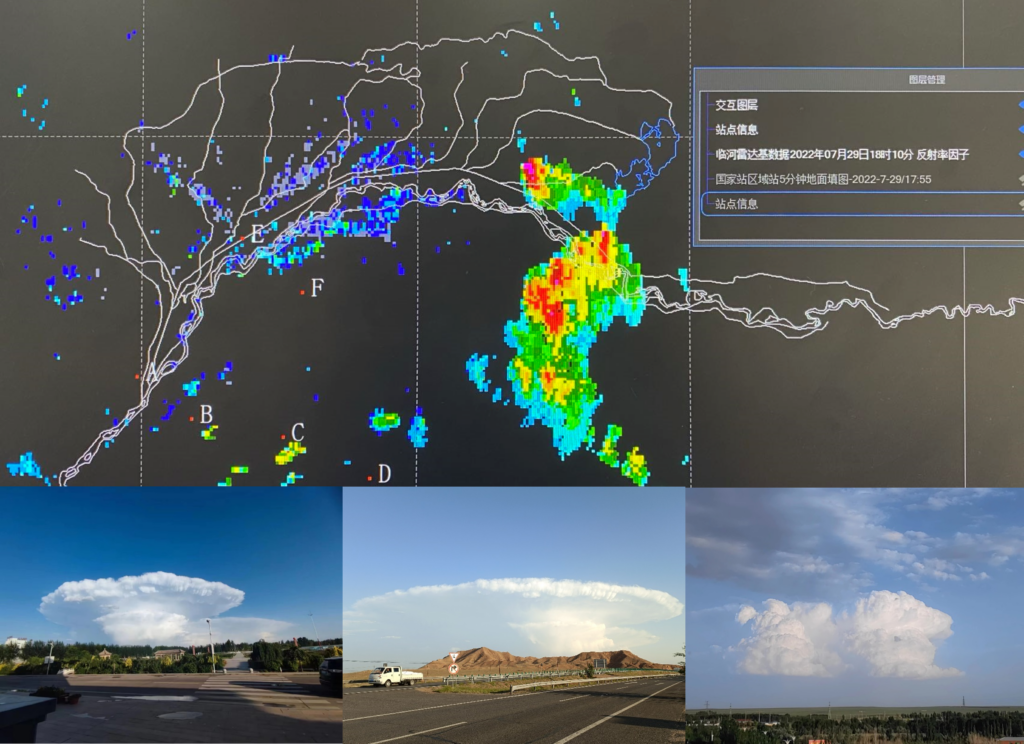
On average, in the three months of summer each year from 2012 to 2016, 60 days produced a boundary, and 44 percent of those boundaries resulted in convective initiation (CI), noted Zhiyong Meng, of Peking University, in her July 20 presentation during Session 16 of 32WAF/20Meso/28NWP. The DECODE field experiment itself lasted 36 days in 2022, from 5 July to 9 August. With two field stations located on the oasis side, and four on the desert side, the teams were able to observe 23 boundaries and 11 occurrences of deep convection initiation, and even one case of a tornado.
Yipeng Huang, of Xiamen Key Laboratory of Straits Meteorology, outlined the most common conditions leading to a boundary/CI in a 21 July presentation. The researchers found that a boundary is most likely on warm summer days, when synoptic forcing is relatively weak, with dominant southerly winds opposing the oasis breeze, and a temperature over the desert that is apparently warmer than over the oasis. They found that along the boundary line between the two masses of air, convection initiation may occur when enough moist air advects north at the west edge of the subtropical high, moves out over the dry desert, and converges with a cool oasis breeze in an environment with large enough instability. Hongjun Liu of Peking University presented the mechanism for this process in a case study on 21 July.
Meng described “The most beautiful case, on July 29 [2022, when] the boundary produced a CI and the storm became very strong; it actually produced five-millimeter hail in the eastern part of the oasis.” They were also able to observe another storm as it split into two separate supercells. On July 25, a preexisting storm that passed over the area dissipated somewhat, likely due to sinking air over the oasis, then re-initiated strongly once it reached the boundary/convergence line over the desert. On occasion, the boundary would extend over the oasis and strongly increase the precipitation there.
In the presentation immediately following Meng’s, Murong Zhang of Xiamen University noted that the team’s real-time forecasts were able to predict the formation of the boundary line in 21 out of 23 cases, although predicting convection initiation was more difficult. They were only able to predict 6 out of 11 CIs, as the numerical model tended to over-predict surface temperature, but under-predict moisture. The observations obtained from DECODE have been used to effectively improve the surface heat flux over the irrigated area, as shown in a presentation by Xuelei Wang of Peking University on the first day of the conference. You can see more from the DECODE team in this video created as part of the project:
With researchers from many institutions* participating, DECODE is an epic undertaking to study a unique natural phenomenon. As field research pioneer Prof. Edward Zipser of Utah University noted after Zhang’s talk, it’s “a program that we want to hear more about.”
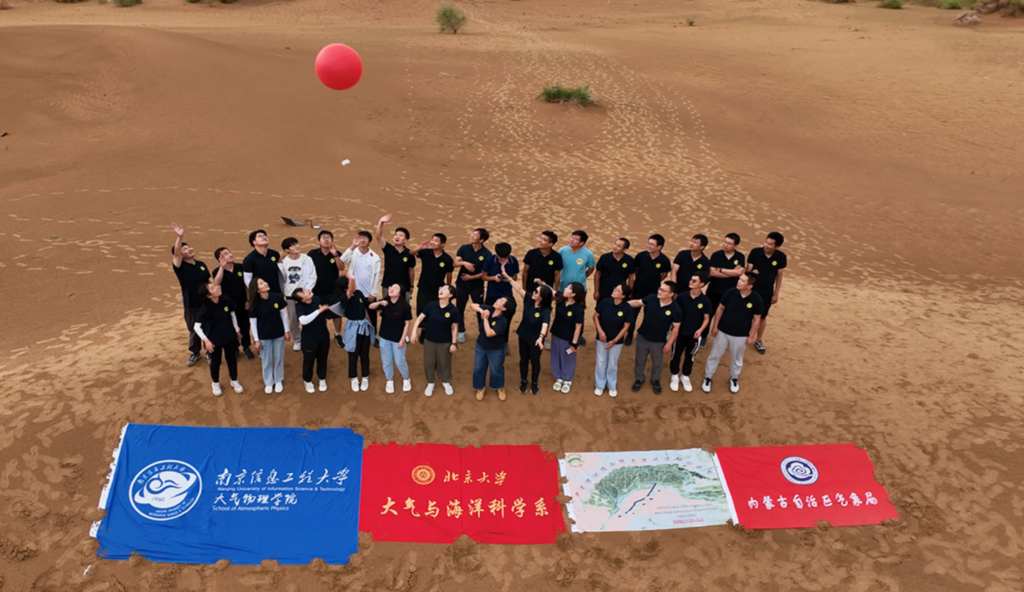
*DECODE participating organizations include Peking University, Inner Mongolia Meteorological Bureau, Nanjing University of Information Science and Technology, Xiamen Key Laboratory of Straits Meteorology, Xiamen University, Nanjing University, National Satellite Meteorological Center, Foshan Meteorological Bureau, and Jiangxi Storm Hunting Videos Culture Co., Ltd.
Featured image collage: Images from the DECODE project. Clockwise from top left: Microwave radiometer, wind LIDAR, researcher launching rawinsonde, eddy flux observation system, clouds forming at the boundary line, radar image of convective cells initiating along the boundary, photo of supercell storm growing from the boundary line. Photos courtesy of DECODE team.
About 32WAF/20Meso/28NWP
Predicting and understanding storms and other weather events is a complex business with real-world impacts. The American Meteorological Society’s 32nd Conference on Weather Analysis and Forecasting/28th Conference on Numerical Weather Prediction/20th Conference on Mesoscale Processes brought researchers, forecasters, emergency managers, and more together to learn about and discuss the latest scientific developments. The conferences took place in Madison, WI, and online 17–21 July, 2023. Recordings of the sessions are available here.
 “The scale recognizes that weak ARs are often mostly beneficial because they can enhance water supply and snow pack, while stronger ARs can become mostly hazardous, for example if they strike an area with conditions that enhance vulnerability, such as [where there are] burn scars, or already wet conditions,” says Marty Ralph and co-authors in a paper appearing in the February 2019 issue of BAMS and