Recent Trends in Tropical Cyclone Fatalities in the United States

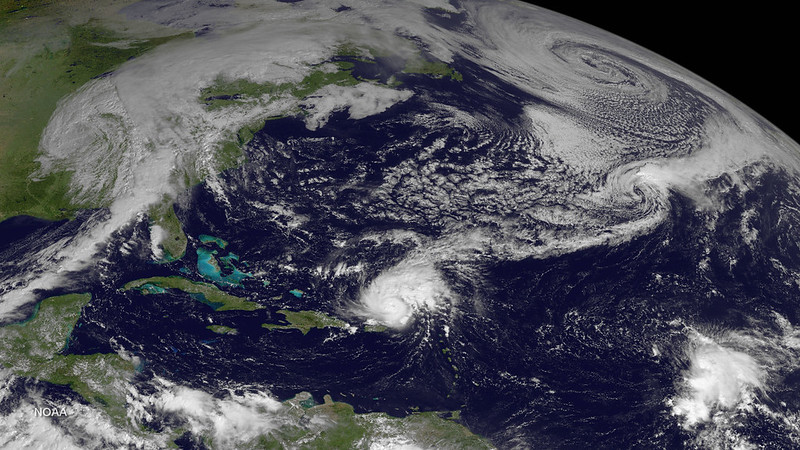
Satellite photo of Hurricane Gonzalo (a ball of swirling clouds) over the Atlantic near Puerto Rico; other larger cloud systems are seen in the upper part of the photo, eclipsed by the curvature of the Earth in the top right. Photo taken by GOES East satellite at 1445Z on October 14, 2014. Photo credit: NOAA.

New data from the past ten years reveal increased prominence of freshwater floods and indirect fatalities in hurricane deaths

Guest post by Dr. Michael Brennan, Director, National Hurricane Center; Daniel Brown, Warning Coordination Meteorologist, National Hurricane Center; and Leah Pope, Hydrologist, Northwest River Forecast Center

The National Hurricane Center’s mission to “save lives and mitigate property loss” is not just achieved by issuing effective watches, warnings, and forecasts of tropical cyclones. We also spend a large portion of the “offseason” educating the public, emergency managers, and our media partners about the risks that tropical cyclones (TCs), including hurricanes, pose to life and property in the United States. Those include natural hazards such as storm surge, wind, and rip currents, and also includes dangerous conditions in the aftermath of a landfalling tropical cyclone, which may lead to “indirect” fatalities. These are deaths which are not directly due to the forces of the storm, but which would not otherwise have occurred. NHC routinely compiles and assesses TC-related information through vehicles such as our Tropical Cyclone Reports (TCRs). Data from the most recent decade reveal that fatality trends may be changing.  

Note:  The fatality data presented here do not include any fatalities from Hurricane Maria in Puerto Rico, since there was no specific, definitive cause provided for those deaths.

Direct Fatalities

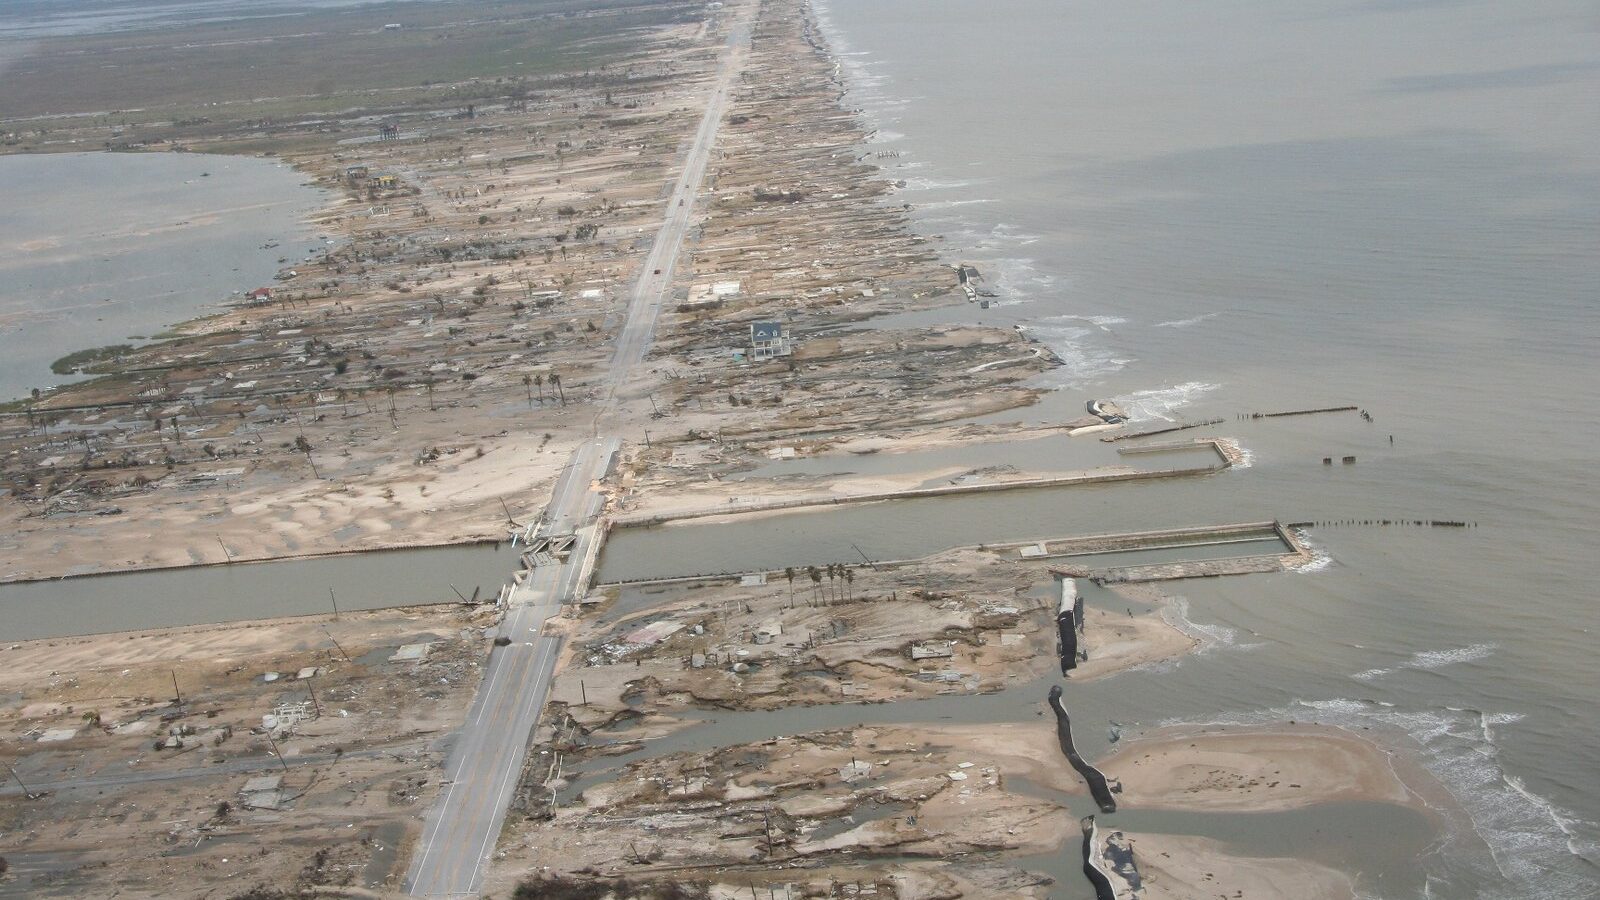
Aerial photo of a peninsula/barrier island that has been breached by a storm surge. Sand, buildings, and other structures have been washed away or damaged, including visible broken lines of sandbags, a damaged bridge, damaged trees, and obliterated buildings; only one house appears to still be standing.
Storm surge damage from Hurricane Ike, Bolivar Peninsula, Texas, 2008. Photo credit: NOAA.

Previous studies by Rappaport (2014) and Rappaport and Blanchard (2016) summarized direct and indirect fatality data from Atlantic basin tropical cyclones in the United States for the 50-year period 1963–2012. During that period, nearly 9 out of 10 tropical cyclone-related direct deaths in the United States were due to water. Storm surge was responsible for nearly half (49%) of the direct deaths, and over one-quarter (27%) were due to rainfall-induced freshwater flooding.  

In response, the National Weather Service (NWS) and NHC worked to improve outreach, education, and communication of storm surge and rainfall hazards. We introduced new real-time storm surge maps in 2014, and in 2017 introduced a storm surge watch/warning that highlights the risk of life-threatening storm surge inundation. 

New Data Suggest Changing Trends

Since 2012, the United States has experienced 21 hurricane landfalls, including 8 major hurricanes, and more than 20 tropical storm landfalls. Eighteen of these hurricane landfalls, including all of the major hurricanes, occurred during 2017–22 after a relatively quiet period. Given the significant number of tropical cyclone landfalls in recent years, and increased deployment of warnings around the storm surge hazard, NHC examined and compared fatality data from the most recent 10-year period (2013–22) to the earlier studies.

Hazard % of direct fatalities from this cause
(1963–2012)
% of direct fatalities from this cause
(2013–2022)
Storm Surge49%11%
Freshwater Flooding27%57%
Wind8%12%
Surf/Rip Currents6%15%
Offshore Marine Incidents6%3%
Tornadoes3%2%
Other1%1%
Note: Due to rounding, numbers may not add up to 100%.

During the most recent 10-year period in the United States, about 57% of direct tropical cyclone deaths were due to drowning from freshwater (rainfall) flooding. Surf and rip current fatalities have become an increasing threat, making up about 15% of direct fatalities in the past decade. These fatalities often occur one or two at a time from distant storms hundreds of miles offshore. Florida, North Carolina, and New Jersey experienced the highest number of TC-related surf and rip current fatalities. Storm surge and wind-related deaths account for 11% and 12% of the direct fatalities, respectively.  

Every hurricane is different, however. Hurricane Harvey in 2017 had the largest number of direct deaths—68, 65 of which were due to freshwater flooding in Texas—in the past decade. Hurricane Ian (2022) was the second deadliest with 66 direct fatalities, 41 of which were due to storm surge in Florida. More than 65% of those who died from direct causes were men, with about 60% of the victims over the age of 60.

Indirect Causes

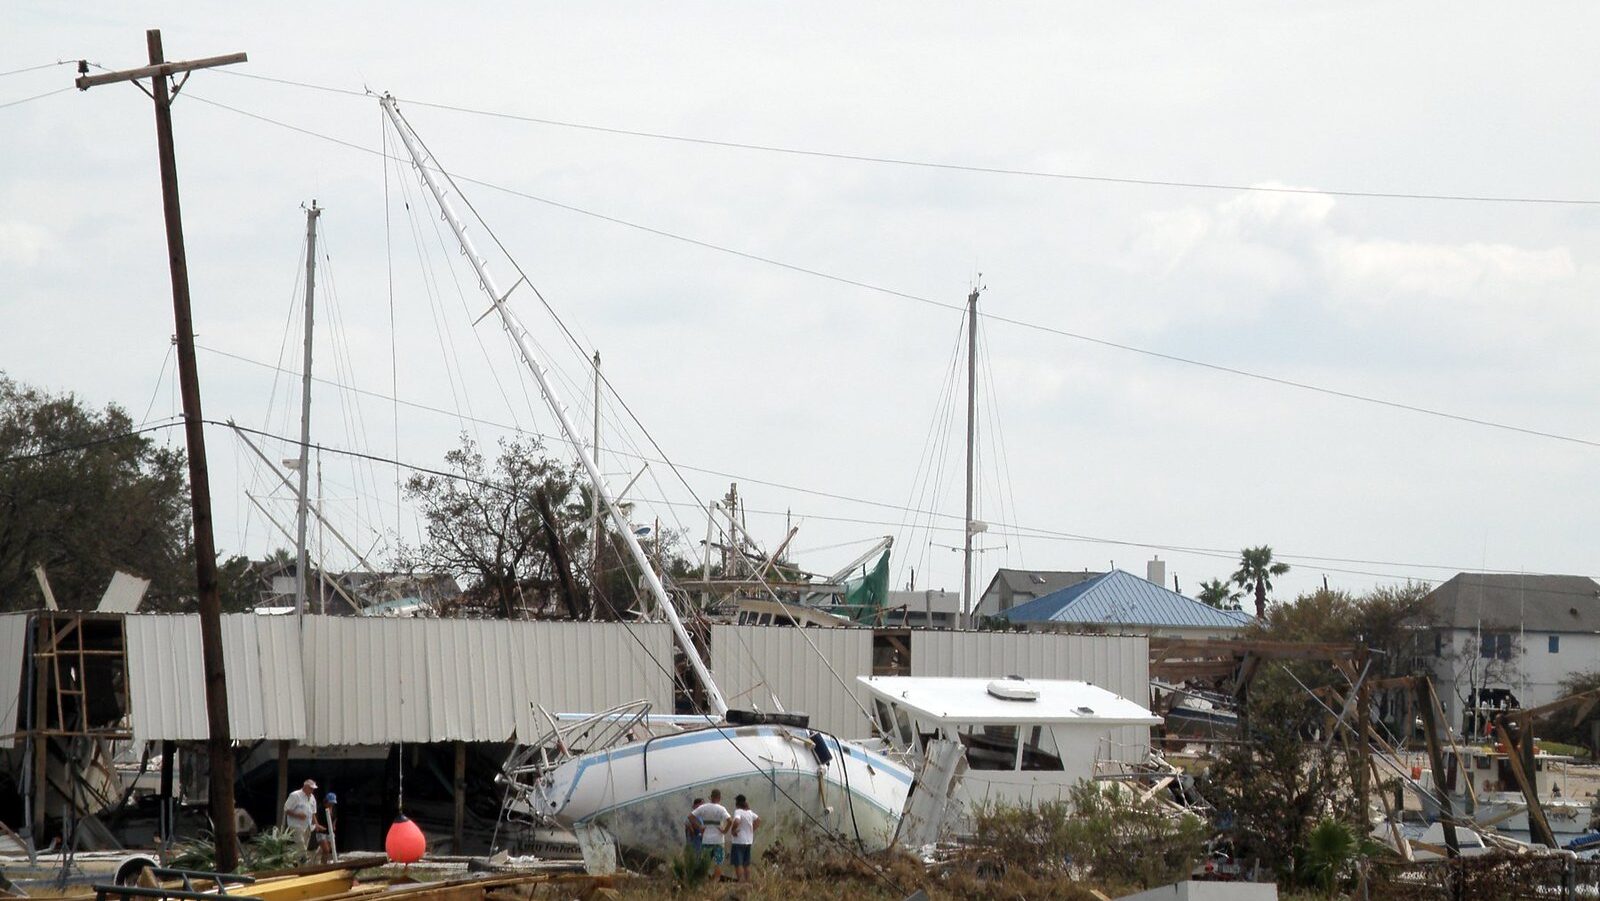
Image of a boat stranded on land, leaning against a wind-destroyed structure and a power line, amid other debris, including destroyed buildings and cars. Three people stand next to the boat observing the damage.
Aftermath of Hurricane Ike in Galveston, Texas, 2008. Photo credit: NOAA.

The recent study revealed that over the past 10 years there has been nearly an equal number of indirect deaths as direct fatalities. Indirect fatalities are due to a wide range of causes, including traffic accidents (16%), preparation/cleanup accidents (15%), carbon monoxide poisoning (12%), lack of medical care (11%), power problem/electrocution (11%), post-storm heat deaths (9%), unknown causes (9%), cardiac-related deaths (7%), and evacuation-related deaths (5%). 

The largest number of indirect deaths in the past decade occurred in association with Hurricanes Ian (90), Irma (82), Michael (43), Harvey (35), and Laura (34). Most (75%) of the indirect deaths are associated with major hurricane landfalls, which leave communities very vulnerable and often with long-duration, widespread power outages. More than half (57%) of the victims were over the age of 60. Younger victims tended to die in vehicle accidents; for older victims, medical-related issues, heat, evacuation, and other accidents were more likely causes of death.

Improving Warnings and Public Understanding

The results of these most recent studies have led the NWS and NHC to increase messaging on the hazards and causes of both direct and indirect fatalities. We continue to highlight rainfall flooding and storm surge risk through the Weather Prediction Center’s Excessive Rainfall Outlook, Flood Warnings from local NWS offices, and increased emphasis on the Storm Surge Warning. These warnings are the loudest “bells” that the NWS can ring during life-threatening flooding. We encourage our media and emergency management partners to work with us to encourage timely public response and personal preparedness ahead of these threats. 

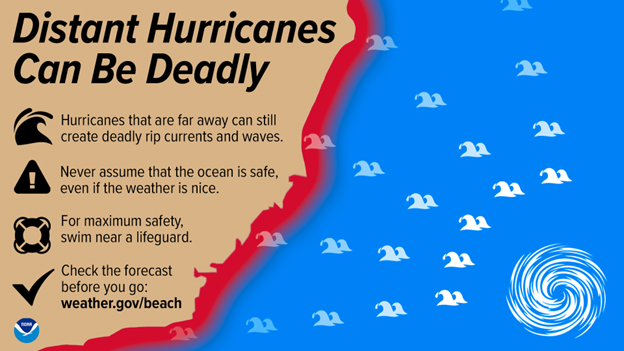
Additionally, with the increased percentage of rip current fatalities associated with high surf and swells from distant hurricanes, the NWS has created new infographics to explain this deadly beach hazard, and is working on graphics to better highlight the threat in real time.

During the highly impactful 2020 hurricane season in the United States, there were more fatalities associated with carbon monoxide poisoning from the improper use of generators than there were from storm surge. After that season, NHC and the NWS developed infographics and worked with media and emergency management partners to highlight that threat. While it is difficult to determine the effectiveness of that messaging, it is encouraging to know that there were no carbon monoxide related-fatalities in the aftermath of Hurricane Ian in 2022 in Florida, despite its devastating impacts and widespread power outages in that state.   

NHC relies on relationships with media, emergency management partners, and the entire weather enterprise to help reach the public before, during, and after tropical cyclone threats. These efforts undoubtedly increase awareness, encourage preparation, and save lives. We hope to continue to improve our messaging and understanding of the threats and causes of injuries and fatalities to better meet our collective mission.  

Visit the National Hurricane Center online.

Header photo: Hurricane Gonzalo in the Atlantic. Photo taken by GOES East satellite at 1445Z on October 14, 2014. Photo credit: NOAA.

This post was invited based on a presentation given by Dr. Brennan at the 50th Conference on Broadcast Meteorology, which took place in Phoenix, Arizona, June 21–23, 2023. The conference was organized by the American Meteorological Society Board on Broadcast Meteorology and chaired by Danielle Breezy and Vanessa Alonso.

Kids in Hot Cars: Tragic Misconceptions

Two tragedies last week were reminders of a continuing and underrated weather hazard: people continue to leave children in their parked automobiles, where the heat is ever escalating. The victims in the separate incidents in Oregon and California on June 20 and 21 were both under two years of age.
An average of 37 children each year die from hyperthermia while left alone in automobiles, largely due to persisting misconceptions about the heat dangers of the interior of a car.
For many years now, Jan Null, an AMS Certified Consulting Meteorologist in northern California, has been fighting these misconceptions about the heat danger of leaving children in cars. In addition to his studies, presented at AMS conferences  (e.g., watch one here), Null operates a web site of statistics on child hyperthermia in cars.
Perhaps the first big misconception Null refuted is that conditions outside need to be blisteringly hot. Ordinary warm days are dangerous, too. The outdoor temperatures in last week’s deaths were 80°F and 81°F.
This point has been thoroughly documented in studies by Null as well as others, and was reviewed and refined in a paper in the Bulletin of the American Meteorological Society, by Andrew Grundstein, John Down, and Vernon Meentemeyer.
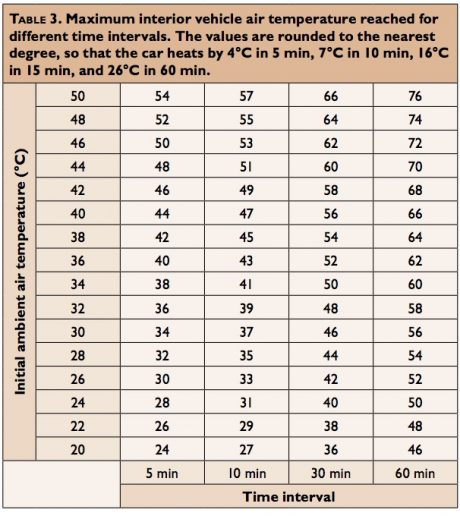
These studies show that temperatures climb surprisingly fast in the car’s interior. Here’s a table from Grundstein et al.:
Grundstein
It’s also a misconception to think that adults are a good judge of what conditions are tolerable. Null reminds people that children are physically much more responsive to conditions—they heat up two or three times faster than adults.
Because leaving children unattended in cars is illegal in some states, one might think these deaths are a case of bad parents making bad decisions. Yet less than one in five of these hyperthermia deaths is because a parent intentionally left the child in the car to, say, run errands. Null’s statistics show that about 400 (54%) of the 760+ heat stroke deaths since 1998 occur when caregivers forget a child is in the car. Almost 30% of the deaths occur when children climb unattended into the cars by themselves and get locked in.
But perhaps the most insidious misconception is that unfit—or forgetful or distracted or hurried or overworked—parents are the most susceptible to being forgetful about such an important matter.
In an AMS presentation, the University of Georgia’s Castle Williams revealed the perceptions that lead to such mental mistakes. Many parents and caregivers don’t believe that they are capable of leaving a child in a car by mistake. As a result, these parents considered it very unlikely that their child might suffer hyperthermia in a car, even as they recognized that the consequences would be severe. They believed that certain demographics–poor, single, working parents–would be more prone to such mistakes. This mismatch in perception of risk and awareness of consequences creates a communication challenge.
“All parents are at risk for this issue. It can happen to anyone,” Williams noted. (The results from his interviews with parents were later published in the the journal, Injury Prevention). “None of the demographic variables show any kind of relationship of having an increased risk of this occurring.”
How to combat the deadly misconceptions about kids in hot cars? According to Williams, “New messaging should focus on increasing perceived susceptibility to emphasize that every parent and caregiver is equally susceptible to forgetting their child in a hot car.”
Organizations such as Safe Kids Worldwide have begun stepping up efforts to inform people of the risks. And Williams’s study shows parents are paying attention to news reports of incidents on TV and in social media. Perhaps the misconceptions can be dispelled soon.
 

TRMM Keeps on Truckin'

It’s been 15 years since the Tropical Rainfall Measuring Mission (TRMM) satellite was launched. Over that time, TRMM has significantly advanced our understanding of precipitation through measurements of the global distribution of rainfall at Earth’s surface, the global distribution of vertical profiles of precipitation, and other rainfall properties. As a result, TRMM provides clues to the workings of the water cycle and the relationship between oceans, the atmosphere, and land. But the benefits of TRMM extend beyond the research community. The image below exhibits the kind of operational data TRMM can supply: it’s a rainfall analysis of SuperStorm Sandy that reveals the heaviest rainfall totals during the storm (more than 10.2 inches) were over the open waters of the Atlantic Ocean.

TRMM rainfall analysis for SuperStorm Sandy, with the storm's track over the Atlantic Ocean overlaid in white. NASA image.

Despite its advanced age, TRMM continues to provide unique data; its enduring value is evidenced by the fact that more than 50 presentations at the AMS Annual Meeting in Austin are related in some way to TRMM and its data. A few examples: Yingchun Chen of the University of Melbourne will examine TRMM’s estimates of daily rainfall in tropical cyclones using the Comprehensive Pacific Rainfall Database (PACRAIN) of 24-hour rain gauge observations (Wednesday, 9:30 a.m., Room 10b). A poster presentation by Dana Ostrenga of ADNET Systems and NASA’s Goddard Space Flight Center will review the recently released Version 7 TRMM Multi-satellite Precipitation Analysis (TMPA) products and data services (Monday, Exhibit Hall 3). Zhong Liu of George Mason University will present a poster on the TRMM Composite Climatology, a merger of selected TRMM rainfall products over both land and ocean that provides a “TRMM-best” climatological estimate (Monday, Exhibit Hall 3). In her poster, Hannah Huelsing of the National Weather Center will show how TRMM 3-hourly data were used to look at the spatial and temporal distribution of the Asian premonsoon and monsoon seasons in Pakistan during 2010’s severe flood year (Tuesday, Exhibit Hall 3).
As TRMM matures, it’s also broadening its horizons and crossing disciplines. Earth-observing systems are increasingly being utilized in the field of public health, and in Austin, the Fourth Conference on Environment and Health will include a themed joint session on this budding partnership. In that session, Benjamin Zaitchik of Johns Hopkins University will discuss the modeling of malaria risk in Peru (Monday, 5 p.m., Room 6b). Zaitchik and his colleagues modeled the influence of land cover and hydrometeorological conditions on the distribution of malaria vectors, as well as the relationship among climate, land use, and confirmed malaria case counts at regional health posts. In the study, meteorological and hydrological conditions were simulated with the use of observations from TRMM and other satellites.
 

Weather and Climate Services Protecting Public Health: Get Your Questions Answered

by Viviane Silva, Co-Chair, Third Conference on Environment and Health
To address the needs related to reducing climate-weather-water related public health risks, we’ve organized a panel session entitled “Integration of Climate-Weather-Water and Health Information: Strengthening Partnerships and Enhancing Services” during the Third Conference on Environment and Health at the AMS 2012 in New Orleans (Monday 23 January, 4 p.m., Room 333).  Taking part in the discussion will be a distinguished group of experts, including: Dr. Jack Hayes, director of the National Weather Service; Dr. Christopher Portier, director of the National Center for Environmental and Health for Toxic Substances and Disease Registry – CDC; Dr. John Balbus, senior advisor for Public Health, National Institute of Environmental Health Sciences – NIH; and Dr. John Haynes, NASA, Health  and Air Quality Applications Program Manager.  This is your chance to participate as well.
The topics will include research and data needs, opportunities for shared efforts, and emerging services to support decision makers in the health community. The presenters plan to focus on

  • the changing landscape of society’s need for integrated information to enhance decision making and each agency contribution to this regarding climate, weather, and water information to predict, prevent, or manage public health risks;
  • how CDC, NIH, NOAA, and NASA will work collaboratively with other agencies to  address national, state, local, and tribal needs;
  • how these agencies will support open exchange of data and delivery of information and decision tools; and
  • current efforts to facilitate research and development of services.

The presentations are designed to foster a conversation with the audience. Some of the questions the presenters plan to ask are: What integrated weather/water/climate/health information do you need? What challenges do you face when trying to access data that you need? What would you envision being included in a related Decision Support System or Health Early Warning System? Considering the current fiscal environment, what integrated information would you consider to be the highest priority?
We’re looking for more questions from you.  Post your questions as comments to this entry on The Front Page and we’ll make sure
they will be answered during the panel discussion.