Key Takeaways from the “State of the Climate in 2023”

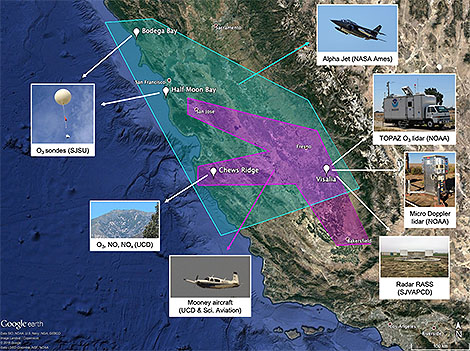
Glacial retreat at ice worm glacier

Earth hit record highs in global temps, greenhouse gases, sea level, and more last year.

By AMS Staff

Last year, global high temperatures, warm oceans, and massive wildfires broke records and sparked increasing concern about climate change. Now the annual State of the Climate report, produced by the National Oceanic and Atmospheric Administration’s National Centers for Environmental Information (NCEI) and peer reviewed and published by the American Meteorological Society, gives us an in-depth global picture of 2023, a year of extremes. 

According to the NOAA/AMS press release, the State of the Climate report this year includes contributions from more than 590 scientists from 59 countries, and “provides the most comprehensive update on Earth’s climate indicators, notable weather events, and other data collected by environmental monitoring stations and instruments located on land, water, ice and in space.”

Below are a few highlights from 2023.

Record-high greenhouse gases (again)

Global atmospheric carbon dioxide, methane, and nitrous oxide all reached higher concentrations than ever recorded. CO2 was 419.3±0.1ppm, 2.8 ppm higher than in 2023 and 50% higher than pre-industrial levels. This is the fourth-largest recorded year-to-year rise in CO2.

Record-high global temperatures

2023 officially beat 2016’s record as the hottest year overall since records began in the 1800s, partly due to the transition from La Niña to a strong El Niño. Globally, 2023 was 0.99°–1.08°F (0.13°–0.17°C) above the 1991–2020 average. The years 2015–2023 have been the hottest nine years on record.
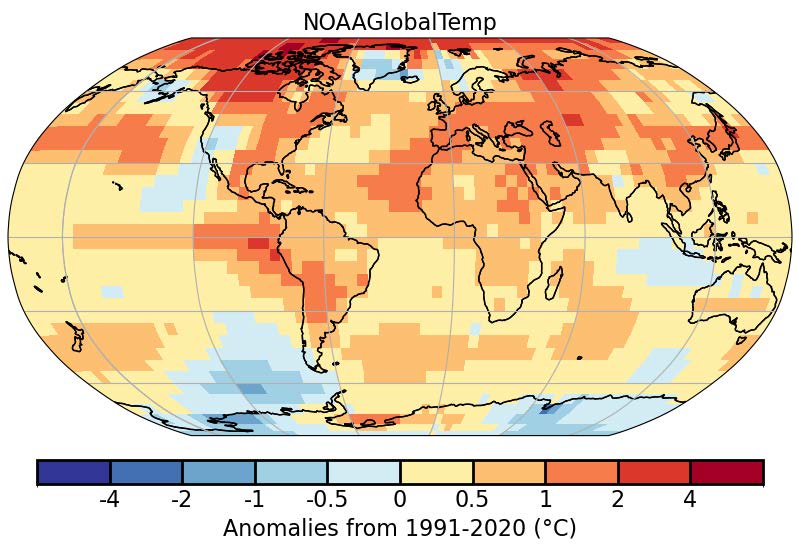
Global Surface Temperatures Were Above Average Across Most of the World (Plate 2.1a in State of the Climate in 2023): During 2023, much-warmer-than-average conditions were observed across most of the world’s surface, with the largest positive temperature anomalies across parts of the higher northern latitudes, shown here as areas shaded from orange to red. Limited areas experienced near-average to cooler-than-average conditions (blue shading). [Note: graphic shows 2023 average temperature anomalies above or below the 1991-2020 average global temperature.]

North America overall experienced its warmest year since records began in 1910, including a heat wave in Mexico that killed 286 people. The Caribbean also experienced its warmest recorded year, and Europe its warmest or second-warmest depending on the analysis.

In Kyoto, Japan, the cherry trees reached peak bloom on March 25, the earliest bloom in the city’s 1,200-year record. Photo: Balazs Simon on Pexels.

Record-high ocean heat

El Niño also contributed to the hottest oceans ever recorded. Mean annual global sea-surface temperature was 0.23°F (0.13°C) higher than 2016’s previous record, and August 22, 2023 saw an all-time high daily mean global sea-surface temperature of 66.18°F (18.99°C). Marine heat waves were recorded on 116 days of 2023 (vs. the previous record of 86 days in 2016) and global ocean heat content down to 2,000 feet also reached record highs.

Record-high sea levels (again)

Global mean sea level rose 8.1±1.5 mm in 2023, to reach a record 101.4 millimeters above the average from 1993, when satellite measurements began.

Massive wildfires caused by heat and drought

37 million acres of Canada burned in 2023, twice the previous record, causing evacuations for more than 232,000 people and with smoke affecting cities as far away as western Europe. Australia experienced its driest August–October since 1900, leading to millions of acres burned in bushfires in the Northern Territory. The European Union experienced its largest wildfire since 2000 (in the Alexandroupolis Municipality of Greece). Notable wildfires also occurred in Brazil, Paraguay, and in the U.S. state of Hawaii.

Warm poles and a greener Arctic

2023 was the fourth warmest year in the Arctic in the 124-year record, and the warmest recorded June–September. Sea ice reached its fifth-lowest extent in the 45-year record (with many monthly and daily records set), and multi-year ice declined. Despite above-average spring snowpack in the North American and Eurasian Arctic, rapid melting led to record and near-record lows in snow-water equivalent by June. The Northern Sea Route and Northwest Passage both opened, and the Northwest Passage saw a record 42 ship transits. Arctic tundra vegetation reached its third-greenest peak in the 24-year record. 

Much of Antarctica also experienced well-above-average heat. In addition, eight months, and 278 days, saw record lows in sea ice extent and area in Antarctica; daily sea ice extent on 21 February was the lowest ever recorded.
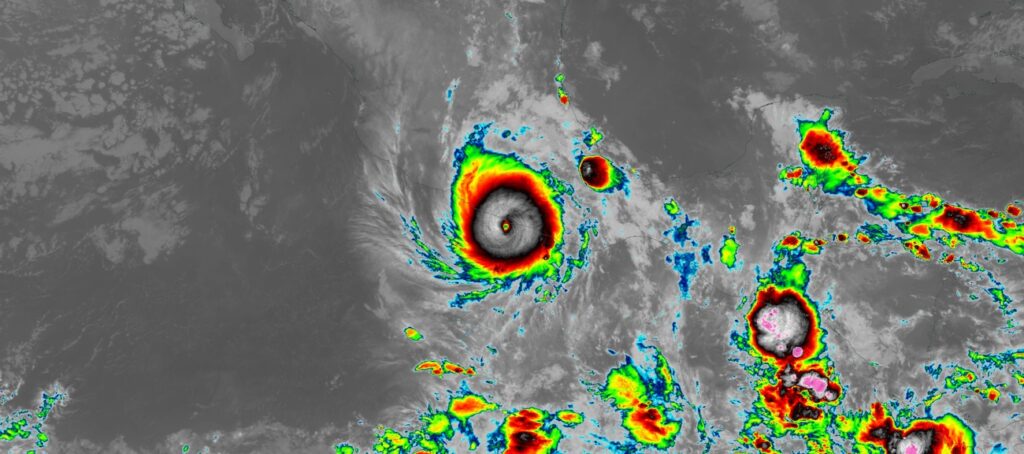
Clean infrared image of Hurricane Otis making landfall near Acapulco, Mexico. Image captured on 25 October, 2023, at 5:20 UTC, by the ABI instrument aboard the GOES-East satellite. Source: NASA Worldview.

Below-average tropical cyclone activity, yet notable storms

There were 82 named tropical storms in 2023, below average. However, global accumulated cyclone energy was above average, rebounding from 2022’s record low, and there were seven Category 5 cyclones. Tropical Cyclone Freddy became the longest lived tropical cyclone on record, lasting from February 6 to March 12; it made landfall three times and caused 165 fatalities in Mozambique and 679 fatalities in Malawi due to flooding and landslides. Typhoon Doksuri/Egay was the costliest economically, causing US$18.4 billion in damages; Beijing saw its heaviest recorded rainfall and 137 residents died in flooding. Rain and floods from Storm Daniel killed at least 4,300 people in Libya. Hurricane Otis underwent the most extreme rapid intensification on record—Category 1 to Category 5 in only nine hours—and became the strongest landfalling hurricane to hit western Mexico, devastating Acapulco.

Persistent ozone hole

The stratospheric ozone hole over Antarctica appeared earlier in the year and lasted longer than normal, and reached its 16th largest extent in 44 years.

The full State of the Climate report includes regional climate breakdowns and notable events in every part of the world. Read the full 2023 report here. Read a summary of key takeaways here.

Image at top: Ice Worm Glacier in the North Cascade mountains of Washington, United States, which was under continuous annual monitoring from 1984 onward and disappeared in 2023. Large photo: The location of former Ice Worm Glacier on 13 August 2023. Inset photo: Ice Worm Glacier on 16 August 1986. Photo credits Mauri Pelto.
Ozone Transport to the San Joaquin Valley

Uncontrollable sources of ozone from stratospheric intrusions, wildfires, and intercontinental transport are complicating efforts in California to further reduce this pollutant, which is particularly harmful to our health.

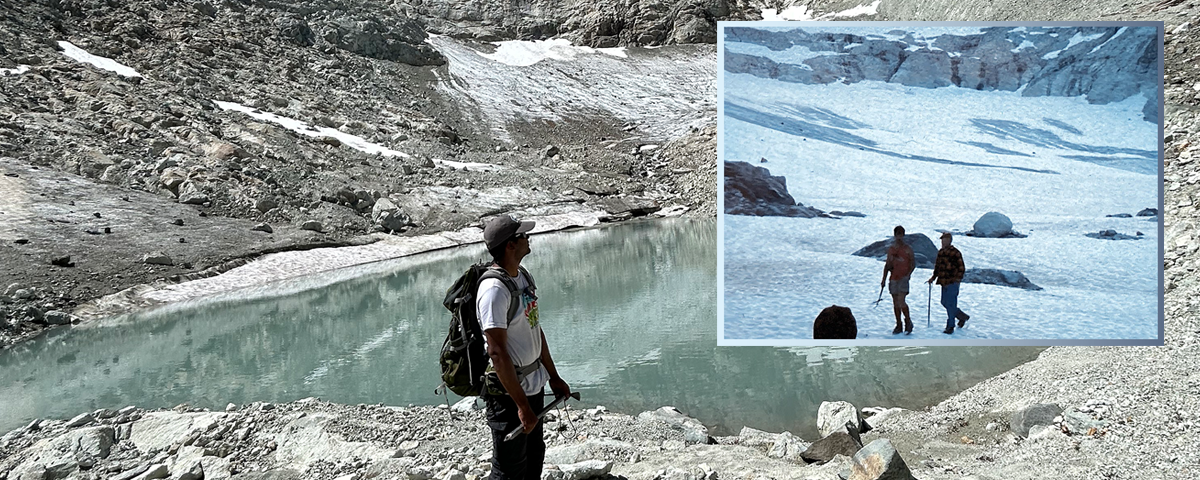
Scientists measured daily fluctuations in ozone in the air across Northern and Central California in 2016 during a coordinated field campaign known as the California Baseline Ozone Transport Study. They particularly focused on ozone crossing the shoreline and accumulating in low level air over the San Joaquin Valley.

Ian Faloona (University of California, Davis) and colleagues summarize the measurements and unique meteorological context for this novel dataset in a recent article published in the Bulletin of the American Meteorological Society. Faloona et al. draw attention to the dataset’s potential for future modeling studies of the impacts of long-range transport on regional air quality.

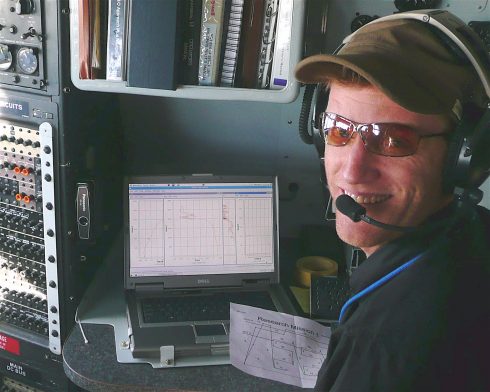
FaloonaIaninCockpit

Falloona, in his cockpit perch during aerial measurements for CABOTS.

We asked lead author Faloona to help us understand CABOTS and his motivations for this work.

BAMS: What would you like readers to learn from this article?

Faloona: I think this article presents a nice overview of the mesoscale flow over the complex terrain of Central and Northern California, and I would like readers to become more appreciative of the global nature of air pollution. The field of air quality was once considered in terms of emissions and receptors within “air basins” but as our knowledge of the global nature of greenhouse gases in terms of climate change has developed, I believe that we have similarly become more and more aware of the global aspects of many air pollutants in general.

The CABOTS study domain and measurement platforms ranged from daily ozonesondes launched at the two coastal sites (Bodega Bay and Half Moon Bay) to the NOAA TOPAZ lidar in Visalia. The green and purple polygons represent the approximate domains surveyed by the NASA Alpha jet and Scientific Aviation, Inc., Mooney air-craft, respectively.


How did you become interested in the topic of this article?

Some colleagues from the UC Davis Air Quality Research Center and I became interested in long-range transport of air pollution to California and how it might be best sampled along the coastal mountains where local emissions might be minimal and the surface was well above the strong temperature inversion of the marine boundary layer. We eventually found the site on Chews Ridge where a group of renegade astronomers had been operating an off-the-grid observatory with the Monterey Institute for Research in Astronomy. They allowed us to build a climate monitoring site collocated with their observatory (the Oliver Observing Station) and then some airborne work for the San Joaquin Valley Air Pollution Control District allowed us to link the inflow at the coast to air quality issues within the leeward valley.

What got you initially interested in meteorology or in the related field you are in?

While an undergraduate studying physical chemistry I wrote a term paper on acid rain for a chemical oceanography class. I was floored by how few details were thoroughly understood about the chemical mechanisms of an environmental problem that at the time was considered quite serious. I figured I should throw whatever brainpower heft I could into this type of atmospheric oxidation chemistry.  But then, while working for a private consulting company in Colorado after college, many of my colleagues there were trained in meteorology and I knew there would be little progress without a fundamental understanding that field.  So I went to Penn State to do chemistry research but get trained in all aspects of meteorology.

What surprises/surprised you the most about the work you document in this article?

The first thing that surprised me about the data we collected for CABOTS was how deep the daytime up-valley flow was (~1.5 km), but how shallow the convective boundary layers tended to be (~0.5 km).  The scale interactions that need to be taken into account when analyzing boundary layers among the complex terrain of California make it a great place to study in meteorology. But the other major discovery that came out of this work was the evidence we found of significant NOx emissions from certain agricultural regions in the San Joaquin Valley. For instance, we found that the agricultural region between Fresno and Visalia was responsible for as much NOx emitted to the valley atmosphere as from all the mobile sources in the CARB inventory across the three county region.

What was the biggest challenge you encountered while doing this work?

The sensible heat at the Fresno airport.  Our airborne deployments attempted to target high ozone episodes, which are best forecast by their correlation with ambient temperatures. I like to tell my students that I am a chaser of extreme weather. It just so happens that the weather features most important to air quality are heat waves. Heat waves are extremely easy to catch, and can be brutal in their persistence.  Some days we observed temperatures in the plane on the tarmac of >115 ºF, which made it challenging to keep the equipment up and running. I remember dragging bags of ice in and out of the plane covered in sweat, and still having the instruments give up in heat exhaustion before one of our midday flights.

What’s next? How will you follow up?

I would like to continue studying the various scales at play in the transport of intercontinental pollution to North America, and my preferred tools are aircraft laboratories. I would like to follow up with a study of wintertime stagnation events that lead to particulate matter air quality problems – an entirely different meteorological beast.  But I would also like to follow up with a study of agricultural NOx emissions in the Imperial Valley of Southern California. This region is expected to have the largest soil emissions and the lowest urban sources to confound the measurements. It is also a region of important environmental justice issues being made up largely of migrant agricultural workers who have to bear the burden of the air quality problems engendered by agriculture.


A Scientist's Scientist

Joseph Farman–the man who found the ozone hole–had a very straightforward, unglamorous way of describing the work of  a scientist:

Science is thinking you know how things work and so you make something work and it either works as you think it does or it doesn’t work as you think it does and now you move on.

Farman, who passed away last month at the age of 82, reported the existence of the ozone hole in a 1985 paper based on in situ measurements made with Brian Gardiner and Joe Shanklin in Antarctica.  Despite the renown that followed this discovery, Farman’s legacy will stand–as he wished–on a dogged ability to follow his simple model of research at the highest level.
An employee of the British Antarctic Survey from 1956 until his retirement in 1990, Farman ventured to Antarctica at the beginning of his career and studied the atmosphere over that continent for 25 years, assigning other scientists to continue measurements after he returned to Britain in 1959. His superiors questioned his indefatigable efforts to compile ground-based ozone readings–after all, NASA satellites were already monitoring the ozone over Antarctica. Farman told the BBC:

The long-term monitoring of the environment is a very difficult subject. There are so many things you can monitor. And basically it’s quite expensive to do it. And, when nothing much was happening in the environmental field, all the politicians and funding agencies completely lost interest in it. And there was a huge struggle to keep going. And in fact we could have been closed down with our ozone measurements the year before we actually published our paper.

But Farman was a strict proponent of the simple scientific act of collecting data–“just doing a little job, and persevering at it,” as described by Sharon Roan, author of Ozone Crises: The 15-Year Evolution of a Sudden Global Emergency. This commitment to scientific principles made him “a model scientist,” according to Roan.
Faithful dedication to the scientific process yielded momentous results. Isn’t that how it’s supposed to work?
This New York Times obituary tells a more complete story of Farman’s achievements, and for those who really want to delve into his life and sometimes controversial views, there is this interview collected by the British Library (audio version available here).

The Return of the Ozone Layer

It’s always nice to hear good news: The ozone layer is recovering, and by around 2032 the amount of ozone in the atmosphere should return to 1980 levels, according to the 2010 Scientific Assessment of Ozone Depletion. At last fall’s symposium on Stratospheric Ozone and Climate Change, co-sponsored by AMS, Paul Newman gave a talk about this progress–and what the world would have looked like had the landmark Montreal Protocol not been implemented in 1987.  Here’s his message, in a nutshell, courtesy of a NASA video:

(You can see Newman’s in-depth presentation on the Assessment from the Bjerknes Lecture at the AGU Fall Meeting as well).
Comprehensive data are available in the links, but a couple of highlights from Newman’s talk are that 1) amounts of chlorine and bromine in the lower atmosphere are in decline, and 2) if the Montreal Protocol had not been implemented in 1987, two-thirds of the ozone layer would be have disappeared by 2065, while the UV index would have tripled. Not only would this have led to a marked increase in occurrences of skin cancer and other health problems, but it also would have caused crop yields across the world to decline by up to 30%, potentially leading to food shortages.
The technology used in ozone research will be the topic of a number of presentations at the upcoming AMS Annual Meeting in New Orleans. One device of particular interest is the Ozone Mapper Profiler Suite (OMPS), a state-of-the-art instrument onboard the recently launched NPOESS Preparatory Project (NPP) satellite.
Angela Li of NASA and colleagues will discuss the collection and evolution of OMPS data in a presentation titled “End-to-End Ozone Mapper Profiler Suite (OMPS) Mission Data Modeling and Simulation” (Tuesday, 1:45 p.m., Room 343/344).
Glen Jaross of Science Systems and Applications, Inc. will lead an examination of the calibration of instruments like OMPS in the discussion, “Evolution of Calibration Requirements and Techniques for Total Ozone Mappers” (Tuesday, 8:30 a.m., Room 257).
Lawrence Flynn of NOAA/NESDIS will lead a talk (Monday, 5:00 p.m., Room 245) on recent advances in ozone sensors, with a focus on those that make solar Backscatter measurements in the Ultraviolet–a list that includes not only OMPS but also the EuMetSat Global Ozone Monitoring Experiment (GOME-2), the Chinese Meteorological Administration (CMA) Solar Backscatter Ultraviolet Sounders (SBUS) and Total Ozone Units (TOU), and the NOAA Solar Backscatter Ultraviolet instruments (SBUV/2).
Early results from OMPS and other instruments on NPP will be the subject of a panel discussion (Monday, 12:15 p.m., Room 343/344) of NPP science team members and designers.


Arctic Ozone Layer Looking Thinner

The WMO announced that observations taken from the ground, weather balloons, and satellites indicate that the stratospheric ozone layer over the Arctic declined by 40% from the beginning of the winter to late March, an unprecedented reduction in the region. Bryan Johnson of NOAA’s Earth System Research Laboratory called the phenomenon “sudden and unusual” and pointed out that it could bring health problems for those in far northern locations such as Iceland and northern Scandinavia and Russia. The WMO noted that the thinning ozone was shifting locations as of late March from over the North Pole to Greenland and Scandinavia, suggesting that ultraviolet radiation levels in those areas will be higher than normal, and the Finnish Meteorological Institute followed with their own announcement that ozone levels over Finland had recently declined by at least 30%.
Previously, the greatest seasonal loss of ozone in the Arctic region was around 30%. Unlike the ozone layer over Antarctica, which thins out consistently each winter and spring, the Arctic’s ozone levels show greater fluctuation from year to year due to more variable weather conditions.