Key Takeaways from the “State of the Climate in 2023”

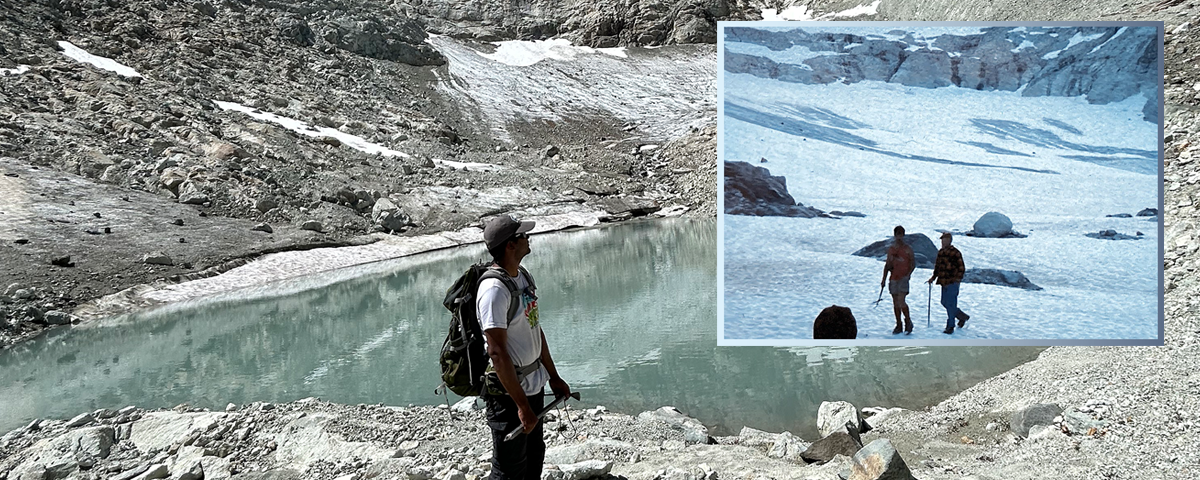
Glacial retreat at ice worm glacier

Earth hit record highs in global temps, greenhouse gases, sea level, and more last year.

By AMS Staff

Last year, global high temperatures, warm oceans, and massive wildfires broke records and sparked increasing concern about climate change. Now the annual State of the Climate report, produced by the National Oceanic and Atmospheric Administration’s National Centers for Environmental Information (NCEI) and peer reviewed and published by the American Meteorological Society, gives us an in-depth global picture of 2023, a year of extremes. 

According to the NOAA/AMS press release, the State of the Climate report this year includes contributions from more than 590 scientists from 59 countries, and “provides the most comprehensive update on Earth’s climate indicators, notable weather events, and other data collected by environmental monitoring stations and instruments located on land, water, ice and in space.”

Below are a few highlights from 2023.

Record-high greenhouse gases (again)

Global atmospheric carbon dioxide, methane, and nitrous oxide all reached higher concentrations than ever recorded. CO2 was 419.3±0.1ppm, 2.8 ppm higher than in 2023 and 50% higher than pre-industrial levels. This is the fourth-largest recorded year-to-year rise in CO2.

Record-high global temperatures

2023 officially beat 2016’s record as the hottest year overall since records began in the 1800s, partly due to the transition from La Niña to a strong El Niño. Globally, 2023 was 0.99°–1.08°F (0.13°–0.17°C) above the 1991–2020 average. The years 2015–2023 have been the hottest nine years on record.

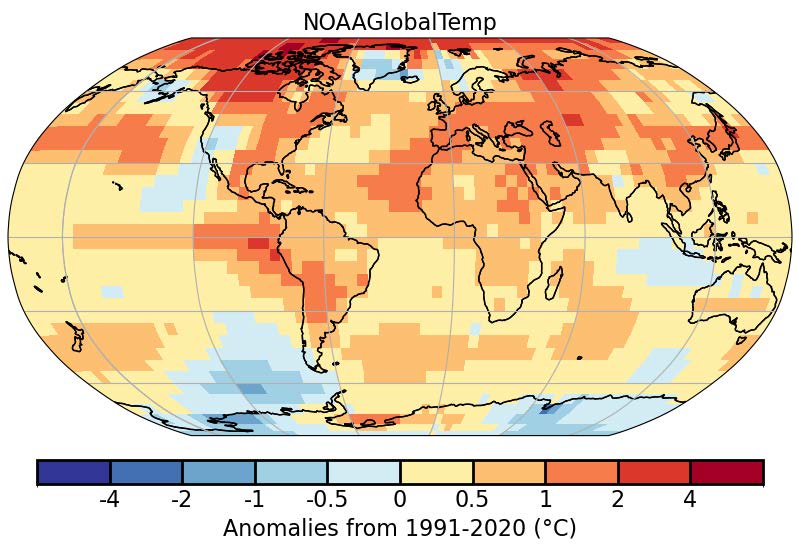
Global Surface Temperatures Were Above Average Across Most of the World (Plate 2.1a in State of the Climate in 2023): During 2023, much-warmer-than-average conditions were observed across most of the world’s surface, with the largest positive temperature anomalies across parts of the higher northern latitudes, shown here as areas shaded from orange to red. Limited areas experienced near-average to cooler-than-average conditions (blue shading). [Note: graphic shows 2023 average temperature anomalies above or below the 1991-2020 average global temperature.]

North America overall experienced its warmest year since records began in 1910, including a heat wave in Mexico that killed 286 people. The Caribbean also experienced its warmest recorded year, and Europe its warmest or second-warmest depending on the analysis.

In Kyoto, Japan, the cherry trees reached peak bloom on March 25, the earliest bloom in the city’s 1,200-year record. Photo: Balazs Simon on Pexels.

Record-high ocean heat

El Niño also contributed to the hottest oceans ever recorded. Mean annual global sea-surface temperature was 0.23°F (0.13°C) higher than 2016’s previous record, and August 22, 2023 saw an all-time high daily mean global sea-surface temperature of 66.18°F (18.99°C). Marine heat waves were recorded on 116 days of 2023 (vs. the previous record of 86 days in 2016) and global ocean heat content down to 2,000 feet also reached record highs.

Record-high sea levels (again)

Global mean sea level rose 8.1±1.5 mm in 2023, to reach a record 101.4 millimeters above the average from 1993, when satellite measurements began.

Massive wildfires caused by heat and drought

37 million acres of Canada burned in 2023, twice the previous record, causing evacuations for more than 232,000 people and with smoke affecting cities as far away as western Europe. Australia experienced its driest August–October since 1900, leading to millions of acres burned in bushfires in the Northern Territory. The European Union experienced its largest wildfire since 2000 (in the Alexandroupolis Municipality of Greece). Notable wildfires also occurred in Brazil, Paraguay, and in the U.S. state of Hawaii.

Warm poles and a greener Arctic

2023 was the fourth warmest year in the Arctic in the 124-year record, and the warmest recorded June–September. Sea ice reached its fifth-lowest extent in the 45-year record (with many monthly and daily records set), and multi-year ice declined. Despite above-average spring snowpack in the North American and Eurasian Arctic, rapid melting led to record and near-record lows in snow-water equivalent by June. The Northern Sea Route and Northwest Passage both opened, and the Northwest Passage saw a record 42 ship transits. Arctic tundra vegetation reached its third-greenest peak in the 24-year record. 

Much of Antarctica also experienced well-above-average heat. In addition, eight months, and 278 days, saw record lows in sea ice extent and area in Antarctica; daily sea ice extent on 21 February was the lowest ever recorded.

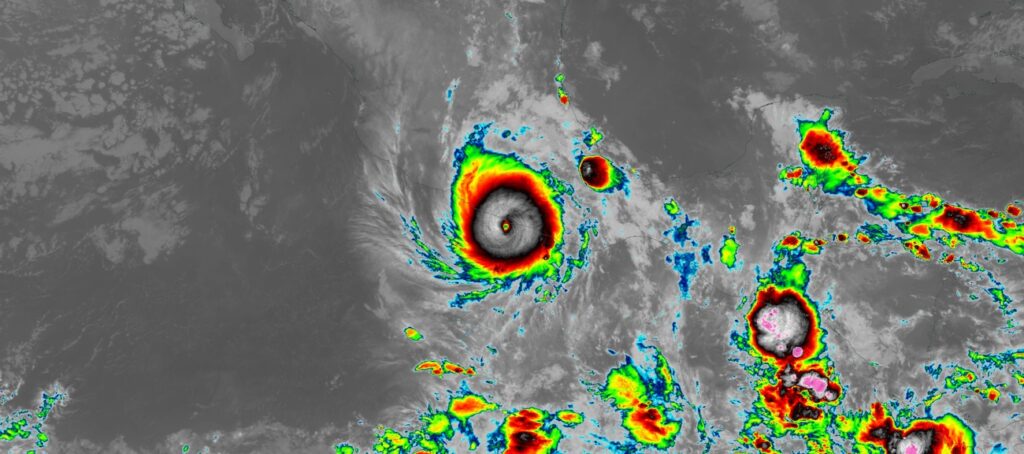
Clean infrared image of Hurricane Otis making landfall near Acapulco, Mexico. Image captured on 25 October, 2023, at 5:20 UTC, by the ABI instrument aboard the GOES-East satellite. Source: NASA Worldview.

Below-average tropical cyclone activity, yet notable storms

There were 82 named tropical storms in 2023, below average. However, global accumulated cyclone energy was above average, rebounding from 2022’s record low, and there were seven Category 5 cyclones. Tropical Cyclone Freddy became the longest lived tropical cyclone on record, lasting from February 6 to March 12; it made landfall three times and caused 165 fatalities in Mozambique and 679 fatalities in Malawi due to flooding and landslides. Typhoon Doksuri/Egay was the costliest economically, causing US$18.4 billion in damages; Beijing saw its heaviest recorded rainfall and 137 residents died in flooding. Rain and floods from Storm Daniel killed at least 4,300 people in Libya. Hurricane Otis underwent the most extreme rapid intensification on record—Category 1 to Category 5 in only nine hours—and became the strongest landfalling hurricane to hit western Mexico, devastating Acapulco.

Persistent ozone hole

The stratospheric ozone hole over Antarctica appeared earlier in the year and lasted longer than normal, and reached its 16th largest extent in 44 years.

The full State of the Climate report includes regional climate breakdowns and notable events in every part of the world. Read the full 2023 report here. Read a summary of key takeaways here.

Image at top: Ice Worm Glacier in the North Cascade mountains of Washington, United States, which was under continuous annual monitoring from 1984 onward and disappeared in 2023. Large photo: The location of former Ice Worm Glacier on 13 August 2023. Inset photo: Ice Worm Glacier on 16 August 1986. Photo credits Mauri Pelto.

A Few Takeaways from the “State of the Climate in 2022”

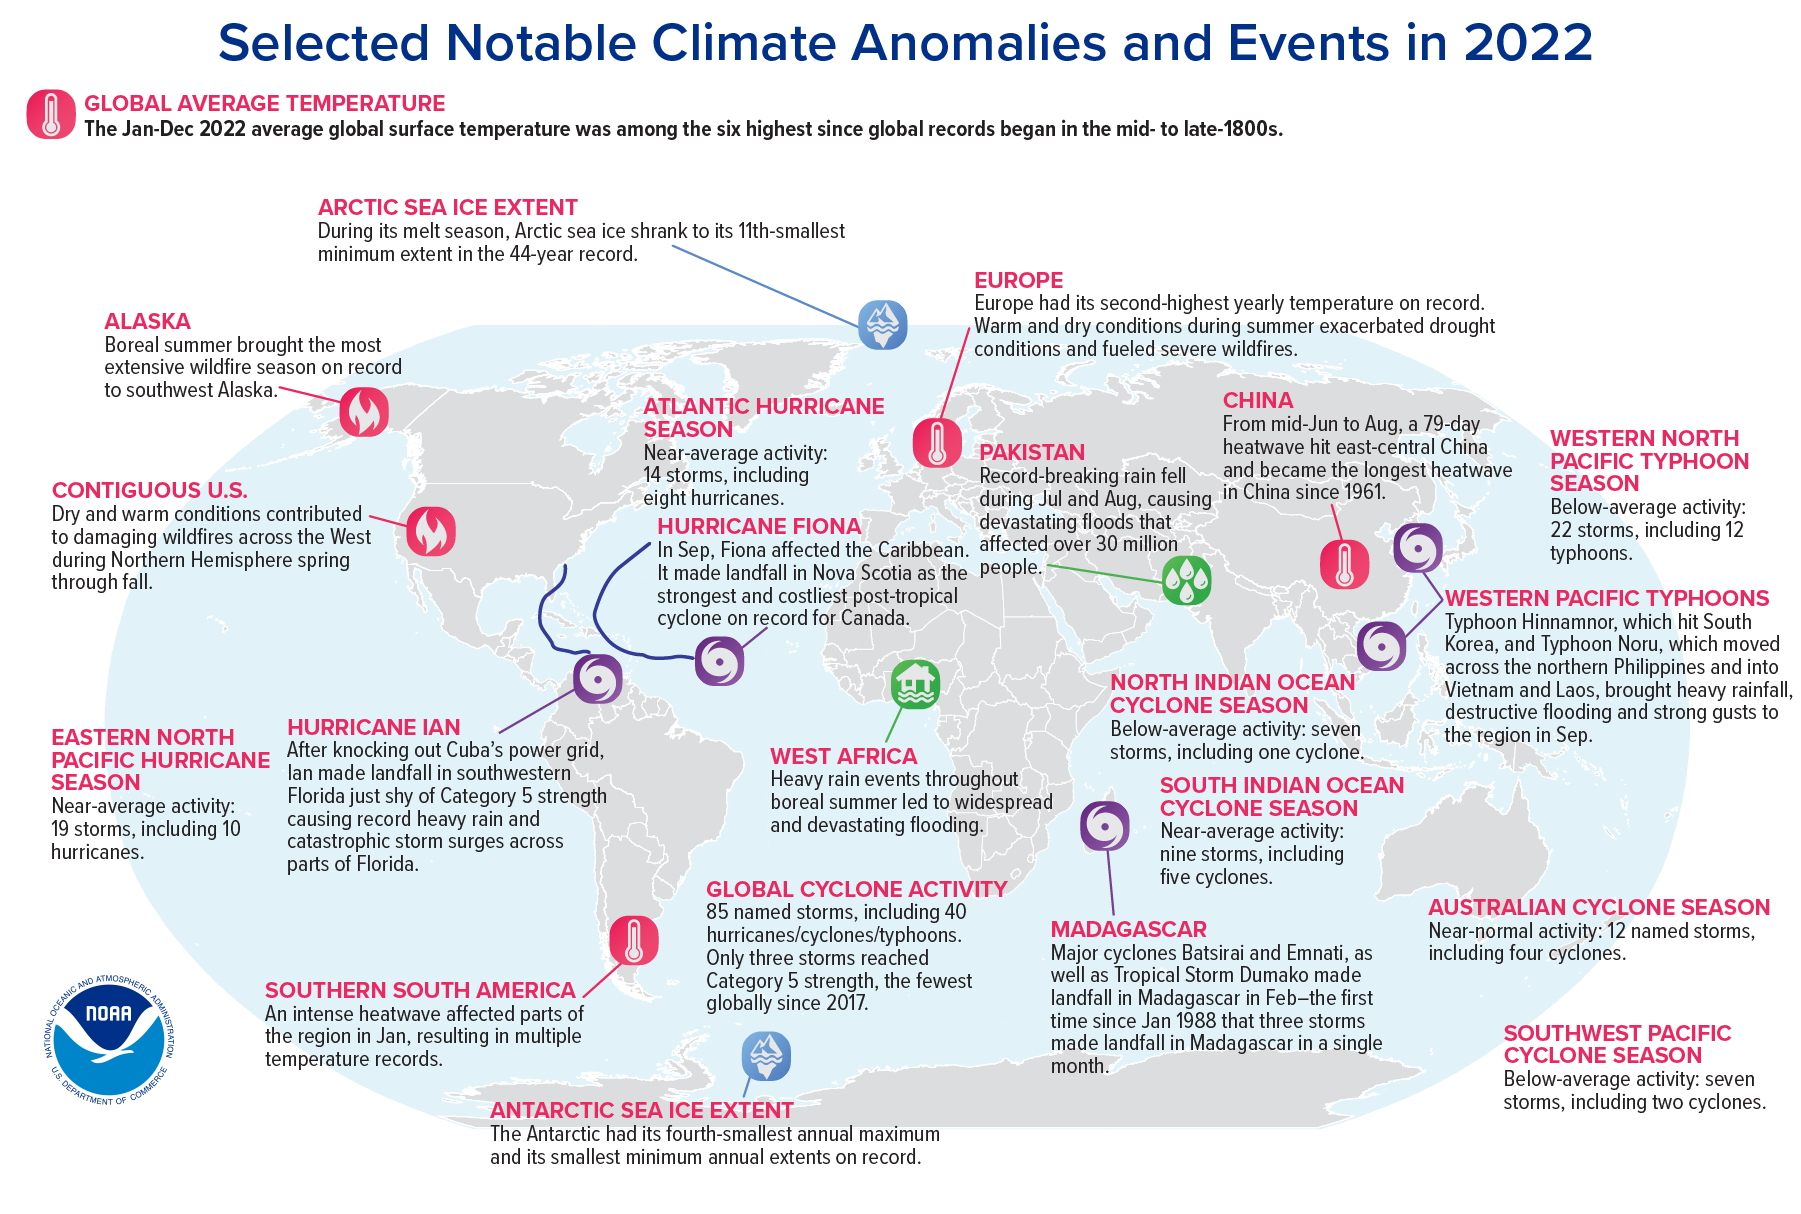
Map of significant global weather and climate anomalies and events of 2022.

Record-high greenhouse gases, sea levels, monsoons, and droughts—and a volcanic vapor injection

By Michael Alexander, Lead, Atmosphere Ocean Processes and Predictability (AOPP) Division, NOAA, and BAMS Special Editor for Climate

The annual NOAA/AMS State of the Climate report has just been released, with a comprehensive global look at the climate in 2022. Produced by the NOAA National Centers for Environmental Information (NCEI) and the American Meteorological Society, the State of the Climate Report maps out the complex, interconnected climate phenomena affecting all parts of the globe. It also charts global progress in observing and understanding our climate system. 570 scientists from 60 countries contributed to this year’s report, including a rigorous peer review, making it a truly global endeavor. 

As the senior editor on this project, I wanted to share with you a few highlights. Click here to read the full report, published as a supplement to the Bulletin of the American Meteorological Society.

New record-highs for atmospheric greenhouse gases CO2, methane, and nitrous oxide.

It was yet another record-setting year for atmospheric carbon dioxide and other greenhouse gases. 2022 saw an average concentration of 417.1 ± 0.1 ppm for atmospheric CO2; methane and nitrous oxide also reached record highs. 

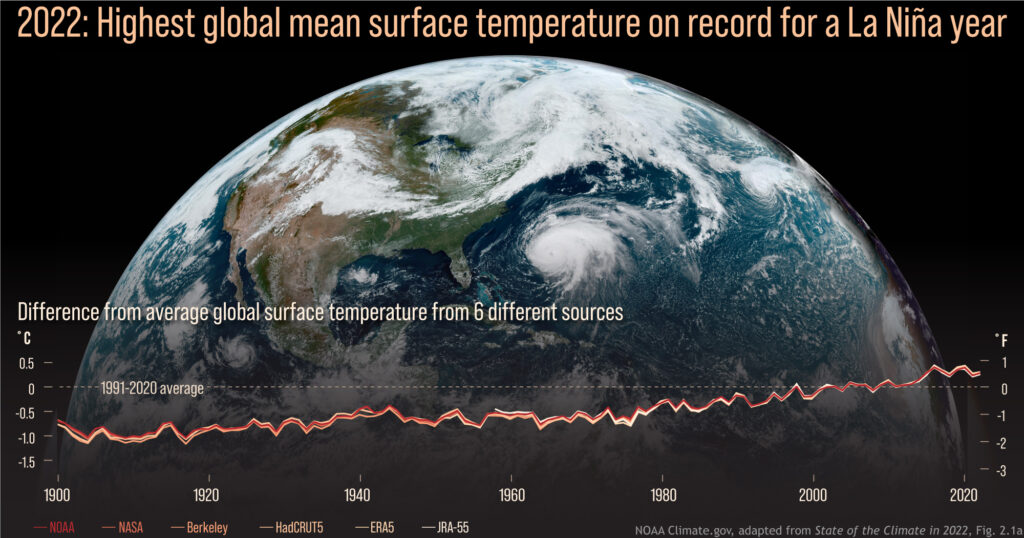
Graphs of yearly global surface temperature compared to the 1991-2020 average for each year from 1900 to 2022, from 6 data records, overlaid on a GOES-16 satellite image from September 22, 2022.  Image credit: NOAA Climate.gov.

Warmest La Niña year on record.

Despite being in the typically cooler La Niña phase of ENSO, 2022 was among the six warmest years on record, and was the warmest La Niña year ever recorded. Summer heat waves left annual temperatures at near-record highs in Europe, China, the Arctic, and Antarctica (parts of Europe set daily or seasonal heat records), and New Zealand experienced its warmest year ever. High-pressure “heat domes” helped elevate local temperatures in many areas, including parts of North America and Europe. 

Record-high global mean sea level and ocean heat.

Global mean sea level reached 101.2mm above 1993 levels, setting a new record for the 11th year in a row. 2022 also saw record-high global ocean heat content (as measured to 2000 meters below the surface), although La Niña moderated sea-surface temperatures.

Image credit: NOAA

Complex climate picture.

Global warming trends continued apace, but of course numerous large-scale climate patterns complicated the picture. In 2022 we saw the first “triple-dip” La Niña event (third consecutive La Niña year) of the 21st century. The Indian Ocean Dipole had one of its strongest negative events since 1982, which led to increased temperatures and precipitation in the eastern Indian Ocean. Along with La Niña, this contributed to record-breaking monsoon rains in Pakistan that caused massive flooding and one of the world’s costliest natural disasters. We also had a positive-phase winter and summer North Atlantic Oscillation affecting weather in parts of the Northern Hemisphere. 

A bad year for drought.

For the first time ever, in August 2022, 6.2% of the global land surface experienced extreme drought in the same month, and 29% of global land experienced at least moderate drought. Record-breaking droughts continued in equatorial East Africa and central Chile. Meanwhile, parts of Europe experienced one of their worst droughts in history, and China’s Yangtze River reached record-low levels.

Warmth and high precipitation at the poles.

2022 was the firth-warmest year recorded for the Arctic, and precipitation was at its third-highest level since 1950. The trend toward loss of multi-year sea ice continued. Meanwhile, Antarctic weather stations recorded their second-warmest year ever, including a heatwave event that collapsed the Conger Ice Shelf, and two new all-time record lows in sea-ice extent and area set in February. On the other hand, record snow/icefall due to atmospheric rivers led to the continent’s highest recorded snow/ice accumulation since 1993.

Image credit: NOAA

Notable storms: Ian and Fiona.

85 named tropical cyclones were observed across all ocean basins, an approximately average number. Although there were only three Category 5 storms, and the lowest recorded global accumulated cyclone energy, the year produced Hurricane Ian, the third-costliest disaster in U.S. history, as well as Hurricane Fiona, Atlantic Canada’s most destructive cyclone.

Massive volcanic injection of atmospheric water vapor.

The Hunga Tonga-Hunga Ha’apai submarine volcano in the South Pacific injected a water plume into the atmosphere of unprecedented magnitude (146+/-5 Terragrams, about 10% of the stratosphere’s total water) and height (reaching into the mesosphere). We don’t yet know what, if any, long-term effects this will have on the global climate, although the increase in water vapor has interfered with some earth system observations. 

The full report is a comprehensive and fascinating analysis of our climate system in the previous calendar year. I urge you to read it and communicate your own takeaways from the State of the Climate in 2022. You can read the press release here.

Infographic at top: World map showing locations of significant climate anomalies and events in 2022. Credit: NOAA.

Kids in Hot Cars: Tragic Misconceptions

Two tragedies last week were reminders of a continuing and underrated weather hazard: people continue to leave children in their parked automobiles, where the heat is ever escalating. The victims in the separate incidents in Oregon and California on June 20 and 21 were both under two years of age.
An average of 37 children each year die from hyperthermia while left alone in automobiles, largely due to persisting misconceptions about the heat dangers of the interior of a car.
For many years now, Jan Null, an AMS Certified Consulting Meteorologist in northern California, has been fighting these misconceptions about the heat danger of leaving children in cars. In addition to his studies, presented at AMS conferences  (e.g., watch one here), Null operates a web site of statistics on child hyperthermia in cars.
Perhaps the first big misconception Null refuted is that conditions outside need to be blisteringly hot. Ordinary warm days are dangerous, too. The outdoor temperatures in last week’s deaths were 80°F and 81°F.
This point has been thoroughly documented in studies by Null as well as others, and was reviewed and refined in a paper in the Bulletin of the American Meteorological Society, by Andrew Grundstein, John Down, and Vernon Meentemeyer.
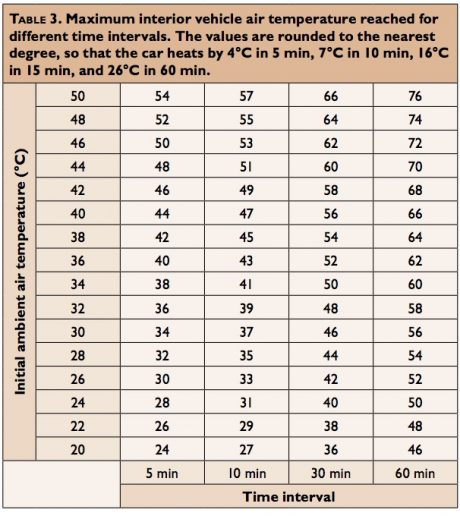
These studies show that temperatures climb surprisingly fast in the car’s interior. Here’s a table from Grundstein et al.:
Grundstein
It’s also a misconception to think that adults are a good judge of what conditions are tolerable. Null reminds people that children are physically much more responsive to conditions—they heat up two or three times faster than adults.
Because leaving children unattended in cars is illegal in some states, one might think these deaths are a case of bad parents making bad decisions. Yet less than one in five of these hyperthermia deaths is because a parent intentionally left the child in the car to, say, run errands. Null’s statistics show that about 400 (54%) of the 760+ heat stroke deaths since 1998 occur when caregivers forget a child is in the car. Almost 30% of the deaths occur when children climb unattended into the cars by themselves and get locked in.
But perhaps the most insidious misconception is that unfit—or forgetful or distracted or hurried or overworked—parents are the most susceptible to being forgetful about such an important matter.
In an AMS presentation, the University of Georgia’s Castle Williams revealed the perceptions that lead to such mental mistakes. Many parents and caregivers don’t believe that they are capable of leaving a child in a car by mistake. As a result, these parents considered it very unlikely that their child might suffer hyperthermia in a car, even as they recognized that the consequences would be severe. They believed that certain demographics–poor, single, working parents–would be more prone to such mistakes. This mismatch in perception of risk and awareness of consequences creates a communication challenge.
“All parents are at risk for this issue. It can happen to anyone,” Williams noted. (The results from his interviews with parents were later published in the the journal, Injury Prevention). “None of the demographic variables show any kind of relationship of having an increased risk of this occurring.”
How to combat the deadly misconceptions about kids in hot cars? According to Williams, “New messaging should focus on increasing perceived susceptibility to emphasize that every parent and caregiver is equally susceptible to forgetting their child in a hot car.”
Organizations such as Safe Kids Worldwide have begun stepping up efforts to inform people of the risks. And Williams’s study shows parents are paying attention to news reports of incidents on TV and in social media. Perhaps the misconceptions can be dispelled soon.
 

Overheating in Cars

The September Bulletin of the American Meteorological Society features an article with a new table showing how fast the inside of a parked car can heat up if left with the windows closed. The data comes none too soon.
A small Kansas-based nonprofit, Kids and Cars, says that already this year, 48 children have died of hyperthermia in cars in the United States. This is a new record in the 13 years statistics have been available. An average of 37 children in the United States die each year from hyperthermia in cars.
It’s tempting to blame the spike in deaths (there were 33 last year) to the record heat in various parts of the country, but Jan Null, a CCM with Golden Gate Weather Services, cautions that hyperthermia in vehicles is a danger with or without record heat waves:

I think from the small 13-year sample that we have that probably from a statistical basis, this is within the range of what you would expect. It’s impossible, I think, to associate it with the weather totally. Is weather a factor? It’s always a factor.
According to the BAMS article, the interior air temperature of the vehicle can rise about 4°C in 5 minutes, about 7°C in 10 minutes, and 16°C in 30 minutes, and 26°C in an hour. Thus after an hour in direct sunlight, the air temperature in the vehicle can reach 57°C (135°F). Authors Andrew Grundstein, John Dowd, and Vernon Meentemeyer hope their research helps educate people about the dangers of hyperthermia to children who sometimes are inadvertently left unattended in cars.
Janette Fennell, founder and president of Kids and Cars, notes that these tragedies are due to ordinary memory error, not bad parenting, and hopes car makers will install warning systems that will alert parents who might have left their kids in cars, just as technology has made it possible already to warn of keys left in the ignition, open trunks, and low batteries. She says people can help themselves by routinely placing their briefcases, cell phones, or other needed items the back seat, near their children, so that they’ll have to look back before leaving the car.

A Slow Start, but Gaining Fast

Tropical Storm Lisa became the 12th named storm in the Atlantic Basin this week in what has suddenly become the active 2010 hurricane season that forecasters months ago had predicted. Nine of those twelve storms formed since August 21, with five of them becoming hurricanes. Before that, only one of the first three named storms (Alex) even reached hurricane strength. By contrast, 2005 (9 out of 28) and 2008 (6 out of 16)  both had numerous storms form before August 20. Why the delay this year? According to a story in Newscientist.com, a mass of hot, dry air over the oceans stunted the formation of tropical storms. Scientists traced this dry air to a massive ridge of high pressure that sat for months over Europe and Asia, causing an intense heatwave in Russia and severe monsoon rains in Pakistan this summer that killed thousands of people. But just as mid-August arrived, when the typical height of Atlantic hurricane activity is imminent, things changed. As the Weather Underground’s Jeff Masters wrote in his blog on August 17:

Vertical instability, which was unusually low since late July, has now returned to near normal levels over the tropical Atlantic, though it remains quite low over the rest of the North Atlantic. Instability is measured as the difference in temperature between the surface and the top of the troposphere (the highest altitude that thunderstorm tops can penetrate to). If the surface is very warm and the top of the troposphere is cold, an unstable atmosphere results, which helps to enhance thunderstorm updrafts and promotes hurricane development. Since SSTs in the Atlantic were at record highs and upper tropospheric temperatures were several degrees cooler than average in July, enhancing instability, something else must have been going on to reduce instability. Dry air can act to reduce instability, and it appears that an unusually dry atmosphere, due to large-scale sinking over the Atlantic, was responsible for the lack of instability.

Not until the heat wave broke near the end of August did the tropical storms really begin to form in earnest, with four storms (Danielle, Earl, Fiona, and Gaston) arising just between August 21 and September 1. And spurred by those record-high SSTs mentioned by Masters, the 2010 season has not only produced 12 named storms and 6 hurricanes, but 5 major hurricanes–four of them Category 4–making that slow start seem like a distant memory. To put this season in historical perspective, there have been yearly averages of 14 named storms, 8 hurricanes, and 4 major hurricanes since the current active Atlantic hurricane period began in 1995. This season is just one major hurricane away from moving into a 7-way tie for 3rd-most major hurricanes in a season, topped only by the 7 major hurricanes in 1961 and 2005 and 8 in 1950 (lists of most active seasons in various categories can be found here).

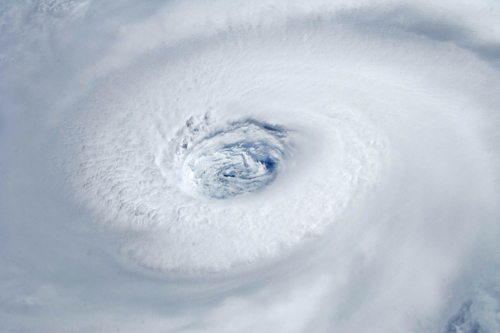
This photo, taken from the International Space Station, shows the eye of Category-4 Hurricane Igor at 10:56 Atlantic Daylight Time on September 14, 2010, as it advanced over the Atlantic Ocean. (Photo credit: NASA Earth Observatory.)