Trailblazer meteorologist Eugenia Kalnay (1942–2024)

Eugenia Kalnay two photos

We stand on the shoulders of gentle giants

By Anjuli S. Bamzai, PhD, AMS President

Last month, we lost a giant in the field of meteorology. Through the course of her illustrious career, Eugenia Kalnay pioneered not only the fundamental science and practical applications of numerical weather prediction, she also influenced many careers. Her scientific contributions and leadership led to improved forecasts, helping save lives and property across the globe and making U.S. weather and seasonal climate prediction world-class. 

Kalnay had deep ties with the AMS. In 1982, she became a Fellow of the AMS. She was elected to the AMS Council in 1995. In 2015, a named Symposium was held in her honor at the 95th AMS Annual Meeting in Phoenix. The list of awards she received from the AMS includes the following: Jule G. Charney Award (1995), Joanne Simpson Mentorship Award (2015), Honorary Member (2015), and the first ever Jagadish Shukla Earth System Predictability Prize (2024).

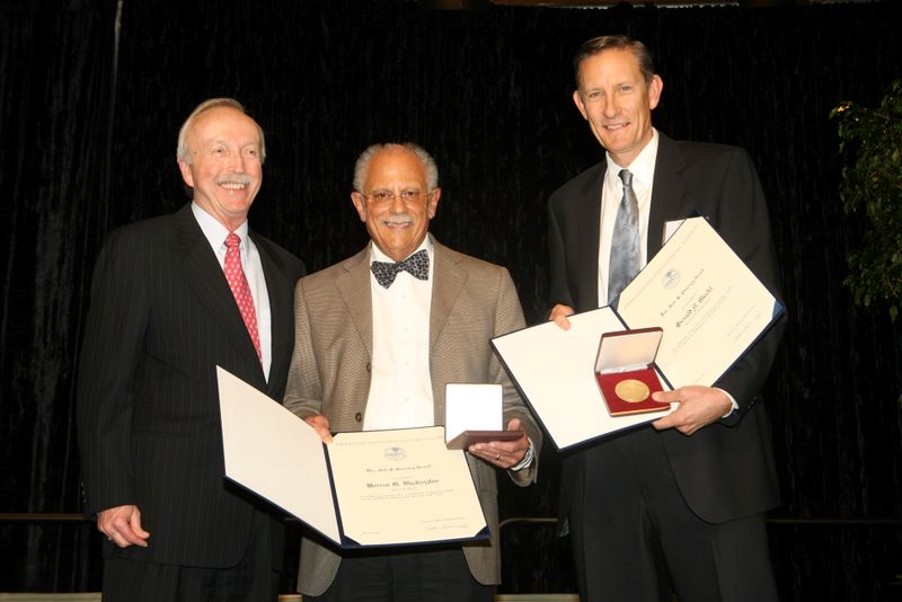
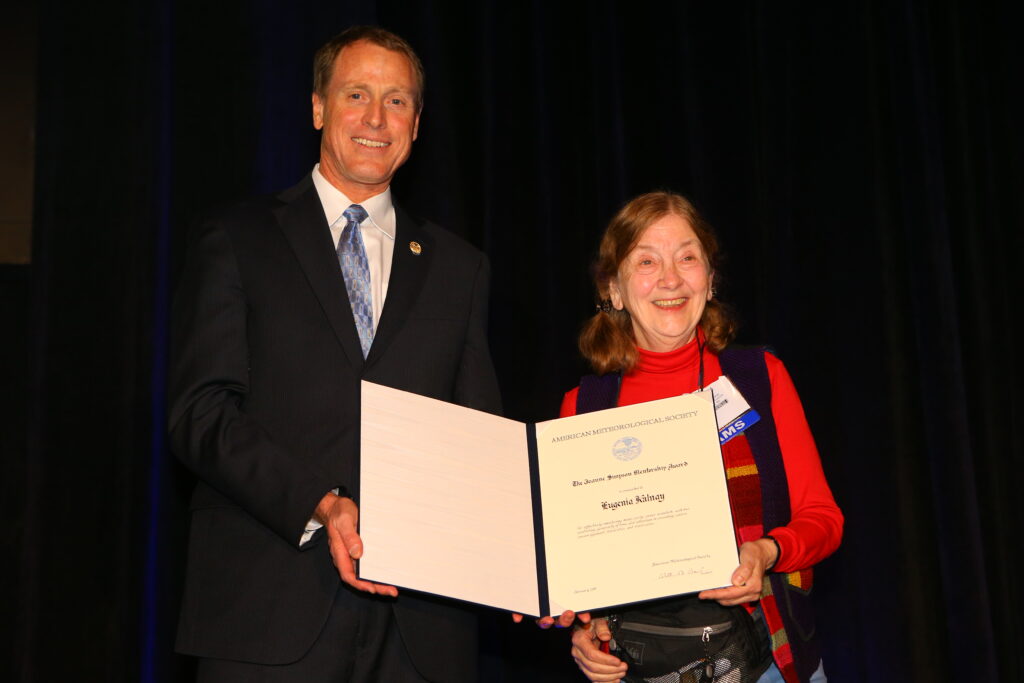
Kalnay receiving the Joanne Simpson Mentorship Award in 2015 from AMS President William Gail. (Photo credit: AMS)

Kalnay exemplified simple living and high thinking. She demonstrated how one can, through grit and determination, overcome unforeseen obstacles and achieve what one sets out for oneself. In 1966, having completed her undergraduate degree, she was working as a meteorology research assistant at the University of Buenos Aires, when a military coup occurred in Argentina. In its wake, mass resignations and disruptions on campus made it untenable for her to continue to work there. Through the timely support and intervention of Dean Rolando Garcia, she got an opportunity to pursue her studies in meteorology at MIT. Her graduate advisor was Jule G. Charney. 

The rest of her story will go down in the annals of meteorology.

In 1971 she became the first female PhD and, two years later, the first female professor in the MIT Department of Meteorology. She was a role model for other women that followed, including Paola Malanotte-Rizzoli and Inez Fung, pioneers in their own right. She later moved to NASA’s Goddard Space Flight Center Laboratory for Atmospheres; in 1984, she became Head of the Global Modeling and Simulation Branch. From 1987 to 1997, she worked as director of the National Centers for Environmental Prediction (NCEP) Environmental Modeling Center at NOAA. 

Her efforts and leadership in data assimilation approaches at NCEP led to substantive improvements in weather forecast models. The data assimilation approaches she developed at NCEP, along with the “breeding method” she created with Zoltan Toth, helped improve weather forecasts, making a useful 10-day forecast possible. 

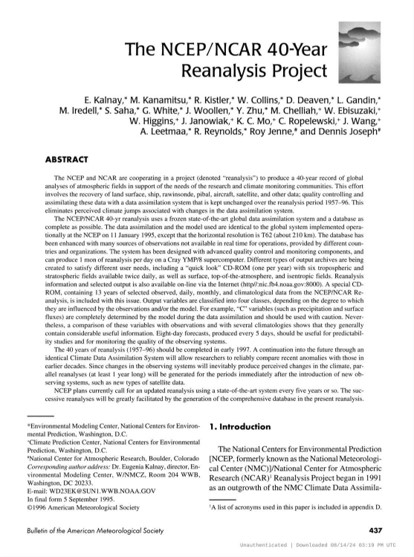
Kalnay spearheaded a major reanalysis project of 40+ years of global climate data there (and later, 50- and 60-year reanalyses), which became a keystone for climate science. The 1996 paper in BAMS describing the 40-year reanalysis project has, at last count, been cited a staggering 35,330 times, making it one of the most widely referenced articles in geosciences. According to the American Academy of Arts & Sciences, “The reanalysis is certainly the most scientifically fertile dataset in climate science since its creation (and perhaps for all time).” 

The 50-year reanalysis data set was distributed as a CD-ROM at an AMS annual meeting. It was a precursor for other reanalysis datasets that followed, such as paleo reanalysis and climate of the 20th century.

<<The NCEP/NCAR 40-year Reanalysis Project paper was published in 1996 in the Bulletin of the American Meteorological Society.

After retiring from federal service, Kalnay returned to academia and was appointed Robert E. Lowry Chair of the School of Meteorology at the University of Oklahoma. In 1999, she joined the Department of Atmospheric and Oceanic Science at the University of Maryland, College Park. She subsequently served as Distinguished University Professor and was an active researcher till the end.

In 2002 she published a book entitled Atmospheric Modeling, Data Assimilation and Predictability. It is now in its fifth edition, and has been translated into Chinese and Korean.

Left: Kalnay’s book, published in 2002. Center: Kalnay with Ron McPherson (left) and Louis Uccellini (right), both past AMS Presidents and former NCEP Directors, at the Symposium of the 50th Anniversary of Operational Numerical Weather Prediction, June 2004 (photo credit: NOAA NCEP). Right: Kalnay and two of her colleagues, Sumant Nigam and Zhanqing Li, were featured on the cover of the May 2004 issue of Science. The article highlighted foreign-born meteorologists from the University of Maryland, College Park’s Department of Atmospheric and Oceanic Science.

A 2010 interview in the WMO Bulletin gives us a glimpse into Kalnay’s passion for meteorology.  

“I’m lucky to be working in atmospheric sciences,” she said. “It’s a fascinating subject. Working in meteorology is like working in physics, but without the danger of anybody saying, ‘So why are you doing that? What is the use?’ What we do is incredibly useful, especially since it is not national or regional, but global.”

In the past decade or so, Kalnay had been working on the leading-edge topic of climate change and sustainability, recognizing, as she and her colleagues wrote in a 2023 paper, that “the Earth is a very large and complex system that consists of human and natural components interacting bidirectionally with each other.” She and her team — which included Safa Mote and Jorge Rivas, Kalnay’s son — were extending concepts from weather forecasting, such as uncertainty, high sensitivity, and error propagation, to the coupled human-Earth system, and tackling its dynamic interactions.

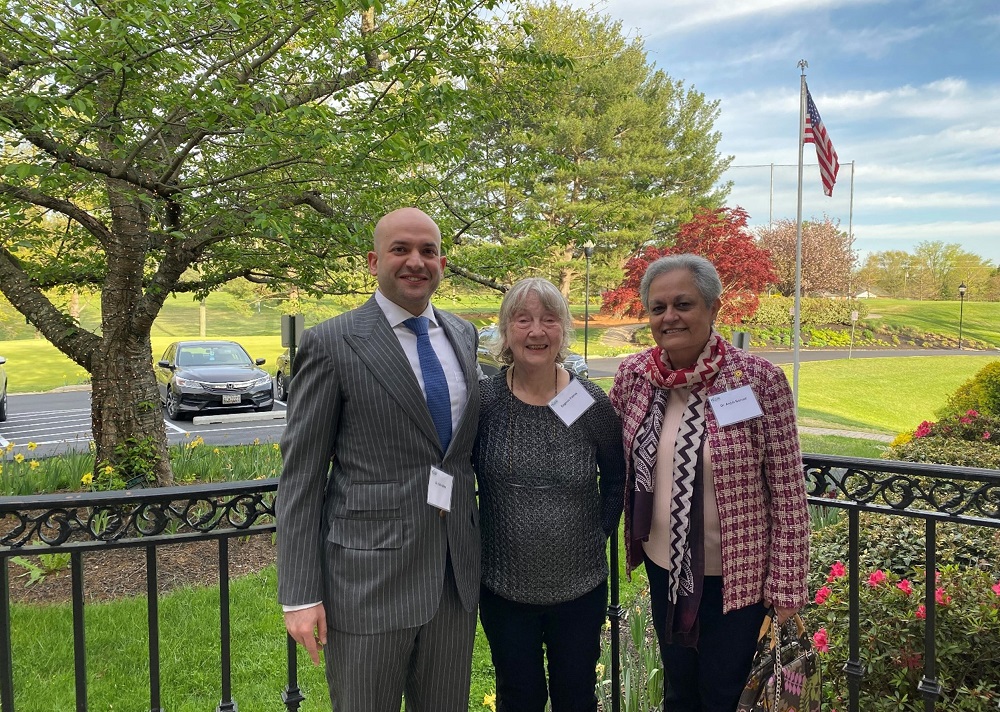
Earth Day 2022: Safa Mote, Eugenia Kalnay, and Anjuli Bamzai. (Photo credit: Anjuli Bamzai)

Eugenia Kalnay was not only an active scientist who published her results in top-notch journals, she also engaged in practical applications of the science and promoted the kind of international collaborations that continue to advance atmospheric science for the benefit of global communities and economies. She was a member of the National Academy of Engineering (NAE), Foreign Member of the Academia Europaea and Argentine Academy of Physical Sciences, and 2009 winner of the International Meteorological Organization (IMO) Prize. 

Eugenia inspired the next generation of scientists in the field, across many countries. She always maintained her academic connections to Argentina, including teaching courses and supervising research theses at the University of Buenos Aires, which granted her an honorary doctorate. She also has a women’s soccer team there named after her: Eugenia Kalnay FC!

Eugenia Kalnay was a major influence in Argentina as well as globally. Left: Kalnay (front row, second from right) with her mentor, Rolando Garcia (front row, far right) and her mentee, eminent atmospheric scientist Carolina Vera (center) in 2003, when Eugenia was designated member of the Argentina Academy of Exact and Natural Sciences. Top right: Kalnay with members of the Eugenia Kalnay football team. Bottom right: The full Eugenia Kalnay FC team. (Photo credit: Carolina Vera)

She was a beloved mentor, who was concerned not only with science but also nurturing people’s promise, collectively and individually—including advancing women in the field. An interview with the Inter-American Network of Academies of Sciences showcases some of the wisdom she left for us:

Of course, women should be in science!  Why would one even think of wasting the brains of half of the scientifically inclined population?

The most important advice is to work on what you like to do, without worrying about money or recognition, which will come if you put passion in your work.

Learn to speak clearly, briefly and forcefully, and don’t allow others to interrupt you!

She was a kind a generous soul, and her unstinting generosity in providing advice, encouragement, leadership and inspiration will be missed. Her enduring legacy will be a beacon of light for generations to follow.

When I posted the sad news of her passing on the AMS Open Forum, there was an outpouring of condolences from every quarter of the globe. 

Even as we grieve our loss, we celebrate her tremendous contributions and leadership.

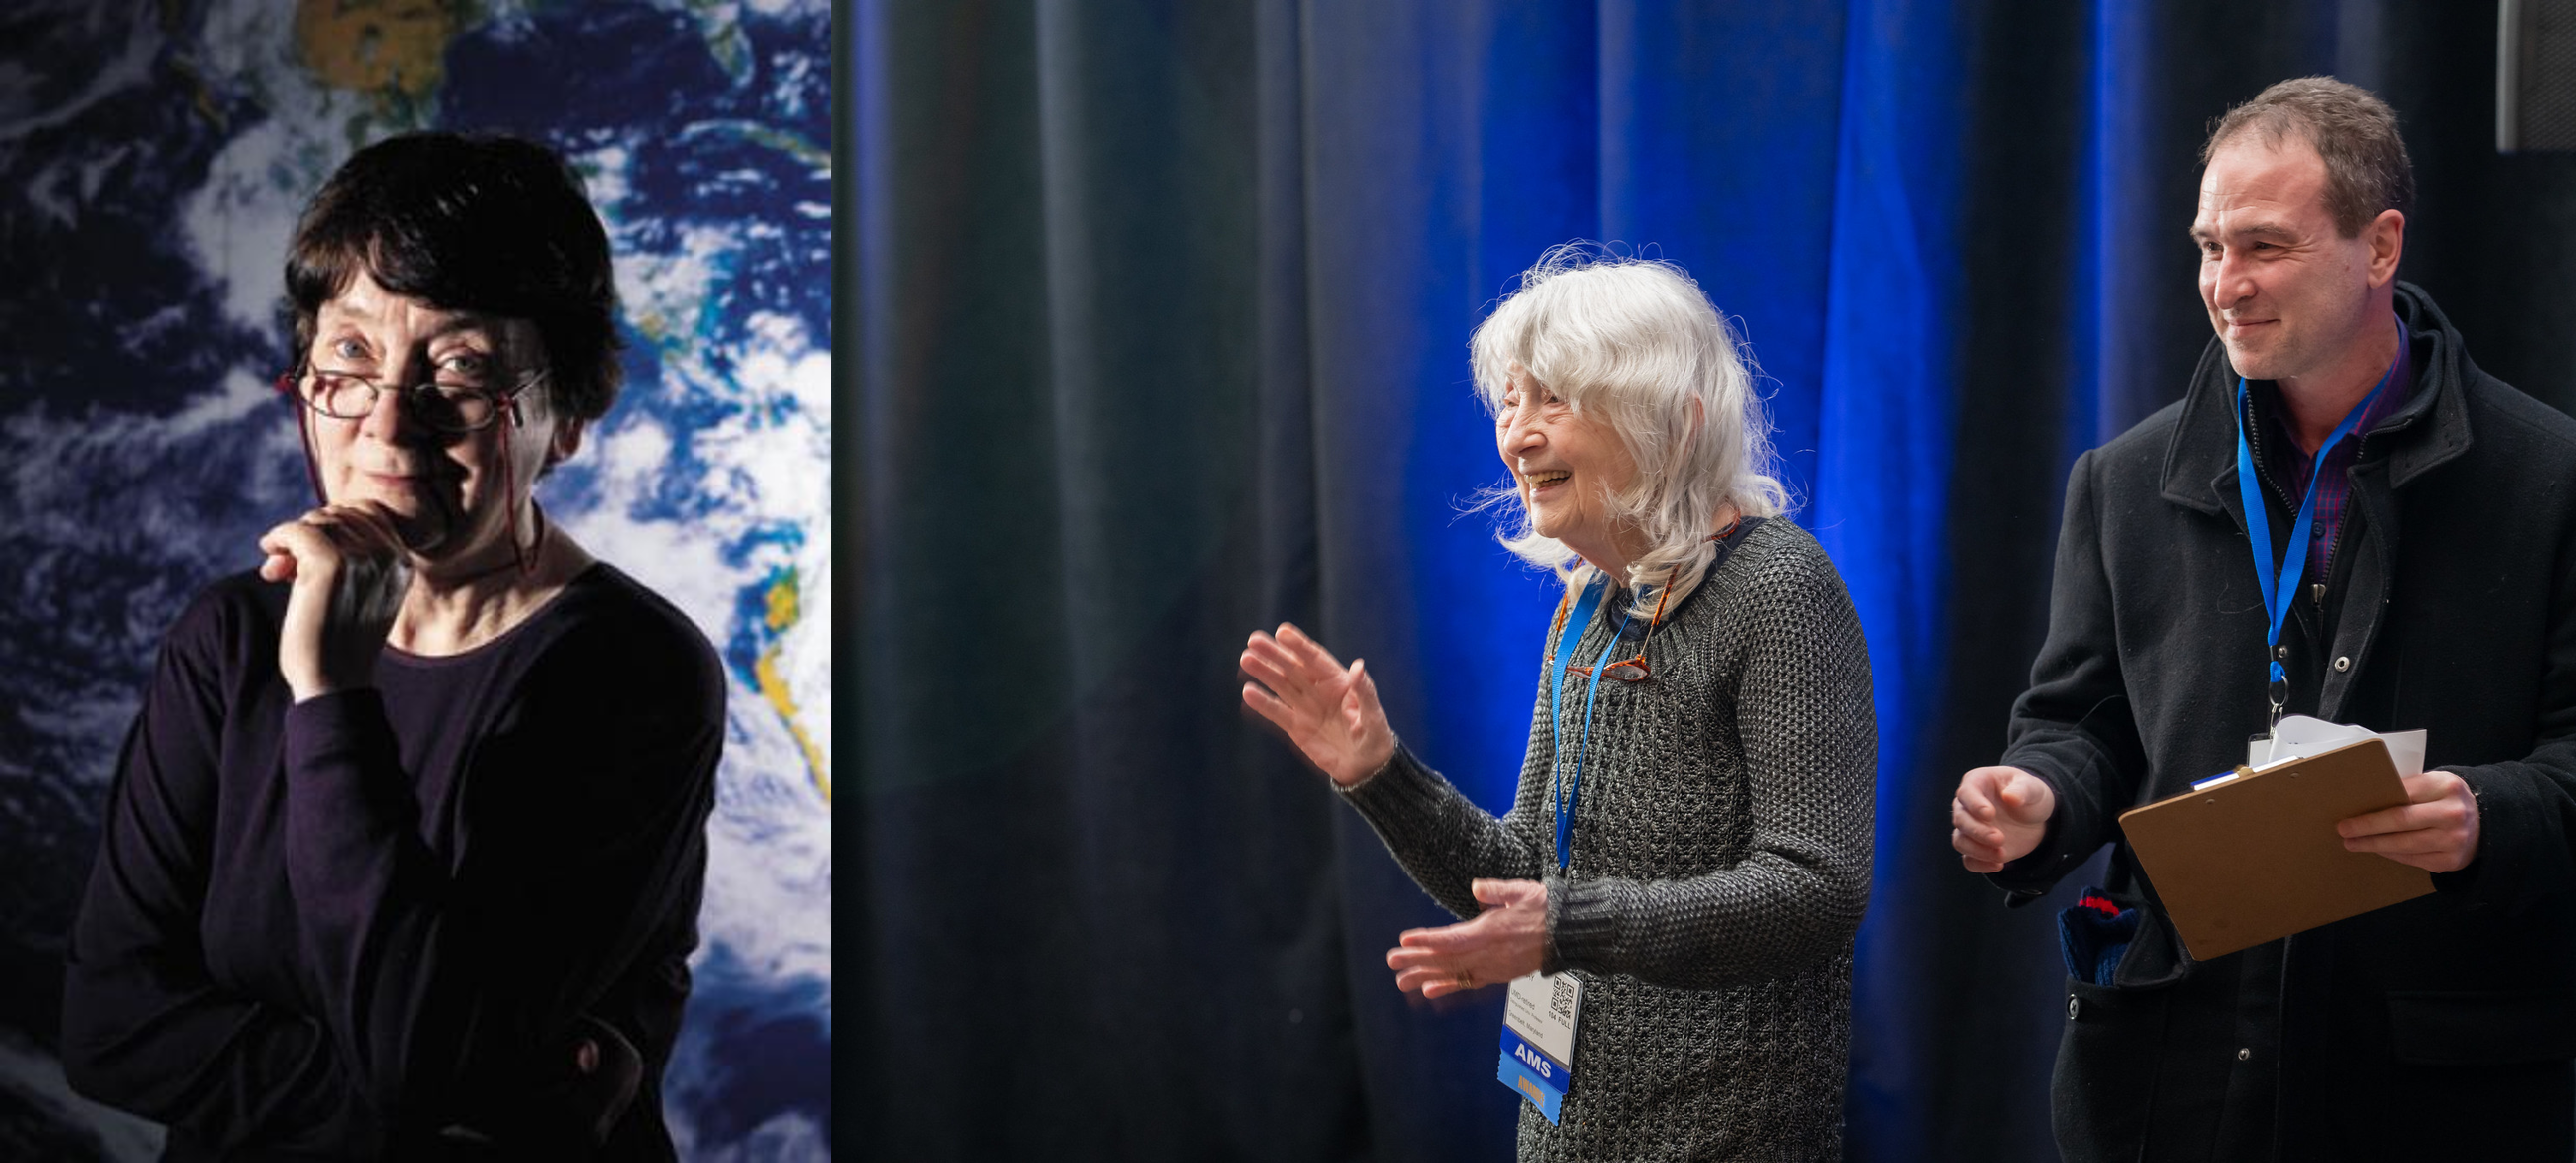
Photos at top of post: Left: Eugenia Kalnay (photo credit: John Consoli, University of Maryland). Right: Kalnay and her son Jorge Rivas at the 2024 AMS Awards ceremony, where she received the Jagadish Shukla Earth System Predictability Prize (photo credit: AMS).

Anjuli is grateful to Katherine ‘Katie’ Pflaumer for providing useful edits.

Key Takeaways from the “State of the Climate in 2023”

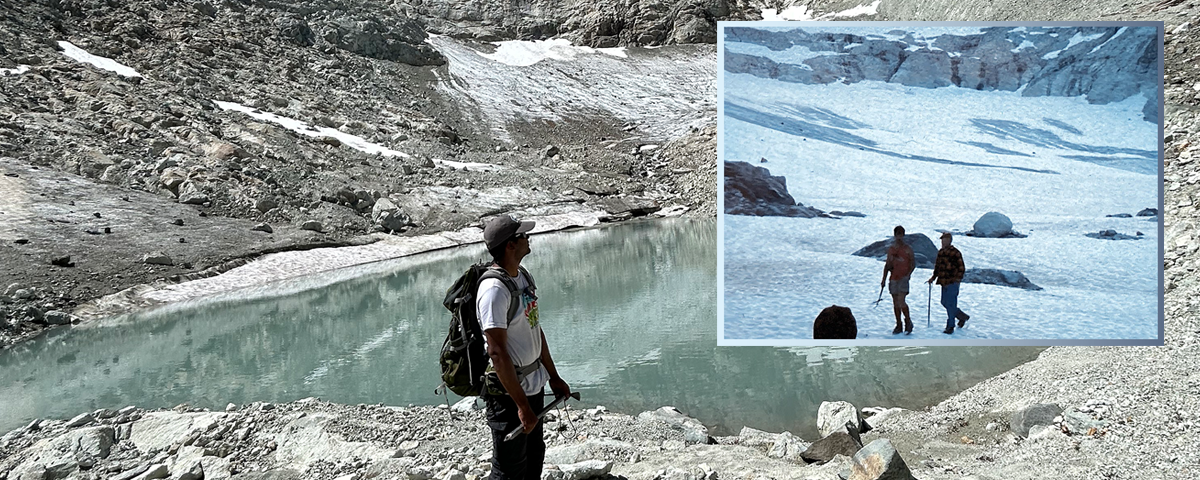
Glacial retreat at ice worm glacier

Earth hit record highs in global temps, greenhouse gases, sea level, and more last year.

By AMS Staff

Last year, global high temperatures, warm oceans, and massive wildfires broke records and sparked increasing concern about climate change. Now the annual State of the Climate report, produced by the National Oceanic and Atmospheric Administration’s National Centers for Environmental Information (NCEI) and peer reviewed and published by the American Meteorological Society, gives us an in-depth global picture of 2023, a year of extremes. 

According to the NOAA/AMS press release, the State of the Climate report this year includes contributions from more than 590 scientists from 59 countries, and “provides the most comprehensive update on Earth’s climate indicators, notable weather events, and other data collected by environmental monitoring stations and instruments located on land, water, ice and in space.”

Below are a few highlights from 2023.

Record-high greenhouse gases (again)

Global atmospheric carbon dioxide, methane, and nitrous oxide all reached higher concentrations than ever recorded. CO2 was 419.3±0.1ppm, 2.8 ppm higher than in 2023 and 50% higher than pre-industrial levels. This is the fourth-largest recorded year-to-year rise in CO2.

Record-high global temperatures

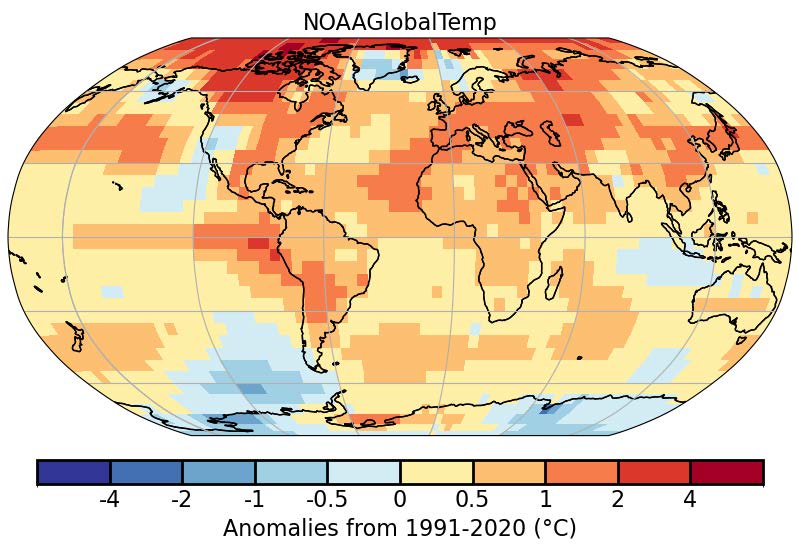
2023 officially beat 2016’s record as the hottest year overall since records began in the 1800s, partly due to the transition from La Niña to a strong El Niño. Globally, 2023 was 0.99°–1.08°F (0.13°–0.17°C) above the 1991–2020 average. The years 2015–2023 have been the hottest nine years on record.

Global Surface Temperatures Were Above Average Across Most of the World (Plate 2.1a in State of the Climate in 2023): During 2023, much-warmer-than-average conditions were observed across most of the world’s surface, with the largest positive temperature anomalies across parts of the higher northern latitudes, shown here as areas shaded from orange to red. Limited areas experienced near-average to cooler-than-average conditions (blue shading). [Note: graphic shows 2023 average temperature anomalies above or below the 1991-2020 average global temperature.]

North America overall experienced its warmest year since records began in 1910, including a heat wave in Mexico that killed 286 people. The Caribbean also experienced its warmest recorded year, and Europe its warmest or second-warmest depending on the analysis.

In Kyoto, Japan, the cherry trees reached peak bloom on March 25, the earliest bloom in the city’s 1,200-year record. Photo: Balazs Simon on Pexels.

Record-high ocean heat

El Niño also contributed to the hottest oceans ever recorded. Mean annual global sea-surface temperature was 0.23°F (0.13°C) higher than 2016’s previous record, and August 22, 2023 saw an all-time high daily mean global sea-surface temperature of 66.18°F (18.99°C). Marine heat waves were recorded on 116 days of 2023 (vs. the previous record of 86 days in 2016) and global ocean heat content down to 2,000 feet also reached record highs.

Record-high sea levels (again)

Global mean sea level rose 8.1±1.5 mm in 2023, to reach a record 101.4 millimeters above the average from 1993, when satellite measurements began.

Massive wildfires caused by heat and drought

37 million acres of Canada burned in 2023, twice the previous record, causing evacuations for more than 232,000 people and with smoke affecting cities as far away as western Europe. Australia experienced its driest August–October since 1900, leading to millions of acres burned in bushfires in the Northern Territory. The European Union experienced its largest wildfire since 2000 (in the Alexandroupolis Municipality of Greece). Notable wildfires also occurred in Brazil, Paraguay, and in the U.S. state of Hawaii.

Warm poles and a greener Arctic

2023 was the fourth warmest year in the Arctic in the 124-year record, and the warmest recorded June–September. Sea ice reached its fifth-lowest extent in the 45-year record (with many monthly and daily records set), and multi-year ice declined. Despite above-average spring snowpack in the North American and Eurasian Arctic, rapid melting led to record and near-record lows in snow-water equivalent by June. The Northern Sea Route and Northwest Passage both opened, and the Northwest Passage saw a record 42 ship transits. Arctic tundra vegetation reached its third-greenest peak in the 24-year record. 

Much of Antarctica also experienced well-above-average heat. In addition, eight months, and 278 days, saw record lows in sea ice extent and area in Antarctica; daily sea ice extent on 21 February was the lowest ever recorded.

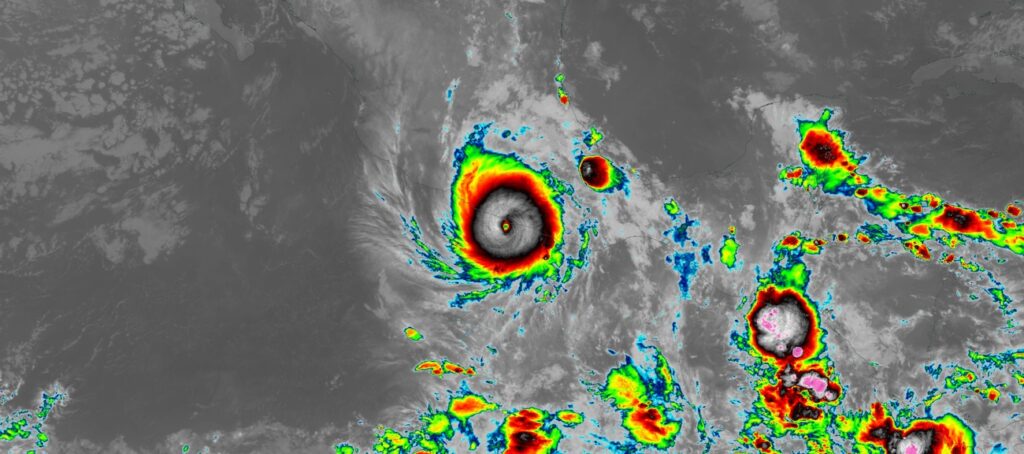
Clean infrared image of Hurricane Otis making landfall near Acapulco, Mexico. Image captured on 25 October, 2023, at 5:20 UTC, by the ABI instrument aboard the GOES-East satellite. Source: NASA Worldview.

Below-average tropical cyclone activity, yet notable storms

There were 82 named tropical storms in 2023, below average. However, global accumulated cyclone energy was above average, rebounding from 2022’s record low, and there were seven Category 5 cyclones. Tropical Cyclone Freddy became the longest lived tropical cyclone on record, lasting from February 6 to March 12; it made landfall three times and caused 165 fatalities in Mozambique and 679 fatalities in Malawi due to flooding and landslides. Typhoon Doksuri/Egay was the costliest economically, causing US$18.4 billion in damages; Beijing saw its heaviest recorded rainfall and 137 residents died in flooding. Rain and floods from Storm Daniel killed at least 4,300 people in Libya. Hurricane Otis underwent the most extreme rapid intensification on record—Category 1 to Category 5 in only nine hours—and became the strongest landfalling hurricane to hit western Mexico, devastating Acapulco.

Persistent ozone hole

The stratospheric ozone hole over Antarctica appeared earlier in the year and lasted longer than normal, and reached its 16th largest extent in 44 years.

The full State of the Climate report includes regional climate breakdowns and notable events in every part of the world. Read the full 2023 report here. Read a summary of key takeaways here.

Image at top: Ice Worm Glacier in the North Cascade mountains of Washington, United States, which was under continuous annual monitoring from 1984 onward and disappeared in 2023. Large photo: The location of former Ice Worm Glacier on 13 August 2023. Inset photo: Ice Worm Glacier on 16 August 1986. Photo credits Mauri Pelto.

Asian American and Pacific Islander Heritage Month Spotlight: Dr. Syukuro “Suki” Manabe

By Anjuli S. Bamzai, AMS President

My graduate advisor at George Mason University, Dr. Jagadish Shukla, displayed the photos of four meteorologists in his office: Drs. Norman A. Phillips, Jule Charney, Edward Lorenz, and Syukuro “Suki” Manabe. All giants in their field, they had been his PhD advisers at Massachusetts Institute of Technology (MIT). In the 1990s, as I pursued my graduate degree at Dr. Shukla’s Center for Ocean-Land-Atmosphere Studies (COLA), the scientific family tree remained strongly connected, and so I in turn had the chance to cross paths with luminaries like Manabe in person.

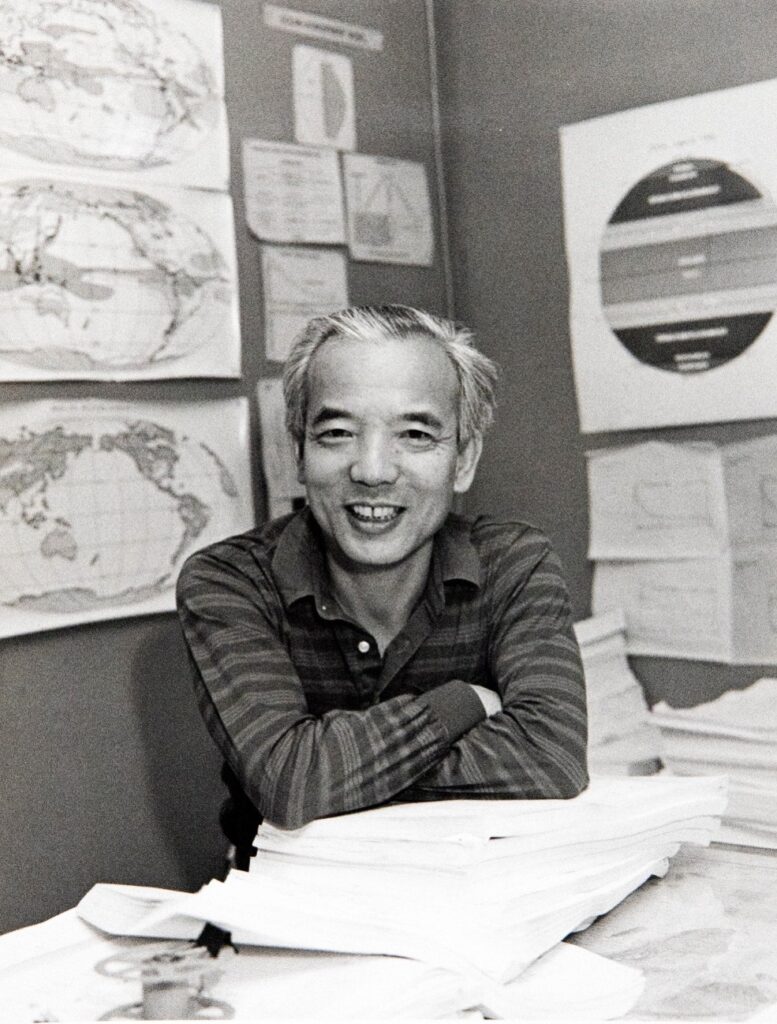
Suki Manabe photo

Circa 1994, I had the privilege of hearing Manabe–or, as I came to refer to him, Suki-san–give the inaugural talk at the newly established COLA. He spoke about the use of dynamical general circulation models to study the atmosphere and its coupling to land, using a simple ‘bucket’ model to discover emergent properties of this complex, chaotic system. He was an animated speaker; it was apparent that he was driven by curiosity and sheer love of the science that he was pursuing.

I was inspired by his ability to explain the properties of such a complex system as the Earth in such elegant terms. Suki-san’s clarity and scientific passion resulted in contributions to our understanding of climate the importance of which cannot be overstated. As I began my own foray into Earth system science, those initial interactions were a formative experience.

Left: Suki-san enjoying his work. Photo courtesy of Dr. V. Ramaswamy.

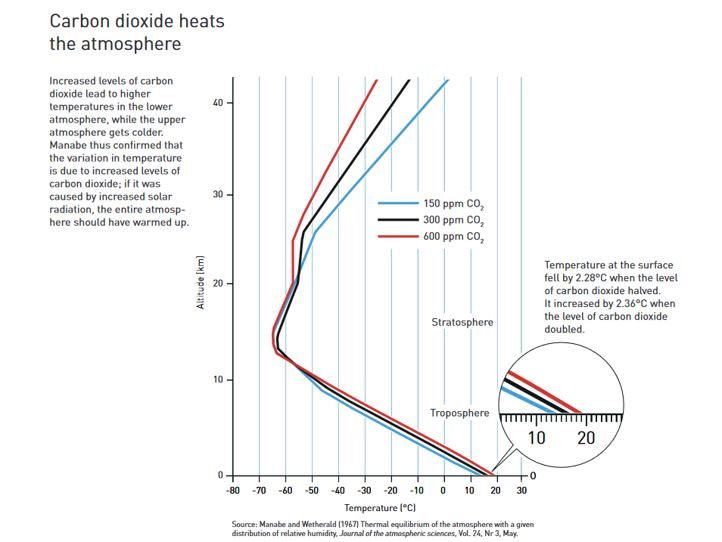
The models he used were relatively simple compared to the complex Earth system models of today. Yet Manabe and Wetherald (1967), published in the AMS’s Journal of the Atmospheric Sciences, is arguably one of the most influential papers in climate science. It demonstrated a key feature of the atmosphere with an increase in carbon dioxide: rising temperatures closer to the ground while the upper atmosphere got colder. If the variation in solar radiation was primarily responsible for the temperature increase, the entire atmosphere would have gotten warmer.

Graphic from Phys.org, based on Manabe and Wetherald (1967), Figure 16, “Vertical distributions of temperature in radiative convective equilibrium for various values of CO2 content.”

The work that Suki-san and his team conducted comprised a major component of the 1979 report, “Carbon dioxide and climate: A scientific assessment.” Led by Jule Charney from MIT, it is now commonly referred to as the Charney Report. The main result of the succinct 22-page report was that “the most probable global warming for a doubling of [atmospheric] CO2 [is] near 3°C with a probable error of ± 1.5°C.” Perhaps most importantly, the report ruled out the possibility that increasing CO2 would have negligible effects. This estimate of climate sensitivity has pretty much withstood the test of time; in the past forty years, annual average CO2 concentrations increased by ~ 21% and the global average surface temperature increased by ~0.66°C. How prescient!

Suki-san was one of the panelists who shared their insights at a session that the National Academy of Sciences’ Board on Atmospheric Sciences and Climate (BASC) convened during its November 2019 meeting to commemorate the 40th anniversary of the Charney Report. Suki-san’s concluding slide pretty much summed up his philosophy: make your model just as complicated as it needs to be, no more. (See photo below.)

Panelists photo and concluding slide. Slide text says, "Concluding Remarks: 
[Bullet point one] Satellite observation of outgoing radiation over annual and inter-decadal time scale should provides macroscopic constraint that is likely to be useful for reducing large uncertainty in climate sensitivity.
[Bullet point two] It is desirable to make parameterization of subgrid-scale process 'as simple as possible', because simpler parameterization is more testable."
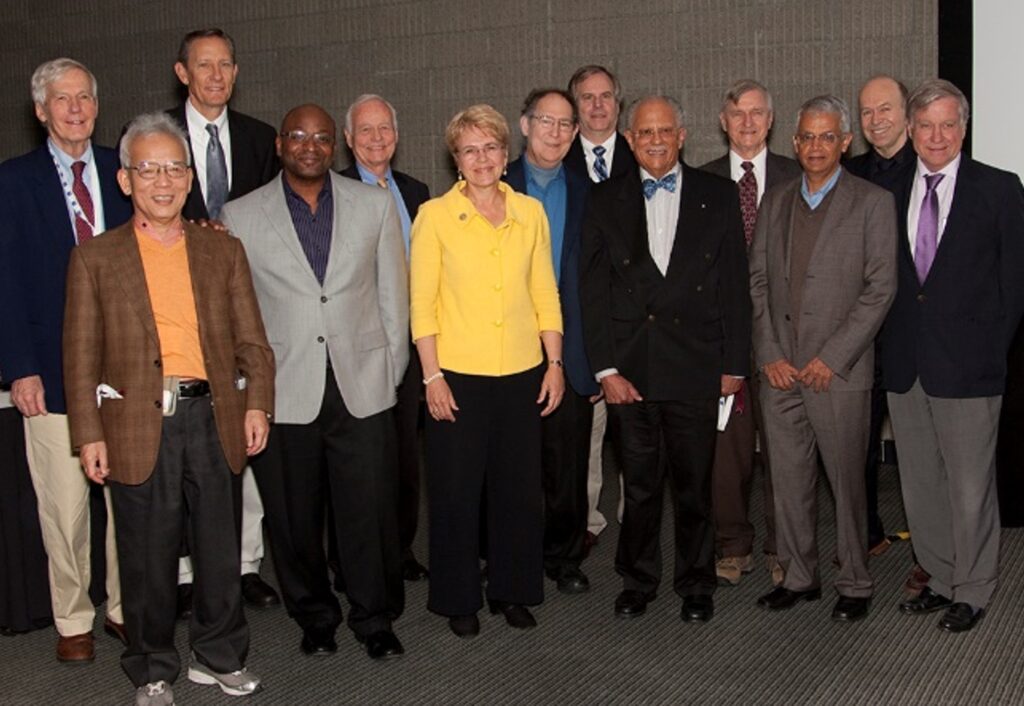
Left: Panelists at the November 21, 2019 session on The Charney Report: Reflections after 40 years at the BASC meeting. (Left to right) Drs. Jagadish Shukla, former student of Jule Charney; D. James Baker, member of the original authoring committee; Jim Hansen and Syukuro Manabe, major contributors to the original report; and John Perry, staff lead for the report. Right: Dr. Manabe’s final slide at the Charney Report session at BASC. Photos courtesy of Anjuli Bamzai.

October 5, 2021, was such an exciting day to wake up to! The Nobel Prize in Physics was shared by Drs. Syukuro Manabe, Klaus Hasselman, and Giorgio Parisi. The citation reads: “The Nobel Prize in Physics 2021 was awarded for groundbreaking contributions to our understanding of complex physical systems” with one half jointly to Syukuro Manabe and Klaus Hasselmann “for the physical modelling of Earth’s climate, quantifying variability and reliably predicting global warming,” and the other half to Giorgio Parisi “for the discovery of the interplay of disorder and fluctuations in physical systems from atomic to planetary scales.”

As he eloquently stated on the momentous day that he received the Nobel Prize, “I did these experiments out of pure scientific curiosity. I never realized that it would become a problem of such wide-ranging concern for all of human society.”

The accompanying press release on the Nobel Prize particularly cites Suki-san’s work at NOAA in the 1960s, noting that “he led the development of physical models of the Earth’s climate and was the first person to explore the interaction between radiation balance and the vertical transport of air masses. His work laid the foundation for the development of current climate models.”

Left: Event to honor Nobel Laureate Dr. Suki Manabe at National Academy of Sciences. (Left to right) Drs. Jagadish Shukla, Suki Manabe and Marcia McNutt, President National Academy of Sciences. Photo courtesy of Dr. J. Shukla. Right: (Left to right) Drs. V. Ramaswamy, Director, NOAA GFDL, Suki Manabe, and Whit Anderson, Deputy Director, NOAA GFDL, celebrating the big news of Suki-san’s Nobel Prize, October 2021. Photo courtesy of Dr. V. Ramaswamy.

It is no exaggeration to state that the modeling findings by Suki Manabe and, about a decade later, Klaus Hasselman, opened not only an era of climate modeling but also an entirely new subfield of climate science, viz., detection and attribution (D&A) through fingerprinting and other techniques. Observations have provided an important reality check to model simulations through these D&A efforts.

The current torchbearers of the D&A tradition are Drs. Ben Santer, Tim DelSole, Reto Knutti, Francis Zwiers, Xuebin Zhang, Gabi Hegerl, Claudia Tebaldi, Jerry Meehl, Phil Jones, David Karoly, Peter Stott MBE, Tom Knutson, and Michael Wehner, among others. Over the years several of them have also gone on to receive AMS awards—including, in Meehl’s case, the Jule G. Charney Medal. Speaking of awards, Jonathan Gregory is the most recent recipient of AMS’s Syukuro Manabe Climate Research Award, which has also been bestowed on Drs. Joyce Penner and Cecilia Bitz. Next year, consider nominating someone for the Manabe Award, the Charney Medal, or the new Jagadish Shukla Earth System Predictability Prize!

Those of us in the atmospheric and related sciences benefit directly from Suki Manabe’s scientific legacy and intellectual passion, and all of human society owes Suki-san a great debt for helping us to understand climate change, one of the greatest challenges humankind has ever faced.

Anjuli is grateful to Katherine ‘Katie’ Pflaumer for providing useful edits.

State of the Climate: It’s All Connected

Today’s publication of State of the Climate in 2019 marks the 30th annual release in this series of supplements to the Bulletin of the American Meteorological Society. The report is not just a service for immediate use as the latest status report on climate. It’s a resource that people worldwide will use throughout the year, and indeed as a reference through the coming years. The report, now online only, is meant to stand a test of time as a bedrock of other reports and decisions.

SOCcover2Despite the rapid pace of writing, editing, and reviewing, this is obviously not the first (or last) assessment of 2019’s climate. So we still often get asked—why now? Why release in August 2020 a comprehensive, validated check-up on the health of our planet’s climate in 2019 August, instead of in January, when it’s still hot news?
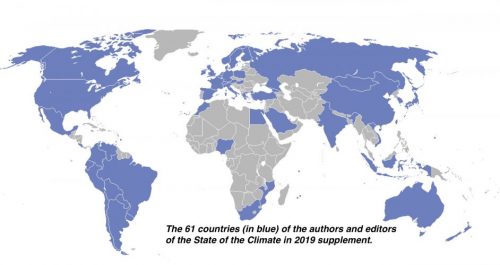
Co-editor Jessica Blunden of NOAA addressed the question a number of years ago, with a helpful look behind the scenes of State of the Climate. You can appreciate, first of all, the amazing job she and coeditor Deke Arndt (also of NOAA) do to pull this all together so fast—they’re coordinating the work of more than 500 authors and chapter editors from 61 different countries. So naturally, at first glance, churning out this report in only a matter of months is a managerial triumph–a testament to international cooperation:

The production of this document really does “take a village”; without the dedication and hard work of every single one of the people who contribute to this process, the quality and scope of the report would not be possible. Each year the number of authors tends to increase as we add new information to the report.

SOCauthormap2In just the past decade alone Blunden and Arndt have added 150 authors and 13 additional countries. Why so many authors?
The authors are asked to contribute based on their expertise in a specific field. For our Regional Climates chapter, which is comprised of annual summaries for countries around the world, the authors are often affiliated with a specific country’s official meteorological/hydrological agency and provide analysis based on data from that agency. it’s not just any process of coordination. State of the Climate is an elaborate scheme to make a scientifically worthwhile document:

The development of the report is quite rigorous, with writing, two major peer-review processes, technical editing, layout, and approval. After the calendar year has ended, authors are given about six weeks to develop their content and provide an initial draft that is reviewed by the chapter editors.

Then the chapter editor has the draft reviewed by two or three scientists with expert knowledge in that field. Generally, we allow one to two weeks for this review to be completed and another one to two weeks for the authors to make revisions, as needed, and for the chapter editors to prepare the new version for a formal, external review.

The external review process involves anonymous peer reviews, and BAMS allows three weeks for these reviews to be completed. The authors and chapter editors then have two weeks to make revisions based on these comments and submit the final draft for approval.

Then there’s editing and layout and so on . . . as Blunden summarizes:

This document takes the time to provide the most accurate information available on the state of the climate system.

But the time isn’t actually about writing and reviewing; it’s the comprehensiveness of 429 pages and a bazillion references (no, we didn’t count them). A report that started as a 30-pager gets bigger and more precise with each iteration, because the value increases:

The longer a data record is and the larger the area it covers, the more useful it is for putting a particular climate indicator into context, for example comparing one year to another, or detecting trends over time. Today we are fortunate to have technologies and capabilities that were not available to us decades ago, such as satellite observations, but to use all those observations for climate research means combining observations from multiple sources into a single, seamless climate data record, which is neither fast nor easy.

With both satellite and direct observations, it is important to reconcile data discrepancies and inaccuracies so that the climate records are correct, complete, and comparable, and this painstaking process can take years. For our report, a high-quality dataset is ready for inclusion only after its development processes and methodologies have been scrutinized through peer review with published results. That way readers of the State of the Climate reports can depend on detailed journal articles if they want to understand the details of a data record.

The process of creating a climate quality data set and then having it evaluated by other scientists through peer review is so challenging, no more than a few are added to the State of the Climate report each year.

So the State of Climate is a testament to a complex process, with complex, interrelated data sources that cry out for the reconciliation and comparison that makes the report unique. And of course, all about a climate that is nothing if not the paragon of complexity.

As Deke Arndt explains about Earth’s climate (in a webinar to watch before using State of the Climate): “If the Earth didn’t spin, and we didn’t have day and night, it would be very simple.”

That sums up the reason the State of the Climate is not simple . . . or small, or fast. It is all connected.


State of the Climate: It's All Connected

Today’s publication of State of the Climate in 2019 marks the 30th annual release in this series of supplements to the Bulletin of the American Meteorological Society. The report is not just a service for immediate use as the latest status report on climate. It’s a resource that people worldwide will use throughout the year, and indeed as a reference through the coming years. The report, now online only, is meant to stand a test of time as a bedrock of other reports and decisions.
SOCcover2Despite the rapid pace of writing, editing, and reviewing, this is obviously not the first (or last) assessment of 2019’s climate. So we still often get asked—why now? Why release in August 2020 a comprehensive, validated check-up on the health of our planet’s climate in 2019 August, instead of in January, when it’s still hot news?
Co-editor Jessica Blunden of NOAA addressed the question a number of years ago, with a helpful look behind the scenes of State of the Climate. You can appreciate, first of all, the amazing job she and coeditor Deke Arndt (also of NOAA) do to pull this all together so fast—they’re coordinating the work of more than 500 authors and chapter editors from 61 different countries. So naturally, at first glance, churning out this report in only a matter of months is a managerial triumph–a testament to international cooperation:

The production of this document really does “take a village”; without the dedication and hard work of every single one of the people who contribute to this process, the quality and scope of the report would not be possible. Each year the number of authors tends to increase as we add new information to the report.

SOCauthormap2In just the past decade alone Blunden and Arndt have added 150 authors and 13 additional countries. Why so many authors?

The authors are asked to contribute based on their expertise in a specific field. For our Regional Climates chapter, which is comprised of annual summaries for countries around the world, the authors are often affiliated with a specific country’s official meteorological/hydrological agency and provide analysis based on data from that agency. it’s not just any process of coordination. State of the Climate is an elaborate scheme to make a scientifically worthwhile document:

The development of the report is quite rigorous, with writing, two major peer-review processes, technical editing, layout, and approval. After the calendar year has ended, authors are given about six weeks to develop their content and provide an initial draft that is reviewed by the chapter editors.
Then the chapter editor has the draft reviewed by two or three scientists with expert knowledge in that field. Generally, we allow one to two weeks for this review to be completed and another one to two weeks for the authors to make revisions, as needed, and for the chapter editors to prepare the new version for a formal, external review.
The external review process involves anonymous peer reviews, and BAMS allows three weeks for these reviews to be completed. The authors and chapter editors then have two weeks to make revisions based on these comments and submit the final draft for approval.

Then there’s editing and layout and so on . . . as Blunden summarizes:

This document takes the time to provide the most accurate information available on the state of the climate system.

But the time isn’t actually about writing and reviewing; it’s the comprehensiveness of 429 pages and a bazillion references (no, we didn’t count them). A report that started as a 30-pager gets bigger and more precise with each iteration, because the value increases:

The longer a data record is and the larger the area it covers, the more useful it is for putting a particular climate indicator into context, for example comparing one year to another, or detecting trends over time. Today we are fortunate to have technologies and capabilities that were not available to us decades ago, such as satellite observations, but to use all those observations for climate research means combining observations from multiple sources into a single, seamless climate data record, which is neither fast nor easy.
With both satellite and direct observations, it is important to reconcile data discrepancies and inaccuracies so that the climate records are correct, complete, and comparable, and this painstaking process can take years. For our report, a high-quality dataset is ready for inclusion only after its development processes and methodologies have been scrutinized through peer review with published results. That way readers of the State of the Climate reports can depend on detailed journal articles if they want to understand the details of a data record.
The process of creating a climate quality data set and then having it evaluated by other scientists through peer review is so challenging, no more than a few are added to the State of the Climate report each year.

So the State of Climate is a testament to a complex process, with complex, interrelated data sources that cry out for the reconciliation and comparison that makes the report unique. And of course, all about a climate that is nothing if not the paragon of complexity.
As Deke Arndt explains about Earth’s climate (in a webinar to watch before using State of the Climate): “If the Earth didn’t spin, and we didn’t have day and night, it would be very simple.”
That sums up the reason the State of the Climate is not simple . . . or small, or fast. It is all connected.


Future Hurricanes a Bit Stronger and Slower, but Much Wetter in a Warmer Climate

It’s been more than 8 months. Since Maria. Irma before. And Harvey before that. For many who endured them, it was yesterday. And here we are at the start of another hurricane season.
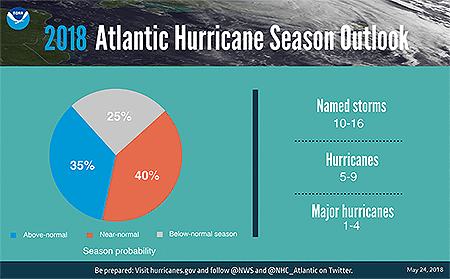
2018-NOAA-hurricane-numbersWhat can we expect? It is nearly indisputable that there will be hurricanes. NOAA’s forecast issued last week calls for 5-9 of them this year. Will they strike land? Science can’t yet say whether any hurricanes and tropical storms will or won’t later this season. It depends on atmospheric steering currents in the Atlantic basin and how they set up this year, particularly during the heart of the six-month season—from August through October.
But new research is looking beyond this season, beyond many seasons, and is discovering a different type of hurricane season less than 80 years from now, as Earth’s climate warms.
The new study published in the Journal of Climate finds that near-future hurricanes will be wetter and stronger, and they likely will move slower than before, increasing the risk of serious landfall flooding.
Scientists analyzed more than 20 recent hurricanes to determine how they might change near the end of this century, assuming an increase in global temperatures. One such hurricane—Ike from 2010, which inundated coastal Texas, killing more than 100 people and obliterating the popular Bolivar Peninsula barrier island north of Galveston, would have 13 percent stronger winds, move 17 percent slower, and be 34 percent wetter in a warmer world.
Others might move faster and be slightly weaker. But none of the storms reanimated in the future became drier.
“Our research suggests that future hurricanes could drop significantly more rain,” says NCAR scientist Ethan Gutmann, who led the study. Hurricane Harvey unloaded three to four feet of rain in a wide swath from Victoria, Texas, across the Houston area and into Port Arthur in extreme eastern Texas, breaking records and causing devastating flooding, and demonstrating “just how dangerous that can be,” Gutmann says.
That danger is being magnified as coastal populations continue to exponentially grow. “The potential influence of climate change on hurricanes has significant implications for public safety and the economy,” NCAR stated in a release about the new research. The study showed that “the number of strong hurricanes, as a percent of total hurricanes each year, may increase,” Ed Bensman, an NSF program director in the Division of Atmospheric and Geospace Sciences, says. “With increased development along coastlines, that has important implications for future storm damage.”
NSF supported the study, which viewed future hurricanes for the first time collectively at high resolution. Past studies looking at how hurricanes may change in a warmer climate have relied on climate model projections that are determined on a global scale and with temporal resolution of decades to centuries. Their resolution is too low to “see” future hurricanes. Weather models, on the other hand, can see them, but they aren’t used to see long-term because of the high costs of running them.
With the new research, scientists made use of an enormous NCAR dataset and ran the Weather Research and Forecasting (WRF) model at a high resolution (4 kilometers, or about 2.5 miles) focused on the lower 48 United States for two 13-year periods. The first determined the weather as it happened between 2000 and 2013 and the second simulated the same weather but with a climate 5° C (9° F) hotter and subsequently wetter that was warmed near the end of this century by unabated greenhouse gas emissions.
Comparing 22 historic Atlantic hurricanes to the same number of future hurricanes with very similar tracks found a collective 6 percent increase in top wind speeds, but a 24 percent increase in average rain rates. The future storms moved 9 percent slower than in the past.
Individually, each hurricane was unique, some changing one way and others differently. All were rainier. And while other studies have suggested that increases in atmospheric stability and wind shear may lower the total number of annual hurricanes and tropical storms, “from this study we get an idea of what we can expect from the storms that do form,” Gutmann says, and they are likely to be more intense.
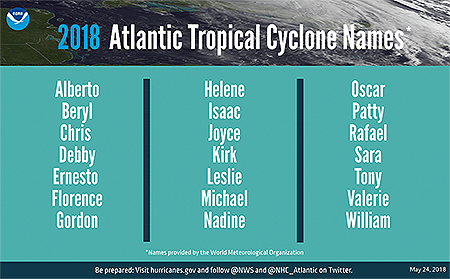
2018-Hurricane-namesThere isn’t a way to tell yet what this year’s hurricanes will be like. But it’s another year into our warming world, and this is yet another study pointing to ominous changes with hurricanes in our future.

Withdrawal from the Paris Agreement Flouts the Climate Risks

by Keith Seitter, AMS Executive Director
President Trump’s speech announcing the U.S. withdrawal from the Paris Climate Agreement emphasizes his assessment of the domestic economic risks of making commitments to climate action. In doing so the President plainly ignores so many other components of the risk calculus that went into the treaty in the first place.
There are, of course, political risks, such as damaging our nation’s diplomatic prestige and relinquishing the benefits of leadership in global economic, environmental, or security matters. But from a scientific viewpoint, it is particularly troubling that the President’s claims cast aside the extensively studied domestic and global economic, health, and ecological risks of inaction on climate change.
President Trump put it quite bluntly: “We will see if we can make a deal that’s fair. And if we can, that’s great. And if we can’t, that’s fine.”
The science emphatically tells us that it is not fine if we can’t. The American Meteorological Society Statement on Climate Change warns that it is “imperative that society respond to a changing climate.” National policies are not enough — the Statement clearly endorses international action to ensure adaptation to, and mitigation of, the ongoing, predominately human-caused change in climate.
In his speech, the President made a clear promise “… to be the cleanest and most environmentally friendly country on Earth … to have the cleanest air … to have the cleanest water.” AMS members have worked long and hard to enable such conditions both in our country and throughout the world. We are ready to provide the scientific expertise the nation will need to realize these goals. AMS members are equally ready to provide the scientific foundation for this nation to thrive as a leader in renewable energy technology and production, as well as to prepare for, respond to, and recover from nature’s most dangerous storms, floods, droughts, and other hazards.
Environmental aspirations, however, that call on some essential scientific capabilities but ignore others are inevitably misguided. AMS members have been instrumental in producing the sound body of scientific evidence that helps characterize the risks of unchecked climate change. The range of possibilities for future climate—built upon study after study—led the AMS Statement to conclude, “Prudence dictates extreme care in accounting for our relationship with the only planet known to be capable of sustaining human life.”
This is the science-based risk calculus upon which our nation’s climate change policy should be based. It is a far more realistic, informative, and actionable perspective than the narrow accounting the President provided in the Rose Garden. It is the science that the President abandoned in his deeply troubling decision.

Policy Symposium Keynote to Focus on Tree-Climate Connnections

by Caitlin Buzzas, AMS Policy Program
The keynote speaker for the 8th Symposium on Policy and Socio-Economic research at the AMS Annual Meeting in January will be author and journalist Jim Robbins. The Montana-based science writer for the New York Times just wrote a book on the connection between trees, forests and our atmosphere, The Man Who Planted Trees: Lost Groves, Champion Trees, and an Urgent Plan to Save the Planet.
Robbins’ talk for our meeting (Monday,7 January, 11 a.m., Room 19a) is going to span many different aspects of our annual meeting including public health, climate, and weather. The topic, “The Few Things We Know and the Many Things We Don’t about the Role of Trees and Forests on a Warmer Planet,” could be of interest to just about every topic the symposiums cover.
If you want a preview, check out his TED talk on YouTube, where Robbins’ commitment to the science of trees in climate is explained:

They say that everyone must have a child, write a book and plant a tree before they die. But for the writer and freelance journalist of the New York Times, Jim Robbins, if we just do the last part, we’d already be off to a great start. The author of “The man who planted trees” tells how he became a rooted defender when he observed the devastation of the old growth pine trees on his property in Colorado because of climate change. For him, science still hasn’t studied deep enough about these beings that filer air, stop floods, recover desert areas, purify water, block UV rays and are the basis of medicines as well as decorate the view. Much beyond shade and fresh water.


The 2013 AMS Annual Meeting actually goes a long ways toward fulfilling Robbins’ vision of discovering more about trees in our climate, with dozens of related presentations. At Monday’s poster session (2:30 p.m., Exhibit Hall 3), for example, Juliane Fry is presenting lab findings that may eventually refine regional climate mitigation policies that rely on tree plantings to produce cooling secondary aerosols. Also, as victims of fire disasters, forests feature prominently in the Weather Impacts of 2012 sessions (Tuesday, 8 January, Ballroom E). Similarly, on Wednesday (2:30 p.m., Exhibit Hall 3) Anthony Bedel will present a poster on the connection between changing climate and increasing potential for forest fires in the the Southeast, due to thriving fire fuels.
Young scientists are also following this line of work: Sunday’s Student Conference posters (5:30 p.m., Exhibit Hall 3) include a presentation by Zeyuan Chen of Stony Brook on understanding airflow in a cherry grove to better help orchard managers save their trees from bark beetles. Another student, Meredith Dahlstrom of Metropolitan State University in Colorado, presents in the same session on interannual and decadal climate mechanisms related to fluctuations in the prodigious capacities for carbon storage in the Brazilian rainforests.

AMS Releases Revised Climate Change Statement

The American Meteorological Society today released an updated Statement on Climate Change (also available here in pdf form), replacing the 2007 version that was in effect. The informational statement is intended to provide a trustworthy, objective, and scientifically up-to-date explanation of scientific issues of concern to the public. The statement provides a brief overview of how and why global climate has changed in recent decades and will continue to change in the future. It is based on the peer-reviewed scientific literature and is consistent with the majority of current scientific understanding as expressed in assessments and reports from the Intergovernmental Panel on Climate Change, the U.S. National Academy of Sciences, and the U.S. Global Change Research Program.
“This statement is the result of hundreds of hours of work by many AMS members over the past year,” comments AMS Executive Director Keith Seitter. “It was a careful and thorough process with many stages of review, and one that included the opportunity for input from any AMS member before the draft was finalized.”
The AMS releases statements on a variety of scientific issues in the atmospheric and related sciences as a service to the public, policy makers, and the scientific community.

Small Microbes Play Big in Climate Arena

Microbes may be small, but they shouldn’t be ignored when considering global climate.  According to a new colloquium report from The American Academy of Microbiology, microbes such as bacteria, algae, and fungi play a powerful role in the Earth’s climate.  “Incorporating Microbial Processes into Climate Models” notes how the impact of microbes on the atmosphere goes way back in time. The critical mix of carbon dioxide and oxygen we take for granted as sustaining life on the planet is due to the rise of these tiny creatures eons ago.
So what specifically do these minute forms of life have to do with climate today? According to the report, the answer is plenty.  “The sum total of their activity is enormous. But of course not all microbes are the same—some of them are producing oxygen, others are consuming it. Some are taking carbon dioxide out of the air, others are adding it.”
The big questions that the report asks and plans to address by incorporating microbial processes into climate change models: what’s the overall effect of microbial activities on the concentration of carbon dioxide in the atmosphere? Is it possible this activity will absorb the carbon dioxide being added to the atmosphere? Or will the rising global temperature might spur microbes to produce even more carbon dioxide?
The authors recognize that the gap between the climatology and microbiology is large, but they say it is not insurmountable. Some of the same technologies used to collect data for climate models—satellite imaging of cloud cover and precipitation, submarine cables that monitor changes in temperature and salinity, sensors to retrieve real-time data from remote locations—can also be applied to measuring biological phenomena. Collaboration between the sciences, they believe, will benefit both fields.
A more detailed look at the report is available here.