A Research Spotlight from 32WAF/28NWP/20Meso
On 23 December, 2022, David Zaff of the National Weather Service’s Buffalo office walked out into a blank white world of howling wind. He headed to his car to get supplies, knowing there was no way to get home. He and his coworkers were trapped at the office, in the middle of one of the most deadly and disastrous blizzards Buffalo has ever seen.
At the height of the 2022 holiday travel season, the four-day blizzard and lake-effect snow event knocked out power for more than 100,000 people, paralyzed emergency services and holiday travel, and left at least 47 dead. New York Governor Kathy Hochul described it as “the most devastating storm in Buffalo’s long, storied history.” Yet days earlier, Zaff and colleagues encountered skepticism from the public as they worked to warn the region.
Presenting at the J3 Joint Session at the 32nd Conference on Weather Analysis and Forecasting, the 20th Conference on Mesoscale Processes, and the 28th Conference on Numerical Weather Prediction, Zaff talked about the disaster and how the NWS countered accusations of hyperbole to get the word out.
Sounding the Alarm
The December 2022 snow was shocking, but not surprising. The pattern was easy enough to recognize, even 7–10 days earlier: a large high-pressure ridge forming over the western U.S., with a major trough in the east. “We knew something big was coming,” said Zaff. Five days before the storm, even low-resolution models suggested a major event. Four days ahead, the NWS started ringing the alarm bell. “We started saying, ‘A powerful storm will impact the region heading into the holiday weekend.’”
Three days out, the NWS issued an unusually emphatic Area Forecast Discussion (AFD):
“Some of the parameters of this intense storm are forecast to be climatologically ‘off the charts’ … One could certainly describe this storm system as a once in a generation type of event.”
NWS Lead Forecaster Robert Hamilton, Tuesday, December 20, 2022
That caused a stir, but many on social media dismissed it as hype. “People started saying, ‘There goes the weather service again,’” says Zaff.
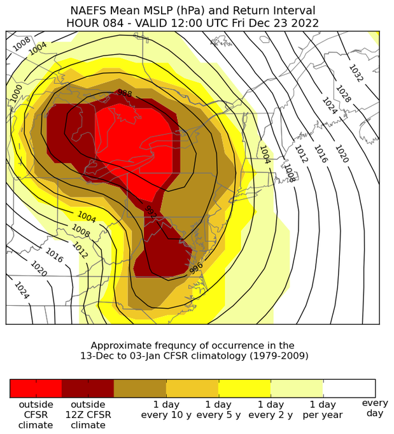
He tried to find a way to show the science graphically, highlighting the forecast as “‘outside’ the climatology” for the time of year.
The graphic and its accompanying description got attention. By then, NWS Buffalo was communicating in earnest, including on social media. A tweet with a text-filled screengrab of the Winter Weather Message received 485,000 views. “A picture is worth a thousand words,” Zaff said, “except when people actually read the words, and see how impressive this event might be.”
Left: Graphic showing forecast surface pressure for Friday, December 23, 2022, with shading showing the relative frequency of the forecast MSLP values in the Buffalo region at that time of year. Source: David Zaff.
Surviving the Storm
Before noon on 23 December, visibility dropped to near zero, and it remained that way until around midnight on 25 December. 500 Millibar heights were “extraordinary” as the pressure trough moved into the Ohio Valley, and surface-level pressure was similarly unbelievable. A top wind speed of 79 mph was measured in downtown Buffalo at 10:10 a.m. on the 23rd, and winds in the 60–70 mph range lasted for 12 hours. “[It was] just an incredible bomb cyclone,” Zaff said. “An incredible storm.”
Zaff and some colleagues slept at the office; others attempted to drive in whiteout conditions using GPS alone, while some got stuck in drifts near the office and had to leave their cars to hike the rest of the way. Meanwhile, firefighters and airport employees worked to rescue motorists trapped nearby.
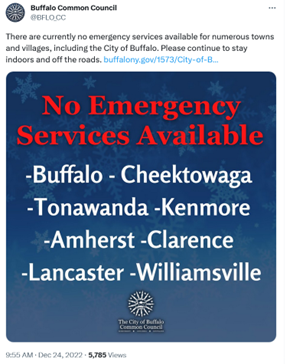
On December 24, the City of Buffalo issued “the scariest tweet I’ve ever seen,” said Zaff. The tweet stated that there were “no emergency services available” for Buffalo and numerous other towns.
“We knew by this time that there were fatalities occurring,” Zaff said. “And it just got worse and worse.”
Blizzard conditions lasted a full 37 hours–and lake effect snow wouldn’t stop for another two days. Three power substations shut down, frozen solid. Hundreds of power poles fell, and a significant percentage of locals were without power during the storm’s peak (some for days afterwards).
The 47 fatalities included people stranded outside, others who died from hypothermia in their homes, and some deaths due to delayed EMS response, according to Erie County. Hundreds of motorists were stranded on roadways during the storm. The Buffalo Niagara International Airport, with a proud legacy of operating under even the most horrific conditions, was closed for six days.
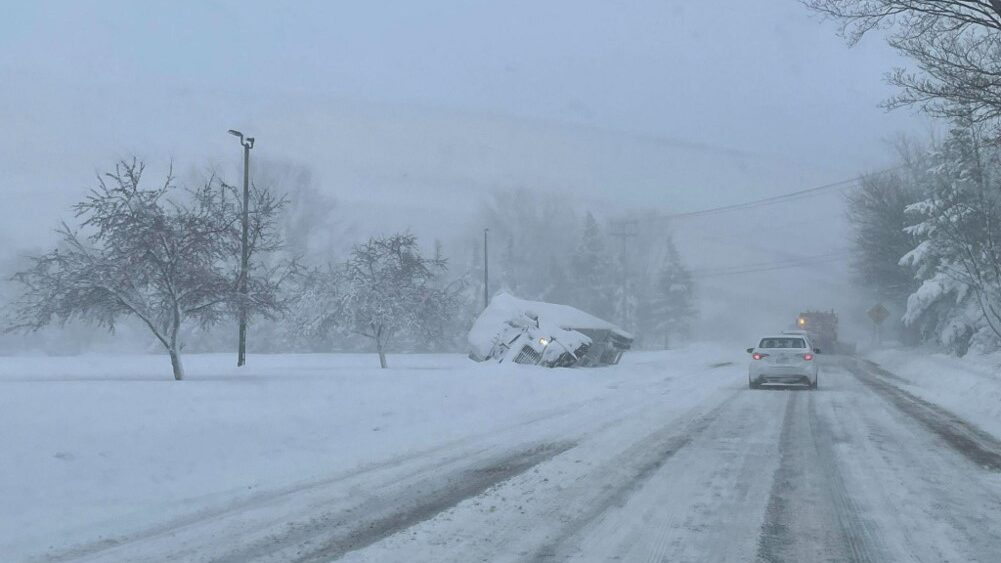
Zaff didn’t return home until late afternoon on the 25th, 18 hours after official blizzard conditions were over and having clocked 50+ hours at the office. On the drive, he saw iced-over buildings and trucks buried in snowdrifts. “It reminded me of [the movie] The Day After Tomorrow. … The impacts were tremendous.”
In his AMS presentation, Zaff compared the 2022 event to disastrous storms in 1977 (20+ fatalities, 69 mph winds, only 12” of snow yet drifts swallowed homes) and 1985 (5 fatalities, 53 mph winds, 33” snow), as well as the “Great Christmas Storm” of 1878, one of the first well-documented lake effect snow events, though lake-effect processes weren’t understood at the time. “This will likely be the storm of comparison now,” he says. “Once-in-a-generation” turned out to be right.
Future Lessons
Moving forward, said Zaff later, “Our intention is to further our relations with our Core Partners, including elected officials, emergency management, and the media [and] provide more probabilistic information that supports our ongoing Impact Decision Support Services. We hope to improve our outreach as well, instilling more confidence with the public.”
NWS will continue to provide improved decision support for partners, which may lead to more proactive road and school closures that could save lives in the future.
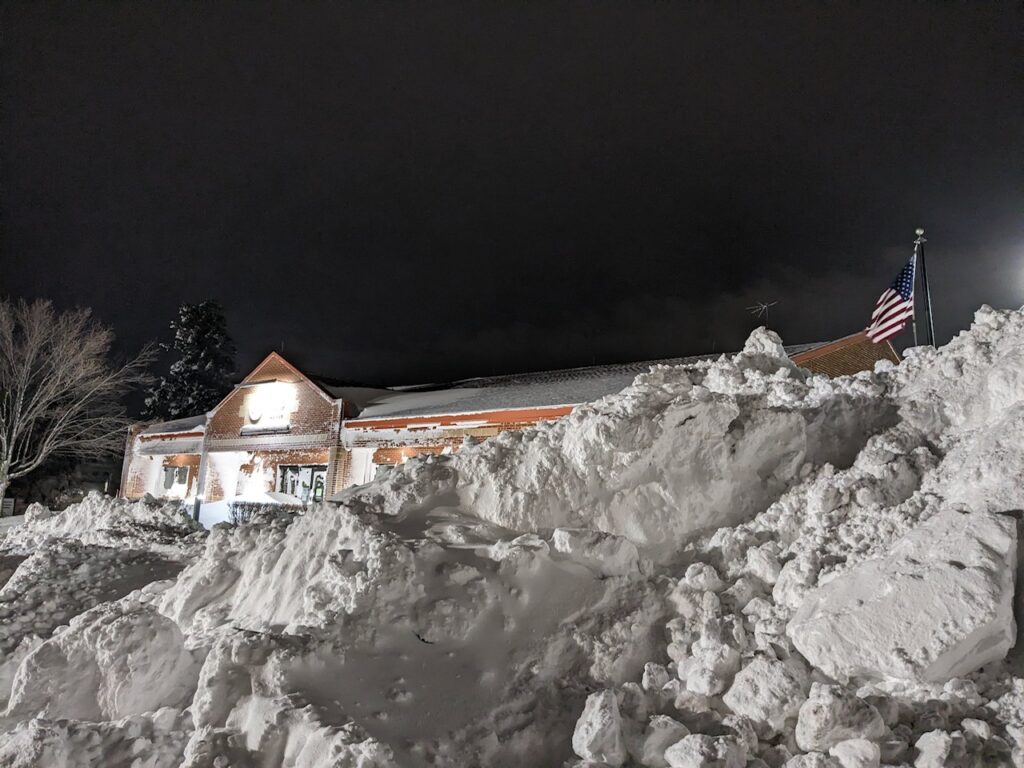
Photo at top: Buffalo roadways at 4 p.m. on December 25, 2022, 18 hours after blizzard conditions had passed. Photo credit: David Zaff.
About 32WAF/20Meso/28NWP
Predicting and understanding storms and other weather events is a complex business with real-world impacts. The American Meteorological Society’s 32nd Conference on Weather Analysis and Forecasting/28th Conference on Numerical Weather Prediction/20th Conference on Mesoscale Processes brought researchers, forecasters, emergency managers, and more together to learn about and discuss the latest scientific developments. The conferences took place in Madison, WI, and online 17–21 July, 2023. Recordings of the sessions are available here.