Science for Oysters…and Oysters for Scientists

One of the highlights of New Orleans is its distinctive, world-renowned cuisine. And indulging in that famous cuisine more often than not means enjoying the bounty of the Gulf of Mexico. AMS members will descend on New Orleans right at the high season for oysters, according to food critic Brett Anderson writing in the local paper, the Times-Picayune, right before Christmas:

Meteorologically speaking, it is an inconvenience that Louisiana oysters are never more delicious than they are right about now, just as we’re growing accustomed to the daily threat of something resembling winter. Wouldn’t it be nice if oysters were at their crispest in August instead, when they could provide cool relief from the blood-hot sun? Yes, that would be nice, but our reality is pretty sweet as well: oysters at their peak, tasting like clean ocean water, firm-fleshed and sitting pert on their shell. They’re perfectly sized, large enough to announce their presence, small enough to swallow whole. Get another dozen. It’s gift-giving season.

According to the reports from the restaurants, the local crop is back to the quality seen before the big BP Horizon oil spill of 2010. Prices and supplies have normalized.
So while you’re hunting for some Gulf oysters on the half-shell later this month at the AMS Annual Meeting, keep in mind that this delicacy is not only featured on your plates but, also, featured on scientific program. In particular, two presentations might ease concerns you have about subjecting your stomach to the raw variety (of food, not science, of course!). Gina Ylitalo (NOAA) and colleagues will present on “Oil Spills and Seafood Safety” (8:45 p.m., Tuesday, Room 333). They write

Thousands of seafood samples collected during reopening and surveillance in the Gulf, as well as those obtained dockside and in the marketplace have been analyzed using [advanced] analytical methods. While chemical compounds associated with the oil spill have been detected in seafood samples using these various analytical methods, none were present in edible tissues at levels that approached levels of concern for human consumers of seafood products from the Gulf.

Later in the same session on Tuesday, Jay Grimes (Univ. of Southern Mississippi) will talk about monitoring disease potential from raw seafood with satellite monitoring of ocean temperatures and salinity, in “Can You Really See Bacteria from Space?”.  Below is the latest bacteria estimate from their oceanographic monitoring website:
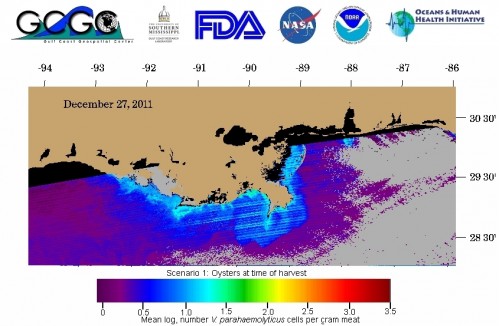
Space-based monitoring of a notorious bacteria in seafood that can cause illness in certain disease-prone diners. Right now threat levels are relatively low in the Gulf, which, presumably, means good times in New Orleans for oyster lovers.


The Hazards of the Winter Roads

We all know winter is a tough time for drivers, not only with wet and icy roads but also with poor visibility due to more dark hours, low sun angles, valley fogs, or blowing snow.
Right there you have two different problems: adverse road conditions, and adverse atmospheric conditions.
Which hazard is more of a seasonal phenomenon, and which is the greater risk to drivers? And given regional variations in winter conditions, how do the risks change with your location and time of year? Do risks depend on whether you’re driving a big or small vehicle?
Recently, Allan Curtis of the University of Lincoln and his colleagues have been putting a quantitative edge to such questions by analyzing more than 100,000 fatal crashes, one-fifth of them with commercial trucking. Some results so far that they’ll present Wednesday, 25 January (10:30 a.m., Room 348/49) at the AMS Meeting in New Orleans include:
  • 17% of all fatal accidents and 7,130 persons are killed in weather-related accidents each year.
  • The Midwest has the greatest average intra-annual variability for both trucks and passenger vehicles. For large commercial trucks, the average monthly peak occurs in January with 38.29% of accidents occurring with adverse-weather, and a minimum in June of 8.27%. For passenger vehicles, accidents are less affected by adverse-weather with an average intra-annual peak of 30.28% in January and a minimum of 6.32% in June.
  • The South has the least average intra-annual variability of accidents in adverse-weather.
  • Adverse-road related accidents are greater in all regions than adverse-weather due to the fact that accidents can occur on wet or snow/ice covered roads in the absence of adverse-weather.
One can imagine taking Curtis et al.’s data and parsing out when the forecasts for road conditions are likely to be more meaningful to drivers than forecasts for the weather itself, among other applications. Stay tuned for the presentation in a few weeks.

Weather Alerts Get More (and More) Mobile

The use of social media as a forecast tool seems to develop as rapidly as the devices themselves. In December, the NWS revealed it will soon be providing customized location-specific alerts through a user’s wireless carrier.
“We’re getting this weather, disaster, and other emergency information into your hand,” says David Green of the NWS. “The new service will use geo-location to target alerts to a person’s whereabouts. The goal is to give people greater insight into what’s going on with the weather so they can make the best decisions about how to respond.”
At the AMS Meeting in New Orleans next month, you can get a look at two more ways mobile devices are being used to aid in forecasts. In “Using Mobile Devices to Display, Overlay, and Animate Meteorological Data and Imagery,” David Santek, CIMSS/University of Wisconsin, and colleagues, will show their custom interfaces for smartphones that offer near real-time weather alerts. For more on the details of their applications and the future plans for it, check out their presentation on Monday, 23 January, at 5:00 p.m. (Room 357).
Marcel Molendijk, of the Royal Netherlands Meteorological Institute, offers up a different use in “iWitness; Damage Assessment of Severe Weather by Mobile (phone) Observations.” Instead of sending weather alerts to cell phone users, Moldendijk and colleagues collected accident damage reports from an Apple iOS application they developed, with information including a description of the event, time and location (GPS-based), and an optional photo. To get more information on the KNMI system and the results collected to date, go to the talk on Tuesday, 24 January at 2:30 p.m. (Room 356).

After the Disasters, How to Be a Holiday-Ready Nation

Weather took hundreds of lives in a record 12 billion-dollar disasters in the United States in 2011. Internationally, the disaster toll is even more startling. Tragedies have been a commonplace. The record-breaking year is a wake up call to the weather and climate community and to the nation as a whole.
Yet, on a holiday eve, a veteran of some of the worst weather of the year shows us how to give thanks. It was at a meeting, “Weather Ready Nation: A Vital Conversation” this month in Norman, Oklahoma, in an emotional presentation by Keith Stammer. If anyone knows what it means to be Weather-Ready, now, it’s Stammer, the emergency manager of Jasper County, Missouri, where basically a third of the city of Joplin was ripped apart by an EF-5 tornado nearly a mile wide.  (You can listen to Stammer’s description of the ordeal on-line.) Yet here’s how he started his talk:

The big thing you need to understand about Joplin is that at nighttime it is a city of 50,000 people; in the daytime it’s a city of a quarter of a million.  A lot of people come in for shopping, medical, for work. The one thing that translates, into in terms of this particular disaster, was that we are most grateful that it happened on Sunday evening, and not Monday evening, or the totals would have been absolutely different.

That’s a remarkable perspective to take after 162 people died, over a thousand were injured, and nearly 17,000 dwellings were lost. It’s a way to live after a year like 2011.
The discussion about making this country more resilient to the battering and bruising of a violent atmosphere, begun in Norman, will continue at our meeting in New Orleans next month. A Monday lunchtime Town Hall by the same name, organized by the leaders of the Norman conference, will be a highlight (12:15 p.m., Room 238). After Christmas, we’ll report on some of the Weather Ready Nation ideas and comments in The Front Page as preparation for the week’s deliberations.
But before refueling our minds for the Annual Meeting, a holiday is a time to replenish the heart and to experience community, so listen again to Stammer, who ended his talk thanking the 114,677 different people who stepped forward, registered as volunteers, and put in some 697,817 hours of service so far to help Joplin recover (more than a million cubic yards of debris removed so far):

All disasters are local, they start locally; they end locally, they may in fact rise to national prominence somewhere in between as ours did, but in the end, with all due respect, all of you foreigners are going to go away and we’re still left to have to handle it.  I think one of the things that helped us here is the fact that everybody was willing and able to look at this as a local effort. I can tell you that we did not have one organization or person that stood up and said, I’m in charge, you’re not, get over it. It was in fact a collaborative effort from the get-go and remains to be so today.

We are honored to celebrate a holiday with folks like that. We will be proud to make a Weather Ready Nation with them, too.

A Siren Song for Top-Down Emergency-Preparedness Thinking?

Those of us of a certain age and place in the American experience talk a lot about the meaning of tornado sirens–how it defined our awakening to the omnipresent threat of severe weather. Such sounds stick with those of us who have made weather our business–Tim Coleman et al. admit this is part of the inspiration for their history of tornado warning dissemination published in the May 2011 BAMS. The role of community sirens is surging again in research following the horrible tornado disasters of 2011, as witnessed by presentations coming up at the AMS Meeting in New Orleans by Stephanie Mullins (Univ. of Alabama-Huntsville) in the Wednesday 25 January afternoon poster session (2:30-4 p.m., Room 252/53), Kimberley Klockow (Univ. of Oklahoma; same room and day, 11:30 a.m. oral presentation), Cedar League (Univ. of Colorado/Colorado Springs) on Tuesday 24 January (2 p.m., Room 243), and others.
But what we forget is that it’s not just weather experts and the weather-obsessed who respond deeply to the sounds of emergency sirens. Witness the public outcry to a suggestion by emergency managers to standardize times of regular siren tests across a county in northern Michigan recently, reported today in the Petoskey News. Officials were intent on cutting back from twice daily soundings that had become a community ritual. The Charlevoix fire chief told his city council

that many people report that “they don’t even hear the noon or 9:30 sirens anymore” — the exact condition the change in procedure is intended to avoid.

Quite probably true. But people hear even when they’re not listening. Thanks to Dr. Klockow for pointing us particularly to this passage in the article:

Many of those favoring leaving the siren soundings in place pointed to the soundings as a hallmark of a small town. Many said they have fond memories of their kids or themselves being called home for the evening by the siren’s sound. Others said if the siren was discontinued they’d feel like they were losing yet another part of what make Charlevoix unique.

The Services Response to the Tōhoku Disaster a Focus of the 2012 AMS Meeting

The science ministry in Japan reported last week that more than 30,000 square km–eight percent of the country–is contaminated by radioactive caesium from the Fukushima nuclear plant disaster that stemmed from the Tohoku earthquake and tsunami in March. The radiation was washed out of the skies by rain and snow. As much as four-fifths of the caesium ended up in the ocean–much of it having blown northeastward toward Alaska–and currents carried it to the U.S. coastal waters within a week of reactor releases. By one week later some of the micron-sized particles had traveled around the world.
Because the geophysical dimensions of the earthquake-tsunami-meltdown last March are evident in so many ways, so are the demands it placed on scientific services–from the warnings of giant waves to forecasts of tainted precipitation and groundwater to modeling global ocean currents. Not surprisingly, the disaster literally redefined the job of the Japanese Meteorological Agency.
On the first day of full sessions at the upcoming 2012 AMS Annual Meeting in New Orleans, the epic Tōhoku cataclysm will be discussed from numerous angles, particularly the premium it put on enhanced operational response. “The earthquake and tsunami increased vulnerabilities to meteorological disasters such as sediment disasters, flood, and inundations, in the affected area, by shaking and loosening the soils and damaging the embankments and drainage facilities,” notes JMA’s Junichi Ishida.
Ishida’s presentation is the special keynote address of the Interactive Information Processing Systems (IIPS) conference (11 a.m. Monday, 23 January, Room 356). Ishida will talk about how JMA took increased vulnerabilities into account, by

  • changing criteria for heavy rain warnings to account for runoff and landslide vulnerabilties
  • lowering criteria for coastal inundation warnings (the earthquake actually lowered coastal ground levels, changing tidal configurations)
  • introduced extreme temperature warnings to account for reduced electricity capacity
  • enhanced aviation support (in particular due to traffic for relief flights) because of flight dangers including radioactive clouds

11 March Tsunami sweeps through Sendai Airport, where waters reached the second level of buildings, destroying key operations equipment, scattering mud and debris, and stranding more than a thousand people for two days. The airport eventually reopened as a hub of relief work. Photos copyright Japan Meteorological Agency, with thanks to Junichi Ishida, who will deliver the IIPS conference keynote at the 2012 AMS Annual Meeting.

At the same time (11 a.m. Monday, in Room 338) Yukio Masumoto of the Japan Agency for Marine-Earth Science and Technology will kick off a session devoted to the March 2011 disaster as part of the Coastal Environment symposium. Masumoto will speak about ocean dispersion of radioactive Caesium-137 and Iodine-131 after the Fukushima releases, including relationships with tides, surface winds and, in one case study, atmospheric fallout. In his abstract, Masumoto reports, “In the near-shore region, the wind forcing is a dominant factor that controls the flow field, while large-scale currents and eddies advect the radionuclides in the off-shore region.”
Several other Monday morning presentations in the Coastal Environment session feature rapid American responses last spring to adapt and construct viable modeling systems to depict Japan’s waterborne radiation hazards–speakers include Ronald Meris of the Defense Threat Reduction Agency, William Samuels of Science Applications International Corp (SAIC), and  Matthew Ward of Applied Science Associates.
After lunch, in the same session (2 p.m., Room 338) Gayle Sugiyama of Lawrence Livermore National Laboratory will talk about how the U.S. Department of Energy’s National Atmospheric Release Advisory Center provided analyses and predictions of the radioactive plume, estimating the exposure in both Japan and the United States. Guido Cervone of George Mason University (2:15 p.m., Room 338) will show how dispersion modeling helped reconstruct the otherwise unknown sequence of radioactive releases at the Fukushima nuclear plant. Masayuki Takigawa  (1:45 p.m., Room 338) will discuss results from regional transport modeling of the radioactivity dispersion on land and ocean, while Teddy R. Holt of the U.S. Naval Research Laboratory will show passive tracer modeling capabilities with the Fukushima events in a coupled ocean-atmosphere mesoscale modeling system (1:30 p.m., Room 338).
In a parallel session of the Coastal Environment Conference next door (1:45 p.m., Room 337) Nathan Becker of NOAA/NWS will discuss calculations of detection times for various configurations of the sensors for the Pacific tsunami warning system, concluding that, “for global tsunami hazard mitigation the installation of about 100 additional carefully-selected coastal sea-level gauges could greatly improve the speed of tsunami detection and characterization.”
Interestingly, Monday’s Space Weather posters (2:30 p.m.-4 p.m., Hall E) include a presentation by Tak Cheung of the ionospheric disruptions caused by the great Japanese earthquake last March. Forecasts of ionospheric disturbances affect yet another service in the wake of the disaster: the communications provided by shortwave radio operators. And that will be a topic for Kent Tobiska (Utah State Univ.) in the Space Weather session at 5 p.m. (Room 252/253

IPCC's New Special Report: Adapt to Extremes, but Prepare for the Presentation

For a first reaction to the new Intergovernmental Panel on Climate Change special report, Special Report on Managing the Risks of Extreme Events and Disasters to Advance Climate Change Adaptation, read William Hooke’s full post here, but keep in mind his take away message for now:

The world need not just this and the other IPCC reports themselves but also the body of diverse analysis and reaction the reports trigger. IPCC reports should and do stimulate thought and action. They don’t prescribe it.
What should you and I keep in mind as we read?
1. We should remember that the Earth does its business through extreme events and always has. Extremes are not suspensions of the normal order; they are its fulfillment.
2. Extremes leave no sphere of the natural or social or technological world unaffected and the disruptions in all those normally distinct spheres intereact with each other, compounding the challenge.
3. Social change matters more to what extreme events and disasters portend for our future than does climate change. .
4. We’ve got to get past reacting to the crisis of the moment

This will be good preparation not only for reading the full report when it’s available online in February 2012 (the summary is now available here) but also for discussions with Roger Pulwarty and colleagues when the present the reports findings on the first day of the upcoming AMS Annual Meeting in New Orleans (23 January, 11:30 a.m., Room 243). If you’re interested in hearing from the report authors now, check out the video from Friday’s press conference:

Weather and Climate Services Protecting Public Health: Get Your Questions Answered

by Viviane Silva, Co-Chair, Third Conference on Environment and Health
To address the needs related to reducing climate-weather-water related public health risks, we’ve organized a panel session entitled “Integration of Climate-Weather-Water and Health Information: Strengthening Partnerships and Enhancing Services” during the Third Conference on Environment and Health at the AMS 2012 in New Orleans (Monday 23 January, 4 p.m., Room 333).  Taking part in the discussion will be a distinguished group of experts, including: Dr. Jack Hayes, director of the National Weather Service; Dr. Christopher Portier, director of the National Center for Environmental and Health for Toxic Substances and Disease Registry – CDC; Dr. John Balbus, senior advisor for Public Health, National Institute of Environmental Health Sciences – NIH; and Dr. John Haynes, NASA, Health  and Air Quality Applications Program Manager.  This is your chance to participate as well.
The topics will include research and data needs, opportunities for shared efforts, and emerging services to support decision makers in the health community. The presenters plan to focus on

  • the changing landscape of society’s need for integrated information to enhance decision making and each agency contribution to this regarding climate, weather, and water information to predict, prevent, or manage public health risks;
  • how CDC, NIH, NOAA, and NASA will work collaboratively with other agencies to  address national, state, local, and tribal needs;
  • how these agencies will support open exchange of data and delivery of information and decision tools; and
  • current efforts to facilitate research and development of services.

The presentations are designed to foster a conversation with the audience. Some of the questions the presenters plan to ask are: What integrated weather/water/climate/health information do you need? What challenges do you face when trying to access data that you need? What would you envision being included in a related Decision Support System or Health Early Warning System? Considering the current fiscal environment, what integrated information would you consider to be the highest priority?
We’re looking for more questions from you.  Post your questions as comments to this entry on The Front Page and we’ll make sure
they will be answered during the panel discussion.

Jack Townsend, Shepherd of Weather Satellite Technology

The passing of AMS Fellow John W. (“Jack”) Townsend on October 29 serves as a fitting moment to register the evolving national relationship with space technology over six decades.

“Jack Townsend was truly one of the seminal figures in the history of NASA, and certainly, in the history of Goddard,” said current Goddard Spaceflight Institute Director Rob Strain. “The story of the space program simply could not be written without a chapter devoted to him. He dedicated his life to the exploration of space and the study of our planet, and humankind is richer for the knowledge he helped generate.”

Townsend was one of the first employees at Goddard in 1959, where he directed the satellite applications efforts, at a time when the nation was racing to enter the Space Age. He had already cut his teeth on space technology, first in radar countermeasures aboard B-29 bombers in World War II and, by 1949, working with V-2 rockets. Townsend helped bring satellite meteorology to fruition in the 1960s as Deputy Administrator of the Environmental Science Services Administrator (predecessor to today’s NOAA). After a decade at Fairchild Industries, he returned to NASA after the Challenger disaster, and then for three years as Director of Goddard.

Townsend retold the story of the origins of weather satellites just a year ago in an interview with archivist/historian Doria Grimes:

[E]verything started with sounding rockets just after World War II. I went to work for the Naval Research Laboratory (NRL) following my graduate degree in physics. The sounding rocket program had just started at NRL and it involved the Army, Navy, and Air Force…. Interestingly enough, at White Sands, New Mexico, we flew rockets out over the desert in the late 1940’s. We put cameras on them called gun sight aiming point cameras, “GSAPs”. The idea of the camera was that as the rocket went up and rotated, it took pictures of the earth in swaths. You would use those pictures to reconstruct the attitude of the rocket.

One day we had a shot in New Mexico in which we caught what looked like a storm in pictures off to the southeast. One of the guys who worked for me, Otto Berg, made a composite picture of nearly 1,000 tiny GSAP pictures, a total mosaic of a storm. It looked exactly like a hurricane, and attracted the Weather Bureau’s attention. It was in the early 50’s – all before Sputnik.

The pictures stirred interest from Harry Wexler at the Weather Bureau, and eventually a classified Army satellite project was moved into the new NASA, gradually became declassified, leading to the first weather satellite, TIROS. It was during this period that Townsend and other American science administrators were involved with negotiating peaceful uses of space technology with their Soviet counterparts.

The subject came up of transferring data. We, at that time, expected to launch the research meteorological satellites. They promised they were going to launch meteorological rockets and satellites. Incidentally, they never did. But they wanted the transferred data because Russian ground data was very sparse, and these data meant a lot to them as a country. With the free transfer of meteorological data and satellite pictures, we had an issue, a big issue. Who pays for the communication expenses between Washington and Moscow? We got into a big fight about that, and the agreement had been to share. The Russians said that since the U.S. owns all these communications facilities, the U.S. should pay for 90% of it. Then the Russians said that the ruble was not worth as much money as the dollar. Finally, I came up with one of the only brilliant ideas I ever came up with. I said sharing means 50/50. We’ll pay the bill for three months, and you pay it for three months….So I cut this deal with the Russians on how to pay for it. [His Russian negotiating counterpart] Blagonravov thought it was funny. He laughed, and said to me, “I am glad I am too old to send to Siberia.” He was a lieutenant general which is a five star rank in those days, and he also was a communist and believed in the system. He was a neat guy and I got to like him.

The whole interview (transcript here) has more on the origins of the space program, NOAA, and operationsl satellites. You’ll get the sense that the field was guided then by strong personalities and a country committed to technology. [For more on the early development of weather satellites, specifically TIROS, check out James Rodger Fleming’s presentation on “Transformative Technologies and International Cooperation in the Career of Harry Wexler” at the 2012 AMS Annual Meeting (11 a.m., Tuesday 24 January)].

Gliders Do the Wave, in the Air and in the Ocean

One would think that the time when gliders were considered cutting-edge technology for science would have long passed. Yet this durable technology remains at the forefront of research, even today.
Where daredevil pilots once pushed the boundaries of engine-less flight into the upper reaches of the troposphere to study mountain waves, now the Perian Project looks to send its pilots into the stratosphere–30,000 meters up–in the extreme reaches of mountain-perturbed winds. With a special glider that has a pressurized  cabin, organizers of the Perian Project hope to double the world’s sailplane altitude record that they set in 2006 with a different sailplane.
Elizabeth Austin of WeatherExtreme, Ltd. (of Fallbrook, California), the forecast provider for the Perian Project, will speak at the AMS Annual Meeting (Monday 23 January at 5 p.m.) about the high-altitude sailplane flights. Tests of the new, Phase 2 glider will begin in 2012 in California. Austin writes,

This two-seat sailplane is a one-of-a-kind, carbon fiber, pressurized sailplane that will utilize the polar night jet associated with the polar vortex to achieve an altitude of 90,000 feet (27.4 kilometers). The phase two glider has a wing span of 84 feet and will weigh 1,800 pounds loaded with two pilots and equipment. The windows are polycarbonate and do not get brittle at low temperatures. A special drogue chute is being designed that will not degrade rapidly with high levels of ozone exposure.

While piloted sailplanes are basically an extension of the daredevil mountain-wave research that’s been going on since before World War II, robotic devices have also recently been extending the art of research gliding far into the oceans.
You may remember that the cover of the August issue of BAMS featured an underwater glider as part of the article on the Alaska Ocean Observing System. At the upcoming Annual Meeting will be several oceanographic presentations involving the use of ocean gliders–for example here for P. Chu and C.W. Fan on thermocline measurements (Monday, 11:30 a.m.) and here for Phelps et al. on conditions for Arctic ice concentrations (Tuesday, 9:45 a.m. poster session).
Thanks to an open-source contest by Liquid Robotics, Inc., you don’t have to wait for the Annual Meeting to find out what it’s like to use the latest robotic gliders in oceanographic and meteorological observing. As a demonstration of robotic gliders powered by wave action, the Sunnyvale, California, company is launching four of its remote controlled craft in San Francisco on 17 November. Their goal: to cross the Pacific Ocean while collecting a variety of oceanic and atmospheric parameters.
The company is calling this record-breaking robotic the PacX Challenge and it involves a prize for the scientist–that could be you!–who comes up with the best use of the data streaming back from the robots as they make their way westward and, hopefully, avoid sharkbite (which has happened to one of the company’s gliders in the past).
The gliders (featured in today’s New York Times), only move at about one knot or so, and will split into pairs in Hawaii. In about 300 days, one pair is expected to reach Japan; the other pair, Australia.

While at sea, the Wave Gliders will be routed across regions never before remotely surveyed and will continuously transmit valuable data on salinity and water temperature, waves, weather, fluorescence, and dissolved oxygen. This data will be made available in near real-time to all registered individuals.
Oceanographic organizations already planning to use the data gathered during the Pacific crossing include Scripps Institution of Oceanography, Woods Hole Oceanographic Institution, and the Monterey Naval Post Graduate School.

If you submit an abstract by 23 April 2012, you can design a scientific mission for the gliders and hope for this:

The grand prize winner will receive six months of free Wave Glider data services and will work with Liquid Robotics to chart the course and mission for the six month deployment, including configuration of onboard sensors.

Not a bad way to let robots do the work for you.