Research Spotlight: T-REX and the Quest for Sustainable Almonds

USDA photo of an almond orchard in Livingston, CA. Photo by Lance Cheung.

A meteorological field project is partnering with orchards to reduce water use in California’s dry climate

California is one of the world’s key agricultural regions. However, the highly variable “boom-and-bust” rainfall pattern of its Mediterranean climate, combined with massive overuse of groundwater regionally, threatens both the state’s farmers and the population’s drinking water. Irrigation accounts for nearly 70% of groundwater withdrawals in the state.

The Tree-Crop Remote Sensing of Evapotranspiration Experiment (T-REX) aims to help farmers monitor and sustainably reduce water use in California, with lessons for farmers in Mediterranean climate regions around the world. You can read about the project in this BAMS paper.

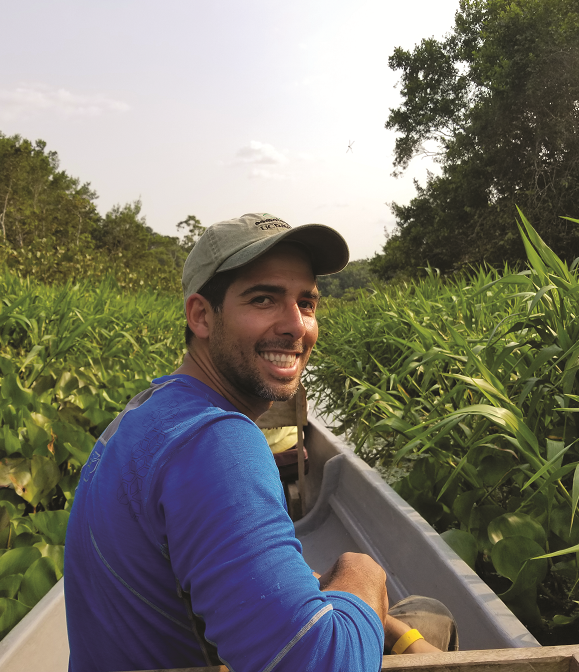
We spoke with Nicholas (Nico) Bambach, PhD, T-REX project co-lead, to find out more.

Bambach canoeing in the Amazon. Photo courtesy of Nico Bambach.>>

Nico Bambach canoeing

What are the aims of T-REX?

Mediterranean climate regions, such as Chile’s Central Valley and California’s San Joaquin Valley, are only about 3% of the Earth’s land surface [yet] are notable for their high biodiversity and productive agriculture. Most crops grown in this climate rely on irrigation to satisfy spring and summer crop water demands.

Alarming warming trends and unprecedented droughts have challenged farmers in Spain, Portugal, Italy, Australia, South Africa, and Chile since I started college in the mid-2000s. As an Agricultural Engineering student, I kept hearing about the need to increase irrigation efficiencies and better manage water resources. … Near two decades later, I found my place within a diverse team, tackling questions related to these themes. [We are] using holistic and interdisciplinary research approaches … to identify how we can help and work with stakeholders interested in using new technologies to become more efficient with their water use.

How did the project begin, and how does it work?

With strong support from Bill Kustas, Martha Anderson, and Andrew McElrone, Kyle Knipper and I grew the T-REX project from our postdoctoral work on a similar UC Davis project focused on vineyards—GRAPEX, the Grape Remote Sensing Atmospheric Profile and Evapotranspiration eXperiment.

GRAPEX is a hands-on research project aiming to help farmers manage vineyards using satellites, so they can reduce the amount of water needed to produce California wines. We have developed tools that use satellites and other technologies to monitor how much water vineyards are using and if the plants are under stress. To do this, we collect data from different wine-growing regions.

Up close, we measure how leaves and vines take in and release carbon and water and how much moisture is in the soil at various depths. Using special sensors on a tall tower, we can track how wind moves and how much water vapor or heat goes up or down. This helps us determine how much water plants are using, how much heat the ground is giving off, or how much carbon dioxide plants absorb. We also use planes or drones to gather information from above, covering areas as small as a few centimeters to many kilometers. Then, we work with wineries to identify the best way to provide this information for their decision-making.

The T-REX project is an expansion of GRAPEX. We use what we learned from wine grapes to apply to almonds, pistachios, and olives. … Considering the importance of the almond industry in California, we decided to focus our efforts [at the beginning] on developing accessible tools to inform irrigation decisions [for almond orchards] based on satellite observations. … We are learning more about how different environments, crop types, and agricultural management can impact the potential of these satellite-based tools.

What is it like partnering with farmers?

Working in commercial farms is challenging yet also rewarding. Every farm has its own way of operating machinery, and we must constantly adapt so that our field research team and equipment are not in their way. Summer days can be scorching, but we are doing many campaigns to ensure we understand the impact of using satellite-based irrigation recommendations at every level. We are quantifying plant stress, orchard productivity, fruit quality parameters, soil-health parameters, and many others. Our results are promising, and we are excited about that. Also, working directly with farmers gives us huge motivation; we hear the need for better tools to support sustainable farming. Growers are trying their best to run their farms not only for profit but also because they are proud of what they do and want to do it well.

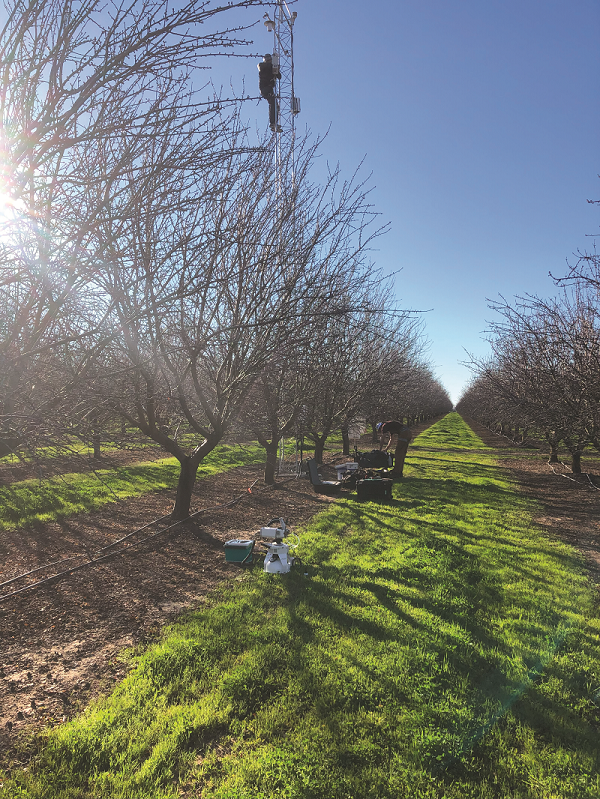
<< A researcher climbs a micrometeorological flux tower at the T-REX field site in Woodland, California. Photo courtesy of Nico Bambach.

Every crop is managed differently, and plant species respond differently to such management; finding methods to model that well can be challenging. Ecological studies usually deal with ecosystem responses to certain environmental conditions. In our case, we [also need] to understand how human decisions affect the crop and agroecosystem responses observed.

… We are evolving to better integrate our understanding of the carbon and nitrogen cycles in California’s agroecosystems. Adapting theory and tools to these landscapes is more challenging than it might seem. Yet we are excited to work with farmers on how to grow food, promote soil health, and identify potential climate mitigation opportunities.

How has the project grown, and what are your hopes for the future?

We have expanded into what we envision as a long-term regional-scale observatory of California’s agroecosystems, [becoming] the Crop Sensing Group hosted by the ARS-USDA Sustainable Agriculture Water System Unit in Davis, California. We [are] a diverse, fun, and motivated group of more than thirty people working on critical fundamental and applied research questions revolving around how to do agriculture sustainably in Mediterranean climate regions. We aim to advance our capabilities to integrate across spatial and temporal scale crop-sensing datasets for climate resilience and solutions.

Providing growers with timely and readily available access to crop water use data will help them use water more efficiently. Given how scarce water has become in California, we hope that our project releases some pressure on such a critical resource as water. We believe that will be better for the environment and our communities[—although the pathways are not always clear]. For example, such “saved water” could [be used to grow] more food instead of [becoming] available for the environment or other uses.

The T-REX project intertwines with my personal and professional growth. It is like a kid I get to co-parent with many other people I enjoy having around. It’s also “cool” to think that we are following the path that people like John Norman, Bill Kustas, Martha Anderson, and many others started. … [It] is a huge responsibility and a privilege.

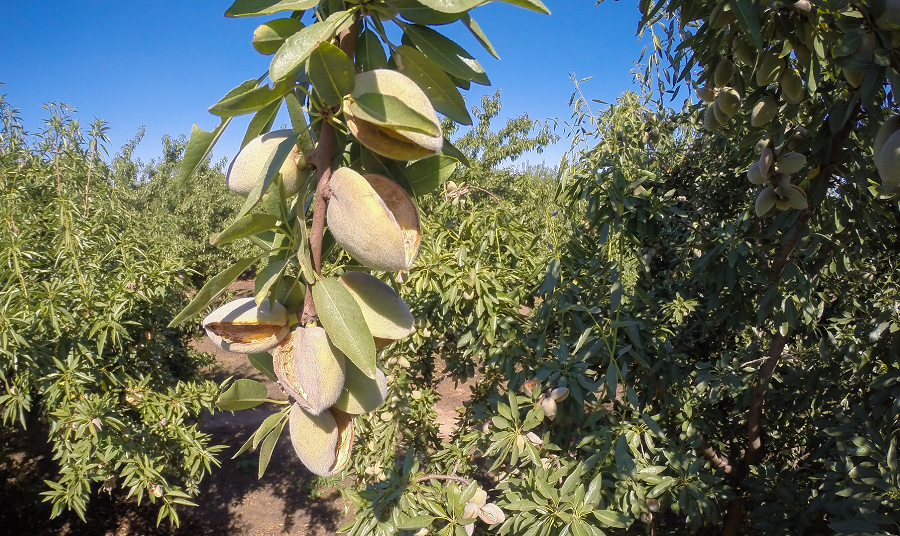
Photo at top: USDA photo of an almond orchard in Livingston, CA. Photo by Lance Cheung.

Irrigation and Storms in the Inner Mongolian Desert

Images from the DECODE project. Clockwise from top left: Microwave radiometer, wind LIDAR, researcher launching rawinsonde, eddy flux observation system, clouds forming at the boundary line, radar image of convective cells initiating along the boundary, photo of supercell storm growing from the boundary line. Photos courtesy of DECODE team.

A Research Spotlight from 32WAF/20Meso/28NWP

An irrigation oasis in Inner Mongolia, China, is providing unusual, real-world evidence about the effects of sharp vegetation contrasts on local and regional weather. Several presentations at the 32nd Conference on Weather Analysis and Forecasting, the 20th Conference on Mesoscale Processes, and the 28th Conference on Numerical Weather Prediction (32WAF/20Meso/28NWP) discussed findings from the 2022 DEsert-oasis COnvergence line and Deep convection Experiment (DECODE).

In Bayannur City, on the north side of a bend in the Yellow River, sits one of China’s largest irrigated areas: the 2,200-year-old, 769,333 hectare Hetao Irrigation District (HID), which was recognized as a World Heritage Irrigation Structure in 2019. All around this irrigation oasis is arid and semi-arid land, including the Kubuqi Desert to the south. We know that borders between land and water influence weather patterns, but there has been less real-world evidence gathered about the effects of differences in vegetation—and you can’t find a sharper divide than this one.

Image showing treeless mountains and sparsely vegetated foothills next to flat land. In the center of the photo is a dark green area of vegetation which contrasts sharply with the otherwise brown/tan landscape. A road runs to one edge of the green area. At the very right of the image, in the middle distance, is a large, wide building with a bright blue roof.
Above: Aerial view showing part of the Hetao Irrigation District and its sharp contrast with the surrounding desert areas. Video still courtesy of Yijing Liu. Below: Diagram of the juxtaposition between the boundary and its associated convective initiation (CI) and downstream propagation relative to surrounding terrain in Hetao Irrigation District. Image courtesy of Zhiyong Meng.

When cooler air from the Irrigation District meets warm wind from the desert, an atmospheric boundary line can sometimes be seen on radar. During the summer, convection often initiates at this boundary—sometimes leading to impressive storms that can travel long distances. DECODE researchers used a comprehensive set of observations—from radar and satellite to balloon sondes to flyovers—to examine this phenomenon. Their mission was to understand how the boundary forms and under what circumstances it might create unusual weather.

Different views of the boundary. Images courtesy of Zhiyong Meng.

On average, in the three months of summer each year from 2012 to 2016, 60 days produced a boundary, and 44 percent of those boundaries resulted in convective initiation (CI), noted Zhiyong Meng, of Peking University, in her July 20 presentation during Session 16 of 32WAF/20Meso/28NWP. The DECODE field experiment itself lasted 36 days in 2022, from 5 July to 9 August. With two field stations located on the oasis side, and four on the desert side, the teams were able to observe 23 boundaries and 11 occurrences of deep convection initiation, and even one case of a tornado.

Video still with green agricultural fiels and dark storm clouds in the background. A tornado funnel cloud is seen in the right side of the image. The DECODE project logo appears at the top left.
A tornado documented by the DECODE research team. It was generated by a thunderstorm formed at the boundary line. Video still courtesy of Yijing Liu.
Video still shows a bright bolt of lightning in the far left of the image. In the bottom right, a laser wind LIDAR device sits on a rooftop, pointing in the direction of the storm.
Lightning strike during the DECODE experiment. Video still courtesy of Yijing Liu.

Yipeng Huang, of Xiamen Key Laboratory of Straits Meteorology, outlined the most common conditions leading to a boundary/CI in a 21 July presentation. The researchers found that a boundary is most likely on warm summer days, when synoptic forcing is relatively weak, with dominant southerly winds opposing the oasis breeze, and a temperature over the desert that is apparently warmer than over the oasis. They found that along the boundary line between the two masses of air, convection initiation may occur when enough moist air advects north at the west edge of the subtropical high, moves out over the dry desert, and converges with a cool oasis breeze in an environment with large enough instability. Hongjun Liu of Peking University presented the mechanism for this process in a case study on 21 July.

Diagram of boundary formation and convection initiation near Hetao Irrigation District. Image courtesy of Zhiyong Meng.

Meng described “The most beautiful case, on July 29 [2022, when] the boundary produced a CI and the storm became very strong; it actually produced five-millimeter hail in the eastern part of the oasis.” They were also able to observe another storm as it split into two separate supercells. On July 25, a preexisting storm that passed over the area dissipated somewhat, likely due to sinking air over the oasis, then re-initiated strongly once it reached the boundary/convergence line over the desert. On occasion, the boundary would extend over the oasis and strongly increase the precipitation there.

Radar and photograph images of a large thunderstorm forming along the boundary line in the Kubuqi Desert on 29 July, 2022.

In the presentation immediately following Meng’s, Murong Zhang of Xiamen University noted that the team’s real-time forecasts were able to predict the formation of the boundary line in 21 out of 23 cases, although predicting convection initiation was more difficult. They were only able to predict 6 out of 11 CIs, as the numerical model tended to over-predict surface temperature, but under-predict moisture. The observations obtained from DECODE have been used to effectively improve the surface heat flux over the irrigated area, as shown in a presentation by Xuelei Wang of Peking University on the first day of the conference. You can see more from the DECODE team in this video created as part of the project:

With researchers from many institutions* participating, DECODE is an epic undertaking to study a unique natural phenomenon. As field research pioneer Prof. Edward Zipser of Utah University noted after Zhang’s talk, it’s “a program that we want to hear more about.”     

Group photo of the DECODE onsite team at one of the desert stations. Photo courtesy of Yijing Liu.

*DECODE participating organizations include Peking University, Inner Mongolia Meteorological Bureau, Nanjing University of Information Science and Technology, Xiamen Key Laboratory of Straits Meteorology, Xiamen University, Nanjing University, National Satellite Meteorological Center, Foshan Meteorological Bureau, and Jiangxi Storm Hunting Videos Culture Co., Ltd.

Featured image collage: Images from the DECODE project. Clockwise from top left: Microwave radiometer, wind LIDAR, researcher launching rawinsonde, eddy flux observation system, clouds forming at the boundary line, radar image of convective cells initiating along the boundary, photo of supercell storm growing from the boundary line. Photos courtesy of DECODE team.

About 32WAF/20Meso/28NWP

Predicting and understanding storms and other weather events is a complex business with real-world impacts. The American Meteorological Society’s 32nd Conference on Weather Analysis and Forecasting/28th Conference on Numerical Weather Prediction/20th Conference on Mesoscale Processes brought researchers, forecasters, emergency managers, and more together to learn about and discuss the latest scientific developments. The conferences took place in Madison, WI, and online 17–21 July, 2023. Recordings of the sessions are available here.

When Wars Are Hot, Crops Are Not

As if it weren’t enough to keep track of arms trafficking, political mischief, and ethnic tensions around the world, now international aid agencies and national security watchdogs are told they have to watch temperatures, too. An article last week in the Proceedings of the National Academy of Sciences links warm years in West Africa with major civil conflicts (defined to include battle deaths of at least 1,000).
The authors, led by Marshall Burke, an economist at the University of California, Berkeley,  show that temperature has a stronger relationship to internal strife than typical indicators like per capita income or type of political regime. They predict more conflict in the region as the world warms.
Other studies, noting the centrality of rain-fed agriculture in West Africa, have identified precipitation as a regional security indicator. However, the new study shows that temperature may be an even better

Read more