iPhone Game Puts Satellite Data in Your Hands

The Los Angeles Times compares it to Tetris and calls it “the nerdiest game ever“. As far as we’re concerned, that’s a sure-fire journalistic badge of honor for Satellite Insight, the new iPhone game app from NASA and NOAA.
The object of the new game is to control real-time Earth and space weather data. Colored blocks falling into columns on a grid represent small pieces of data. To save lives and protect expensive instruments, the GOES-R weather satellite must not lose any data. Players bundle like data types together before the grid overflows. Data blocks fall slowly at first, but arrive faster as the game continues. Each speed-up also brings a power-up tool you can use at any time to help clear the grid. Keep it going as long as you can and try to beat your best time. Explains NASA’s web site:

No matter how thirsty you are, it’s not easy to drink from a fire hose. But that’s similar to the challenge of capturing and storing the huge blast of images and information that the new GOES-R weather satellite will gather.

And of course, as a NASA and NOAA product, the game has an educational mission too–the instructions include information about the upcoming real-life GOES-R satellite.
Satellite Insight is available free for iPhone and other iOS devices on iTunes. Check it out here.
 

The Services Response to the Tōhoku Disaster a Focus of the 2012 AMS Meeting

The science ministry in Japan reported last week that more than 30,000 square km–eight percent of the country–is contaminated by radioactive caesium from the Fukushima nuclear plant disaster that stemmed from the Tohoku earthquake and tsunami in March. The radiation was washed out of the skies by rain and snow. As much as four-fifths of the caesium ended up in the ocean–much of it having blown northeastward toward Alaska–and currents carried it to the U.S. coastal waters within a week of reactor releases. By one week later some of the micron-sized particles had traveled around the world.
Because the geophysical dimensions of the earthquake-tsunami-meltdown last March are evident in so many ways, so are the demands it placed on scientific services–from the warnings of giant waves to forecasts of tainted precipitation and groundwater to modeling global ocean currents. Not surprisingly, the disaster literally redefined the job of the Japanese Meteorological Agency.
On the first day of full sessions at the upcoming 2012 AMS Annual Meeting in New Orleans, the epic Tōhoku cataclysm will be discussed from numerous angles, particularly the premium it put on enhanced operational response. “The earthquake and tsunami increased vulnerabilities to meteorological disasters such as sediment disasters, flood, and inundations, in the affected area, by shaking and loosening the soils and damaging the embankments and drainage facilities,” notes JMA’s Junichi Ishida.
Ishida’s presentation is the special keynote address of the Interactive Information Processing Systems (IIPS) conference (11 a.m. Monday, 23 January, Room 356). Ishida will talk about how JMA took increased vulnerabilities into account, by

  • changing criteria for heavy rain warnings to account for runoff and landslide vulnerabilties
  • lowering criteria for coastal inundation warnings (the earthquake actually lowered coastal ground levels, changing tidal configurations)
  • introduced extreme temperature warnings to account for reduced electricity capacity
  • enhanced aviation support (in particular due to traffic for relief flights) because of flight dangers including radioactive clouds

11 March Tsunami sweeps through Sendai Airport, where waters reached the second level of buildings, destroying key operations equipment, scattering mud and debris, and stranding more than a thousand people for two days. The airport eventually reopened as a hub of relief work. Photos copyright Japan Meteorological Agency, with thanks to Junichi Ishida, who will deliver the IIPS conference keynote at the 2012 AMS Annual Meeting.

At the same time (11 a.m. Monday, in Room 338) Yukio Masumoto of the Japan Agency for Marine-Earth Science and Technology will kick off a session devoted to the March 2011 disaster as part of the Coastal Environment symposium. Masumoto will speak about ocean dispersion of radioactive Caesium-137 and Iodine-131 after the Fukushima releases, including relationships with tides, surface winds and, in one case study, atmospheric fallout. In his abstract, Masumoto reports, “In the near-shore region, the wind forcing is a dominant factor that controls the flow field, while large-scale currents and eddies advect the radionuclides in the off-shore region.”
Several other Monday morning presentations in the Coastal Environment session feature rapid American responses last spring to adapt and construct viable modeling systems to depict Japan’s waterborne radiation hazards–speakers include Ronald Meris of the Defense Threat Reduction Agency, William Samuels of Science Applications International Corp (SAIC), and  Matthew Ward of Applied Science Associates.
After lunch, in the same session (2 p.m., Room 338) Gayle Sugiyama of Lawrence Livermore National Laboratory will talk about how the U.S. Department of Energy’s National Atmospheric Release Advisory Center provided analyses and predictions of the radioactive plume, estimating the exposure in both Japan and the United States. Guido Cervone of George Mason University (2:15 p.m., Room 338) will show how dispersion modeling helped reconstruct the otherwise unknown sequence of radioactive releases at the Fukushima nuclear plant. Masayuki Takigawa  (1:45 p.m., Room 338) will discuss results from regional transport modeling of the radioactivity dispersion on land and ocean, while Teddy R. Holt of the U.S. Naval Research Laboratory will show passive tracer modeling capabilities with the Fukushima events in a coupled ocean-atmosphere mesoscale modeling system (1:30 p.m., Room 338).
In a parallel session of the Coastal Environment Conference next door (1:45 p.m., Room 337) Nathan Becker of NOAA/NWS will discuss calculations of detection times for various configurations of the sensors for the Pacific tsunami warning system, concluding that, “for global tsunami hazard mitigation the installation of about 100 additional carefully-selected coastal sea-level gauges could greatly improve the speed of tsunami detection and characterization.”
Interestingly, Monday’s Space Weather posters (2:30 p.m.-4 p.m., Hall E) include a presentation by Tak Cheung of the ionospheric disruptions caused by the great Japanese earthquake last March. Forecasts of ionospheric disturbances affect yet another service in the wake of the disaster: the communications provided by shortwave radio operators. And that will be a topic for Kent Tobiska (Utah State Univ.) in the Space Weather session at 5 p.m. (Room 252/253

What Does Climate Sound Like?

Paul Miller is a musician, artist, and author better known by his performing name, DJ Spooky. His most recent project, called Terra Nova, is an artistic interpretation of climate and climate change based on both science and his own imagination. The project grew out of Spooky’s visits to both the Arctic and Antarctica, which inspired him to share his vision of climate change through music, words, and pictures. His recently released Book of Ice combines photographs, his own artwork, and commentary on the relationship between art, science, and humanity, with a focus on Antarctica.
But Spooky is best known as a musician, and he has recently toured with a small ensemble of instrumentalists to perform music that he says is intended to make people think and talk about the environment and, specifically, climate change. The pieces for Terra Nova are unique blends of science and art; in some, he uses the music to interpret scientific data (such as the long-held idea that every snowflake has unique qualities). Combining orchestral arrangements with his own electronic contributions, the music creates what Spooky calls “acoustic portraits of the landscape.” His live shows are accompanied by background images related to climate, ice, Antarctica, and similar themes; there have also been postperformance discussions of climate and environmental issues.
A snippet of the sonic portion of Terra Nova can be seen in the video below. A full presentation of his piece titled “Sinfonia Antarctica,” performed earlier this year in Savannah, Georgia, can be found here.
 

DJ Spooky’s Sinfonia Antarctica is not the first musical extravaganza with that title. The English composer Ralph Vaughan Williams reworked his score for the 1948 movie, “Scott of the Antarctic” into a sprawling, five-movement work for orchestra (including wind machine in the percussion) and called it his Symphony No. 7, “Sinfonia Antarctica.” You can listen to it here and decide what advantages Spooky had by virtue of visiting the Antarctica in person. (In 2000, after a trip to Antarctica, British composer Sir Peter Maxwell Davies wrote his 8th symphony, nicknamed “Antarctic”; like DJ Spooky’s music, the Maxwell Davies symphony is more an abstract depiction of the loneliness and desolation of an icy expanse than the lush, dramatic Vaughan Williams symphony.)
There’s a long history of music depicting climate and specific atmospheric phenomena. Karen Aplin and Paul Williams made a methodical study of some famous classical orchestral works depicting weather and climate (including Vaughan Williams’ “Sinfonia Antartica”) in the November issue of Weather magazine (published by the Royal Meteorological Society in the U.K.). A press release about the article says that British composers are “twice as likely to have written music about climate themes” than composers from elsewhere. However, a closer examination of the article shows a limited sample size precludes such conclusions. What is interesting, though, is that Aplin and Williams take a highly analytic approach to the topic, which might eventually lead to interesting conclusions about musical methods (instrumentation, keys, etc.) or relations between composers’ nationalities and the type of weather that interests them.
Meanwhile, music has moved in radically different directions than, say, Vivaldi’s violin concerti about “The Four Seasons.” The technology and world-awareness exploited by DJ Spooky and his musical/video performance concoctions are just one avenue. For example, composer Nathalie Miebach, has lately been turning actual meteorological data into sound–and sculpture made of woven reeds. She recently took numerical observations–temperature, humidity, pressure, and so forth from 2007’s Hurricane Noel and charted them graphically, then translated the chart into musical notation.  The sculpture then depicts the charts three dimensionally. Miebach says:

I think there are a lot of us out there who need the kinesthetic, who need the touch to understand something. By bringing the complexity of meteorology back into the physical space, either through touch or through sound, I’m trying to find alternative venues or access points into that complexity….I am getting more interested in using data as a literary tool, to tell a story

Just as technology has allowed us to experience and visualize the atmosphere, so too it has allowed us to see–and hear–it differently.


Another Way to Work the Night Shift in Meteorology

Meteorologist A.J. Jain dispenses a lot of good advice for young professionals on his blog, Fresh AJ. But in a post last week he aimed his thoughts to employers, giving them a tip on how to keep their forecasting talent from drifting away from the rigors of shift work.
Turns out that Jain finds the demands of job, family, and health wearing him down when he’s working through the night four days and then trying to reset his body clock for the other three.

I know there are many meteorologists out there that currently feel the same way I did.  Tired, groggy, and just wish there was another solution.    Well I want to introduce you to a new model that is being successfully run at a top aviation weather company on the west coast (I won’t name names…but I am a huge fan!).
The company allows their meteorologists to work from home.  Yes…home.   Yes you can sit in your pajamas all day or night and work from the goodness of your laptop.   How awesome is that!
And you know what is amazing…the turnover of the meteorology department at the aviation company has dropped considerably.  The employees are much happier…and the product they put out is just as great…if not better. And they’re still doing shift work!

Read the rest of his points about how telecommuting can be a successful strategy for meteorological shift work.

IPCC's New Special Report: Adapt to Extremes, but Prepare for the Presentation

For a first reaction to the new Intergovernmental Panel on Climate Change special report, Special Report on Managing the Risks of Extreme Events and Disasters to Advance Climate Change Adaptation, read William Hooke’s full post here, but keep in mind his take away message for now:

The world need not just this and the other IPCC reports themselves but also the body of diverse analysis and reaction the reports trigger. IPCC reports should and do stimulate thought and action. They don’t prescribe it.
What should you and I keep in mind as we read?
1. We should remember that the Earth does its business through extreme events and always has. Extremes are not suspensions of the normal order; they are its fulfillment.
2. Extremes leave no sphere of the natural or social or technological world unaffected and the disruptions in all those normally distinct spheres intereact with each other, compounding the challenge.
3. Social change matters more to what extreme events and disasters portend for our future than does climate change. .
4. We’ve got to get past reacting to the crisis of the moment

This will be good preparation not only for reading the full report when it’s available online in February 2012 (the summary is now available here) but also for discussions with Roger Pulwarty and colleagues when the present the reports findings on the first day of the upcoming AMS Annual Meeting in New Orleans (23 January, 11:30 a.m., Room 243). If you’re interested in hearing from the report authors now, check out the video from Friday’s press conference:

Weather and Climate Services Protecting Public Health: Get Your Questions Answered

by Viviane Silva, Co-Chair, Third Conference on Environment and Health
To address the needs related to reducing climate-weather-water related public health risks, we’ve organized a panel session entitled “Integration of Climate-Weather-Water and Health Information: Strengthening Partnerships and Enhancing Services” during the Third Conference on Environment and Health at the AMS 2012 in New Orleans (Monday 23 January, 4 p.m., Room 333).  Taking part in the discussion will be a distinguished group of experts, including: Dr. Jack Hayes, director of the National Weather Service; Dr. Christopher Portier, director of the National Center for Environmental and Health for Toxic Substances and Disease Registry – CDC; Dr. John Balbus, senior advisor for Public Health, National Institute of Environmental Health Sciences – NIH; and Dr. John Haynes, NASA, Health  and Air Quality Applications Program Manager.  This is your chance to participate as well.
The topics will include research and data needs, opportunities for shared efforts, and emerging services to support decision makers in the health community. The presenters plan to focus on

  • the changing landscape of society’s need for integrated information to enhance decision making and each agency contribution to this regarding climate, weather, and water information to predict, prevent, or manage public health risks;
  • how CDC, NIH, NOAA, and NASA will work collaboratively with other agencies to  address national, state, local, and tribal needs;
  • how these agencies will support open exchange of data and delivery of information and decision tools; and
  • current efforts to facilitate research and development of services.

The presentations are designed to foster a conversation with the audience. Some of the questions the presenters plan to ask are: What integrated weather/water/climate/health information do you need? What challenges do you face when trying to access data that you need? What would you envision being included in a related Decision Support System or Health Early Warning System? Considering the current fiscal environment, what integrated information would you consider to be the highest priority?
We’re looking for more questions from you.  Post your questions as comments to this entry on The Front Page and we’ll make sure
they will be answered during the panel discussion.

A Summer Spent Studying Disagreements

Washington State University just published a profile of Rodrigo Gonzalez, a graduate student in the Laboratory for Atmospheric Research (LAR) who spent his summer interning for the AMS Policy Program:
“It’s not in my character to be in a lab doing research and publishing articles that are only useful for other scientists,” Gonzalez said. “I want to see the broader impacts. I like to see that what I do has an impact on the development of society.”…
Gonzalez has been long interested in politics. He studied environmental engineering in Mexico City as an undergraduate and participated in modeling studies of air pollution in that city.
During his summer in D.C., Gonzalez worked for the American Meteorological Society’s policy program, which helps congressional staffers develop science-based policy. It also connects scientists and policy makers. The idea is to help each other and give each other information, Gonzalez said.
There often has been a gap between scientists and policy makers, he said: “It’s very hard to communicate science to make effective policy.” The AMS policy program tries to cover that gap.
In 2009, the program made policy recommendations based on the professional and scientific expertise and perspectives of the AMS about a climate change legislative proposal. The legislation passed in the House of Representatives but never made it through the Senate to become law.
Part of Gonzalez’s work was interviewing the different actors on this legislation as well as experts and advocates surrounding the proposal. What were the electoral implications of the proposal? Why did it pass the House and not the Senate? Who and what gives momentum to the legislation?
“It is not necessarily the science or engineering that gives legislation its momentum,” he said….
Trying to get science into the public policy discussion can be frustrating, Gonzalez said. But it was more frustrating before he became involved.
“Now I understand how it works and what is involved,” he said. “It’s natural and necessary for humans to disagree. The source of policy making is disagreement. As frustrating as that can be, there is no better way.”
Gonzalez is working to complete a Ph.D. in air quality modeling. Since returning from his summer internship, he is pursuing his final year in the interdisciplinary Ph.D. program in engineering sciences.
He would like to travel and eventually return to Mexico to help his country with its air pollution problems. Spending the summer in D.C….helped [Gonzalez] learn how to better communicate the science that he studies.
“It’s a different world away from the lab,” he said. “This has really made me a better professional.”
For the full article, by Tina Hilding, click here.

The Great Blue Norther of 11/11/11

For the 100th Anniversary of one of most noteworthy storms in the history of the Midwest, University of Missouri atmospheric science students Brian Crow, Evan Kutta, and Jennifer Power spent hours digging through historical records. They were trying to document the progress of the Great Blue Norther of 11 November 1911, tracking the situation through old newspaper articles and other documents. What they found showed how devastating weather can be when people have no warning, as a beautiful, sunny and warm fall day quickly turned into a deadly winter blast including tornadoes and derechoes.
Using the information about the impact of the storm, along weather data and reanalyses, UM Associate Professor Patrick Market reconstructed the storm and found a relatively close modern analog–29 January 2008. That storm had a slower but similar temperature drop (from 70°F to 15°F) and a similarly intense cold front.
Check out the  interactive map the students created that tracks the events of that fateful day 100 years ago

View 11/11/1911 in a larger map
 

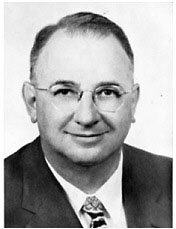
Jack Townsend, Shepherd of Weather Satellite Technology

The passing of AMS Fellow John W. (“Jack”) Townsend on October 29 serves as a fitting moment to register the evolving national relationship with space technology over six decades.

“Jack Townsend was truly one of the seminal figures in the history of NASA, and certainly, in the history of Goddard,” said current Goddard Spaceflight Institute Director Rob Strain. “The story of the space program simply could not be written without a chapter devoted to him. He dedicated his life to the exploration of space and the study of our planet, and humankind is richer for the knowledge he helped generate.”

Townsend was one of the first employees at Goddard in 1959, where he directed the satellite applications efforts, at a time when the nation was racing to enter the Space Age. He had already cut his teeth on space technology, first in radar countermeasures aboard B-29 bombers in World War II and, by 1949, working with V-2 rockets. Townsend helped bring satellite meteorology to fruition in the 1960s as Deputy Administrator of the Environmental Science Services Administrator (predecessor to today’s NOAA). After a decade at Fairchild Industries, he returned to NASA after the Challenger disaster, and then for three years as Director of Goddard.

Townsend retold the story of the origins of weather satellites just a year ago in an interview with archivist/historian Doria Grimes:

[E]verything started with sounding rockets just after World War II. I went to work for the Naval Research Laboratory (NRL) following my graduate degree in physics. The sounding rocket program had just started at NRL and it involved the Army, Navy, and Air Force…. Interestingly enough, at White Sands, New Mexico, we flew rockets out over the desert in the late 1940’s. We put cameras on them called gun sight aiming point cameras, “GSAPs”. The idea of the camera was that as the rocket went up and rotated, it took pictures of the earth in swaths. You would use those pictures to reconstruct the attitude of the rocket.

One day we had a shot in New Mexico in which we caught what looked like a storm in pictures off to the southeast. One of the guys who worked for me, Otto Berg, made a composite picture of nearly 1,000 tiny GSAP pictures, a total mosaic of a storm. It looked exactly like a hurricane, and attracted the Weather Bureau’s attention. It was in the early 50’s – all before Sputnik.

The pictures stirred interest from Harry Wexler at the Weather Bureau, and eventually a classified Army satellite project was moved into the new NASA, gradually became declassified, leading to the first weather satellite, TIROS. It was during this period that Townsend and other American science administrators were involved with negotiating peaceful uses of space technology with their Soviet counterparts.

The subject came up of transferring data. We, at that time, expected to launch the research meteorological satellites. They promised they were going to launch meteorological rockets and satellites. Incidentally, they never did. But they wanted the transferred data because Russian ground data was very sparse, and these data meant a lot to them as a country. With the free transfer of meteorological data and satellite pictures, we had an issue, a big issue. Who pays for the communication expenses between Washington and Moscow? We got into a big fight about that, and the agreement had been to share. The Russians said that since the U.S. owns all these communications facilities, the U.S. should pay for 90% of it. Then the Russians said that the ruble was not worth as much money as the dollar. Finally, I came up with one of the only brilliant ideas I ever came up with. I said sharing means 50/50. We’ll pay the bill for three months, and you pay it for three months….So I cut this deal with the Russians on how to pay for it. [His Russian negotiating counterpart] Blagonravov thought it was funny. He laughed, and said to me, “I am glad I am too old to send to Siberia.” He was a lieutenant general which is a five star rank in those days, and he also was a communist and believed in the system. He was a neat guy and I got to like him.

The whole interview (transcript here) has more on the origins of the space program, NOAA, and operationsl satellites. You’ll get the sense that the field was guided then by strong personalities and a country committed to technology. [For more on the early development of weather satellites, specifically TIROS, check out James Rodger Fleming’s presentation on “Transformative Technologies and International Cooperation in the Career of Harry Wexler” at the 2012 AMS Annual Meeting (11 a.m., Tuesday 24 January)].