Highlighting Key Sessions at AMS 2024
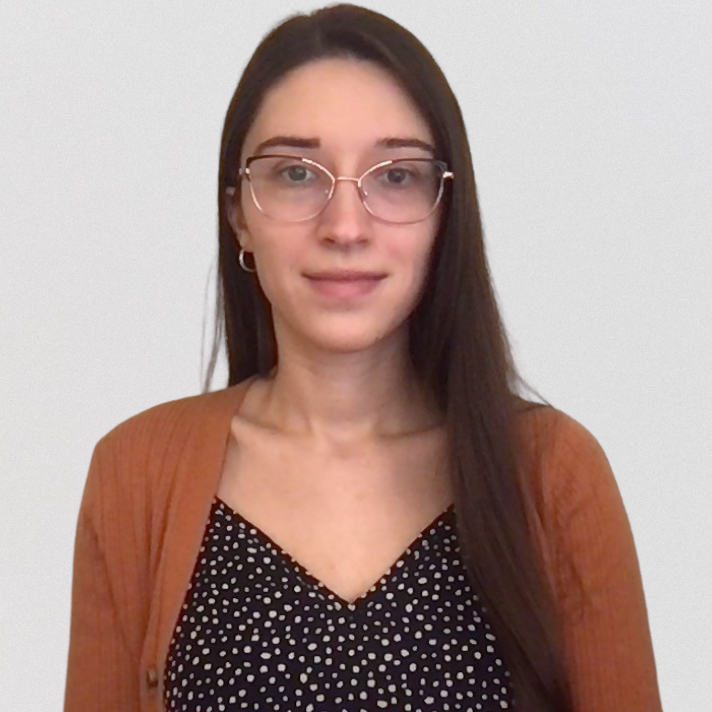
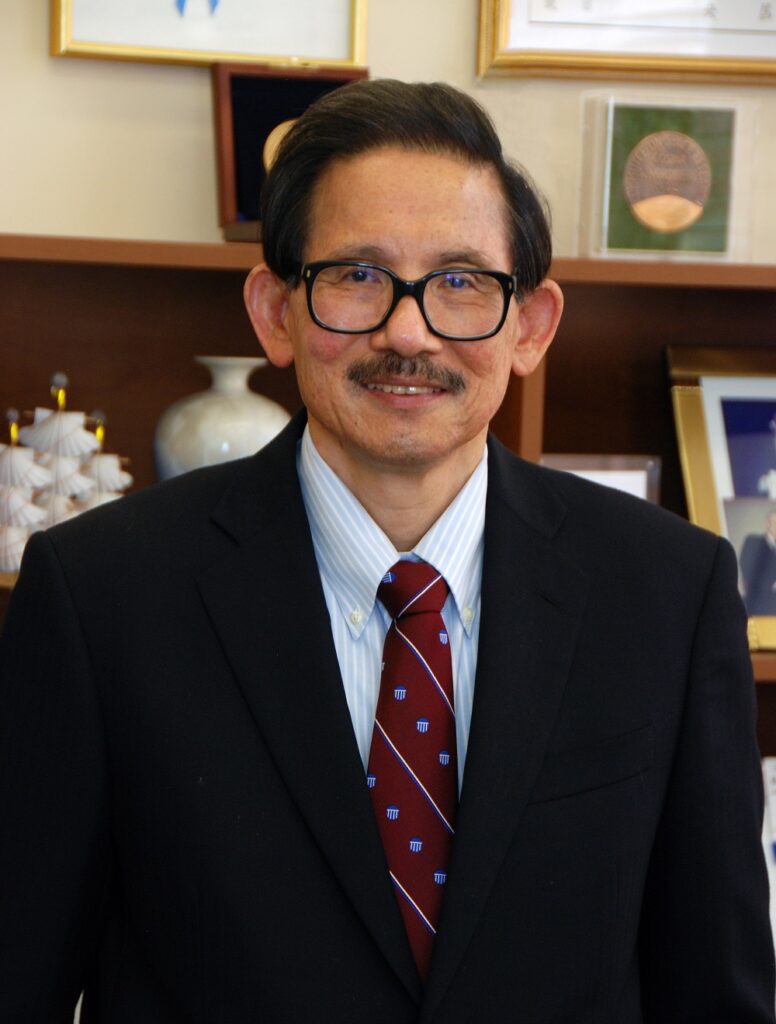
The Kuo-Nan Liou Symposium at the 104th AMS Annual Meeting will celebrate Dr. Kuo-Nan Liou (1943-2021), a giant in the field of atmospheric physics who made crucial contributions in the areas of atmospheric radiation, remote sensing, and the greenhouse impacts of clouds and aerosols. Liou (pictured at right, image courtesy of Penny Jennings), received numerous accolades during his career, including the AMS’s Carl-Gustaf Rossby Research Medal and Charney Award, and he was part of the Intergovernmental Panel on Climate Change team who received the Nobel Peace Price in 2007.
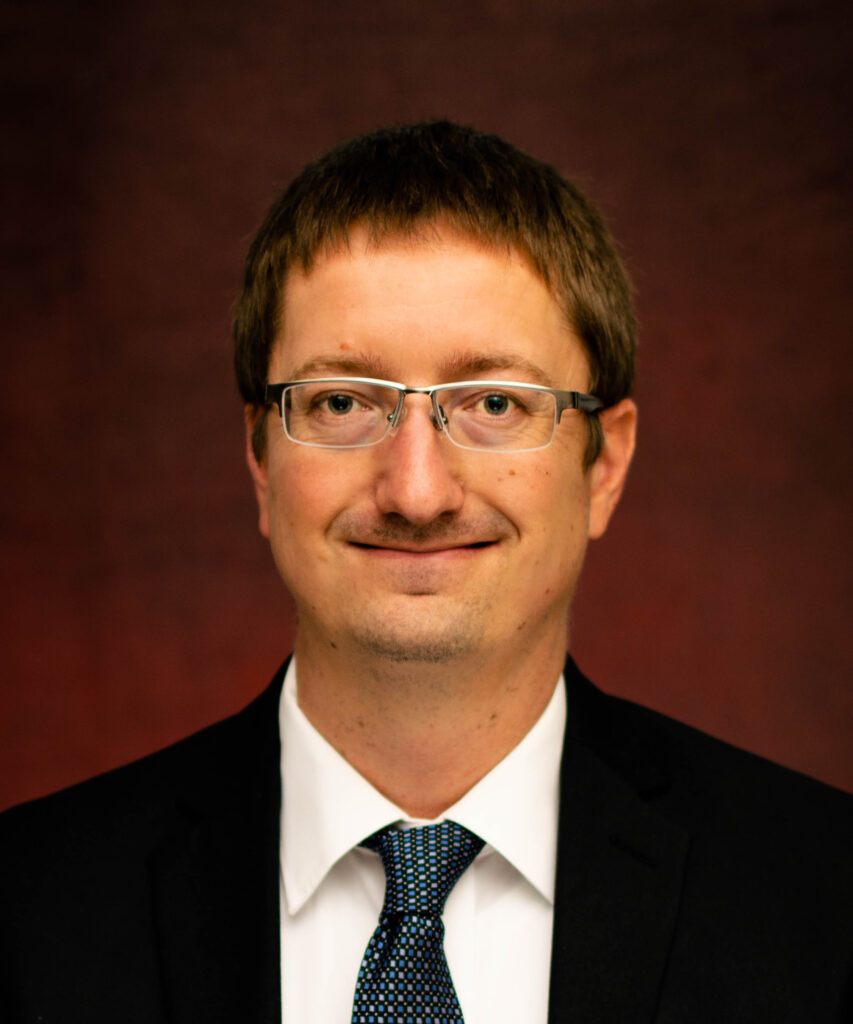
We asked Symposium Co-Chair Ping Yang, University Distinguished Professor and David Bullock Harris Chair in Geosciences at Texas A&M University, about the Symposium and Dr. Liou’s impact. Here are some of his answers:
Why are the areas of Dr. Liou’s research so important to understand right now?
As one of the most accomplished atmospheric scientists in the world, Dr. Liou made seminal contributions to atmospheric and climate sciences in many areas, particularly in atmospheric radiation. His radiative transfer model has been widely used in weather and climate models and satellite remote sensing implementations, and thus plays a central role in determining the radiation budget of the earth-atmosphere system and cloud-aerosol-radiation interactions and feedback in a changing world.
Radiative transfer is important because almost all the energy that drives the Earth’s atmosphere and ocean currents originates from the sun. Therefore, the climate of the Earth-atmosphere system is mainly determined by the radiation balance at the top of the atmosphere and the surface since radiation is the only mechanism by which the Earth-atmosphere system gains or loses energy.
What can attendees expect from the Symposium?
This symposium honors the legacy of Dr. Kuo-Nan Liou by bringing together researchers to share knowledge, foster collaborations and address current challenges in the fields where Dr. Kuo-Nan Liou left a lasting impact. Attendees, both in-person and virtual, can benefit from gaining insights into the latest research and advancements in these areas. Session topics include “Interactions Among Climate, Radiation, Clouds, Aerosols, and Surface”, “Radiative Transfer Theory & Spectroscopy,” “Remote Sensing of Clouds, Aerosols, and Surface Properties,” and “Light Scattering and Applications.” The Symposium will provide a platform for networking and engaging with experts and a forum for disseminating cutting-edge research findings.
The Symposium will delve into the forefront issues within these research areas. Noteworthy presentation topics include the lidar remote sensing of snow depth and density, sub-millimeter-wave remote sensing of ice clouds, Tibetan Plateau snowpack loss and its connection to extreme events, and more.
The first session aligns with the central focus of the 2024 AMS Annual Meeting, “Living in a Changing Environment.” It features invited speakers Drs. Ruby Leung, Dennis Hartmann, V. Ramaswamy, Zhanqing Li, Jonathan Jiang, and Yongkang Xue.
How did Dr. Liou influence the fields of atmospheric and climate science?
Dr. Liou’s work left a profound mark on the atmospheric and climate sciences due to his seminal contributions to radiative transfer, atmospheric optics, cloud-aerosol-radiation-climate interactions, and remote sensing. He was a pioneering researcher who demonstrated that atmospheric radiation should no longer be consigned to the fringes of meteorology, but instead should take a central place in the new world of climate science.
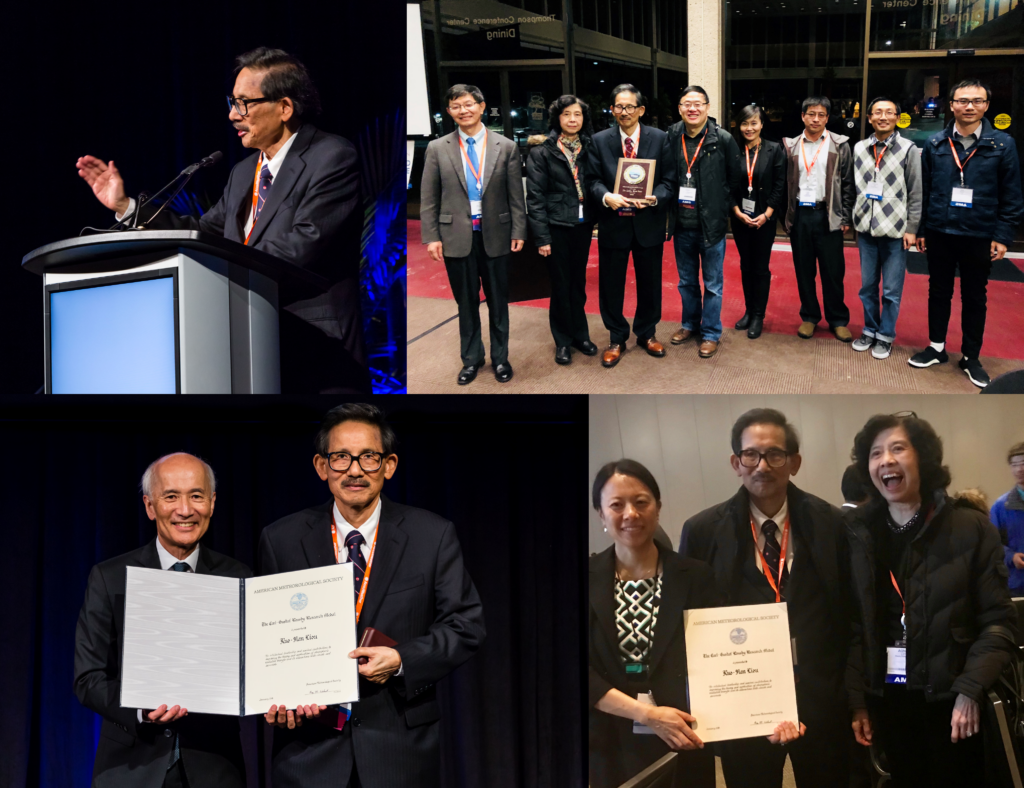
His book, “An Introduction to Atmospheric Radiation,” now in its second edition (with the first edition published in 1980), has been an invaluable resource for students and researchers around the world studying atmospheric radiation and its applications in climate science and remote sensing. Accepting the Rossby Medal in 2018, Prof. Liou talked about how his own early-career exposure to books like Chandrasekhar’s “Radiative Transfer” and Born & Wolf’s “Principles of Optics” spurred his innovations. For example, his simplified solutions for understanding solar and heat energy transfer problems, and his application of geometric optics to understand the scattering, absorption, and polarization properties of soot aerosols and irregular ice crystals.
He also humbly thanked his graduate students at the University of Utah and UCLA, saying, “They deserve to share, in equal measure, any recognition I have received, including this great honor from AMS.” We, the organizers of the Symposium, in turn are grateful to Dr. Liou. Along with his exceptional impact on the atmospheric sciences, he was a true role model as a leader and educator.
The Kuo-Nan Liou Symposium will be held Tuesday, 30 January, 2024 at the AMS 104th Annual Meeting, in Baltimore and online; it will feature invited presentations and a poster session, along with a special luncheon. Learn more about the Symposium and view the program.