by Mona Behl, Georgia Sea Grant
Guru-shishya parampara is a centuries-old tradition in India that fosters a thoughtful exchange of ideas, expertise, and friendship between a guru (teacher) and shishya (student). The relationship between a guru and a shishya is an emotional, spiritual, and intellectual friendship built on the foundation of trust, respect and commitment.
I got the opportunity to reflect on guru-shishya parampara during a panel discussion led by the AMS Board for Early Career Professionals. The session – “The Early Career Leadership Academy: Beyond Leadership to Mentorship” — aimed to reflect on the 2018 AMS Early Career Leadership Academy (ECLA), address leadership issues in the workplace and provide mentorship to students and early career individuals. Facilitated by my dear friend and colleague, Brad Johnson, the panel discussion featured Chris Vagasky from Vaisala, Kimberly Wood from Mississippi State University, and Alan Sealls from WKRG-TV. Brad, Chris, and Kim are all alumni of the inaugural class of 2018 AMS ECLA. What follows is a brief summary of what I learned from the panel discussion, and I hope it encourages you to consider applying for the 2019 AMS ECLA–the deadline is coming up fast.
Mentorship is friendship. Over time, this relationship develops organically. You may not realize the role that mentors have played in your life until several years later, when you reflect on your experiences and think about the people who have guided you, supported you, and rooted for you, all along.
Mentors come into our lives in various relationships. Some mentors are individuals who are more experienced and have more knowledge than you. Others are colleagues who may be at the same career stage as you. Parents, teachers, siblings, and even friends could all be mentors. Sometimes mentorship can be established in a structured manner. It needn’t be sought only from individuals who enjoy a high-profile career or are well established. Everybody has something valuable to offer. At any stage of your career, you are both a mentor and mentee.
Communication is the key to a good mentoring relationship. Assessing the effectiveness and impact of communication in a mentorship is equally important. An effective mentor gives wise counsel, and the mentee feels comfortable speaking on issues that may be sensitive. Shared vulnerability between two individuals nurtures trust and builds honest mentoring relationships. However, being vulnerable also means taking a risk of harm, which you need to acknowledge and understand. You also need to know when to walk away from that relationship.
Mentoring is a skill that can be developed over time through practice, participation, and partnership. Many individuals who wish to be mentors are confronted with imposter syndrome. Overcoming the imposter syndrome might entail developing a network of peers and colleagues who are able to provide validation, guidance, and support, when needed. If you feel like an imposter, chances are that others in your situation feel the same way.
It is also important to acknowledge the benefits of being a novice in mentorship and recognize opportunities presented by failure. Confronting failure and acknowledging that you don’t know everything isn’t proof that you are worthless. It is an opportunity to grow. Cultivating a mindset of learning instead of performance allows you to view your limitations as growth opportunities thereby catalyzing self-improvement. Extending opportunities to others so that they too can learn and grow builds confidence and generates greater benefits for society.
Mentorship is a doorway to complete transformation for both the guru and shishya. Done right, mentoring can benefit both: you get a chance to share your experiences, learn about challenges and opportunities that you aren’t aware of, and uncover ways of doing things differently.
ECLA is designed to be a transformative peer-to-peer mentoring experience for early career leaders in weather, water, and climate science professions. As a result of the Academy, ECLA alumni have been able to take calculated risks in their lives, connect with colleagues in similar career phases, and acquire affective skills that are usually not taught in traditional academic setting. Most importantly, ECLA participants have been able to build deep and meaningful relationships with a diverse group of peers who support and advocate for one another, lead their organizations through uncertain times, and inspire change.
Mentoring changed my life for the better and I sincerely wish that it transforms your life too. Please consider applying for the a place in the next AMS Early Leadership Academy. The application deadline is 8 March 2019; the Academy, including regular webinars, begins in April and leads to a meeting at Stone Mountain, Georgia, on 24-26 July. From there, the program continues onward with guru-shishya parampara.
GOES-16/17 Virtual Science Fair Seeking Entries From Students
by Margaret Mooney, CIMSS
NOAA’s Cooperative Institute for Meteorological Satellite Studies (CIMSS) in Madison Wisconsin is pleased to announce a virtual science fair for students from grades 6-14 applying GOES-16 or GOES-17 data to investigate weather scenarios and natural hazards.
‘Pleased’ is probably too mild of a word to describe our enthusiasm around this project. Madison is after all, the birthplace of satellite meteorology and CIMSS founder Verner Suomi is widely known as the “Father of Satellite Meteorology.” Recent launches of the GOES-R, NOAA-20 and GOES-S satellites have made our building a very exciting to place to work! Our goal, and motivation, is to share our passion for GOES-R series data as broadly as possible.
One way to reach students is through the spring 2019 virtual science fair, part of “The GOES-R Education Proving Ground” at CIMSS. A key element of this effort, from the get-go, has been a core group of educators working with CIMSS in close coordination NOAA scientists.
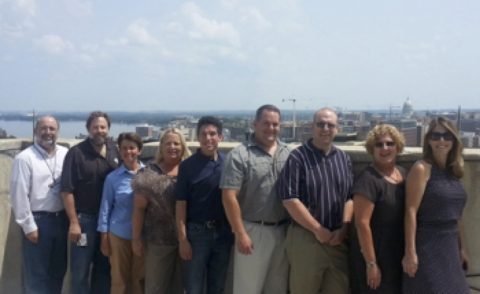
Above: The original GOES-R Education Proving Ground Team from 2014 – from left to right: John Moore, Tim Schmit (NOAA), Margaret Mooney (CIMSS), Vicky Gorman, Peter Dorofy, Craig Phillips, Brian Whittun, Amy Monahan, and Charlotte Besse.
Most of the original teachers have rotated out of the core group. And sadly, Charlotte Besse, a Florida teacher, has since died of cancer – but not before attending the 2016 GOES-R launch with her family in tow!
A major perk for winners of the GOES-16/17 Virtual Science Fair will be official GOES-T launch invites. Students will also receive $25 gift cards. Teachers coaching the winning teams will garner launch invites (no travel support) and conference travel support to attend and present at the 2020 American Meteorological Society (AMS) Centennial meeting in Boston.
There will be three winning teams: middle school, high school and grades 13/14 (community college or university). GOES-R Educators from five different states will judge the science fair entries. We will be accepting entries between March 1st through May 3rd, 2019. Guidelines, scoring rubrics and other supporting resources are all on-line at http://cimss.ssec.wisc.edu/education/goesr/vsf.
Please share with your favorite educator!
Flying the Fastest Skies
How fast can an airliner go? Monday night a Virgin Atlantic Boeing 787-9 reached 801 m.p.h. en route from Los Angeles to London. Matthew Cappucci of the Washington Post reported the jet reached this amazing speed—a record for the Boeing 787-9 and probably the highest speed for a non-supersonic commercial flight—while cruising at 35,000 feet over the central Pennsylvania.
Clearly the plane was hurled along by an intense jet streak; Cappucci showed a sounding at 250 mb—a level nearly as high as the plane—that night over Long Island: the jet stream was moving at 231 m.p.h. This is what pushed the aircraft more than 200 m.p.h. beyond its top airspeed. (The plane’s record speed was relative to the ground, not the swiftly moving air around it.) The Post article states that the sounding “sets the record for the fastest 250-millibar wind speed ever recorded over New York and, probably, the country.”
This raises the other question of speed: just how fast can a jet stream go? It turns out the question is not so easy to answer. To find out, we e-mailed an experienced weather records sleuth, Arizona State University’s Randy Cerveny, who is the World Meteorological Organization’s rapporteur of weather and climate extremes. Cerveny replied,
I had set up a WMO committee this past summer to look into that very question—the strongest tropospheric winds (and so the strongest winds recorded on the planet). As we started to look at the data, we found that by far the strongest tropospheric winds are found east of Japan in the Pacific and normally occur right at this time of the year. They are associated with the normal area when polar and subtropical jets merge. The second area of max tropospheric winds are over New Hampshire and has the same thing happen—polar and subtropical jets merge. BUT unfortunately we ran into serious problems with the quality of extreme tropospheric wind measurements. My experts say that right now the quality of the data for those upper air extreme winds is not good enough to support an investigation for global fastest tropospheric winds. So we are not investigating that record until (and if) NCEI and other groups can establish a viable record for an extreme. We have seen data (again, not good to accept) that has winds in excess of 133 m/s or 297 miles per hour. It is likely that some of those values ARE good but we are still quality-controlling the radiosonde extreme dataset.
With that in mind, we dug into the AMS journals archive and found a February 1955 Journal of Meteorology article by Herbert Riehl, F. A. Berry, and H. Maynard detailing research flights into the jet stream over the Mid-Atlantic states. They record one case of a 240-knot jet stream (276 m.p.h.) and another of 210 knots (241 m.p.h.), each representing averages over 28 miles of flight path.
These can’t be counted as definitive—Riehl et al. emphasized the difficulties of their measurement process. And Cerveny emphasizes that, “No measurement that we have seen at extreme values has been judged of sufficient quality to warrant a full evaluation at this time.”
So for now, just sit back and enjoy the flight.
New Western Storms Scale to Describe Intensity, Potential Impacts of Atmospheric Rivers
Hurricanes are classified by the Saffir-Simpson Scale and tornadoes by the Enhanced Fujita Scale, and now atmospheric rivers—those long, transient corridors of water vapor that fuel flooding rain events each winter in the West, especially California—will also be scaled to enhance awareness and bolster prediction.
The new AR scale ranks their intensity and potential impacts from 1 to 5 using the categories “weak,” “moderate,” “strong,” “extreme,” and “exceptional,” based on the amount of water vapor they carry and their duration. It is intended to describe the strength of ARs as beneficial to hazardous, aiding water management and flood response.
 “The scale recognizes that weak ARs are often mostly beneficial because they can enhance water supply and snow pack, while stronger ARs can become mostly hazardous, for example if they strike an area with conditions that enhance vulnerability, such as [where there are] burn scars, or already wet conditions,” says Marty Ralph and co-authors in a paper appearing in the February 2019 issue of BAMS and posted online as an early release today. “Extended durations can enhance impacts,” he says.
Ralph is director of the Center for Western Water and Weather Extremes (CW3E) at Scripps Institution of Oceanography and a leading authority on atmospheric rivers, which were officially defined by the AMS in 2017. The new scale was created in collaboration with NWS meteorologists Jonathan Rutz and Chris Smallcomb, and several other experts. It marks two decades of intensive field research that involved establishing a network of dozens and dozens of automated weather stations to observe ARs in real time and flying research planes through them as they crashed ashore and up and over the mountainous terrain of California, Oregon, and Washington.
Atmospheric rivers are the source of most of the West Coast’s heaviest rains and floods—roughly 80 percent of levee breaches in California’s Central Valley are associated with landfalling ARs. Research shows that a combination of intense water vapor transport for a long duration over a given area causes the biggest impact. But ARs also are primary contributors to the region’s water supply.
The newly created scale is designed to capture this combination, accounting for both the amount of available water and the duration it is available. It focuses on a period of 24-48 hours as its standard measurement. When an AR lasts in an area fewer than 24 hours it is demoted by one category, and if it persists more than 48 hours, it is promoted by a category. Unlike the operational hurricane scale, which has been criticized for inadequately representing the increased impacts of slower-moving, lower-end hurricanes, duration is a fundamental factor in the AR scale. It also aims to convey the benefits of ARs, not just the hazards.
“It can serve as a focal point for discussion between water managers, emergency response personnel and the research community as these key water supply and flood inducing storms continue to evolve in a changing climate,” says co-author Michael Anderson of the California Department of Water Resources.
The scale ranks ARs in five categories:
- AR Cat 1 (Weak): Primarily beneficial. For example, a February 23, 2017, AR hit California, lasted 24 hours at the coast, and produced modest rainfall.
- AR Cat 2 (Moderate): Mostly beneficial, but also somewhat hazardous. An AR on November 19-20, 2016, hit Northern California, lasted 42 hours at the coast, and produced several inches of rain that helped replenish low reservoirs after a drought.
- AR Cat 3 (Strong): Balance of beneficial and hazardous. An AR on October 14-15, 2016, lasted 36 hours at the coast, produced 5-10 inches of rain that helped refill reservoirs after a drought, but also caused some rivers to rise to just below flood stage.
- AR Cat 4 (Extreme): Mostly hazardous, but also beneficial. For example, an AR on January, 8-9, 2017, that persisted for 36 hours produced up to 14 inches of rain in the Sierra Nevada and caused at least a dozen rivers to reach flood stage.
- AR Cat 5 (Exceptional): Primarily hazardous. For example, a December 29, 1996, to January 2, 1997, AR lasted over 100 hours at the Central California coast. The associated heavy precipitation and runoff caused more than $1 billion in damages.
When AR storms are predicted for the West Coast, the scale rankings will be updated and communicated on the CW3E website and its Twitter handle.
“The launch of the AR Scale marks a significant step in the development of the concept and its application,” Ralph commented in an e-mail to the AMS, “and caused me to reflect back a bit on where it came from. All the people and organizations who’ve contributed. The scientific debate around the subject. The creation of a formal definition for the Glossary of Meteorology. The creation of a 100-station mesonet to monitor them in California. The AR Recon effort underway in a partnership between Scripps and NCEP [now NCEI], and in collaboration with the Navy, NCAR, and ECMWF, as well as others. A number of papers are already in the works using the scale, and we are hopeful that it will prove useful for the public and for officials who must deal with storms in a large area where scales for hurricanes, tornadoes and nor’easters are not very applicable.”
Making Sure No Tornado Damage Is Too Small
Planetary, synoptic, meso-alpha, meso-beta, local, and more—there are atmospheric scales aplenty discussed at AMS meetings. Enter microtopography, a once-rare word increasingly appearing in the mix in research (for example, here and here).
The word is also coming up as researchers are getting new tools to examine the interaction of tornadoes with their immediate surroundings. Microtopography looks like a potential factor in tornadic damage and in the tornadoes themselves, according to an AMS Annual Meeting presentation by Melissa Wagner (Arizona State Univ.) and Robert Doe (Univ. of Liverpool), who are working on this research with Aaron Johnson (National Weather Service) and Randy Cerveny (Arizona State Univ). Their findings relate tornado damage imagery to small changes in local topography thanks to the use of unmanned aerial systems (UASs).
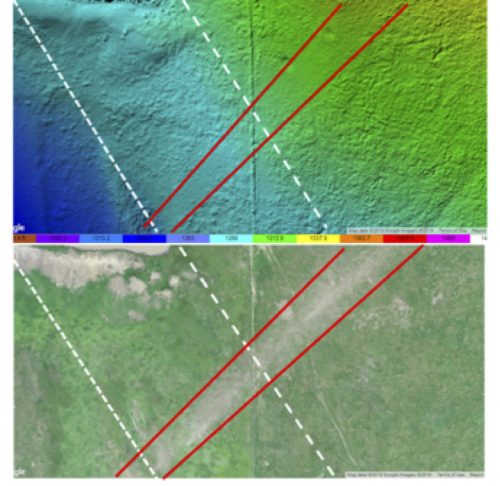
Microtopographic interactions of tornadic winds were captured in their UAS imagery. Here’s the 5-meter resolution RapidEye satellite imaging of a 30 April 2017 Canton, Texas, tornado path (panel a) versus higher-resolution UAS imaging:
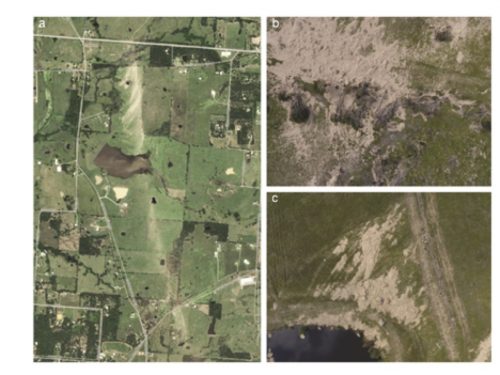
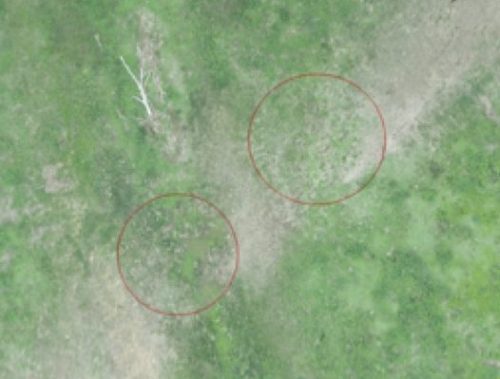
The UAS surveys show that tornadic winds interact with sunken gullies, which appear as unscarred, green breaks (circled in red) in the track of browned damaged vegetation:
Erosion and scour are limited within the depressed surfaces of the gullies compared to either side. In another section of the track, track width increases with an elevation gain of approximately 74 feet, as shown in a digital elevation model and 2.5 cm resolution UAS imagery:
The advent of unmanned aerial vehicles (UAVs) has opened new windows on tornado damage tracks. Decades ago, damage surveys took a big leap forward with airplane-based photography that provided a perspective difficult to achieve on the ground. Satellites also can provide a rapid overview but in relatively low resolution. UASs fly at 400 feet—and are still limited to line-of-sight control and the logistics of coordinating with local emergency and relief efforts, regulatory and legal limitations, not to mention still-improving battery technology.
However, UASs provide a stable, reliable aerial platform that benefits from high-resolution imaging and can discern features on the order of centimeters across. Wagner and colleagues were using three vehicles with a combined multispectral imaging capability that is especially useful in detecting changes in the health of vegetation. As a result their methods are being tested primarily in rural, often inaccessible areas of damage.
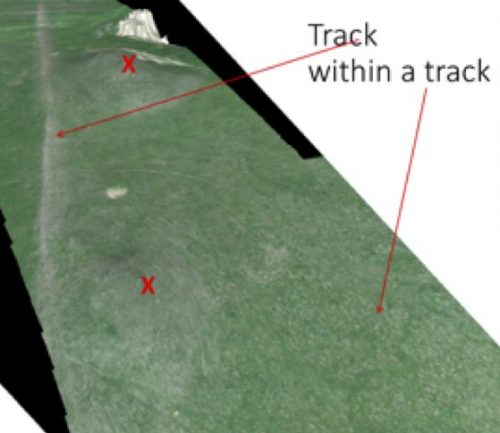
UAS technologies thus can capture evidence of multi-vortex tornadoes in undeveloped or otherwise remote, vegetated land. The image below shows a swath with enhanced surface scour over two hills (marked X). The arrow on the right identifies speckled white surface erosion, part of the main tornado wedge. Such imagery explains why, among other research purposes, Wagner and Doe are developing the use of UASs in defining tracks and refining intensity-scale estimates.
Is It Sand Or Is It Snow?: Nuggets from Today’s Poster Session
Today’s poster sessions starting at 4 p.m. will full of mysterious images. This is your opportunity to ask the researchers what the pictures are all about.
In the case of Morristown-Beard School sophomore Kim Magnotta’s poster (103) today, the question may be simply, what are pictures of sand doing at a meteorology conference?
There’s a good reason, of course, so go ahead and ask.
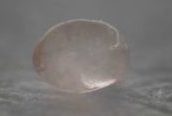
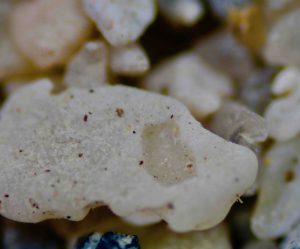
Magnotta jumped into microphotography hoping to capture images of snowflakes falling on Northern New Jersey. Starting her work during summer vacation, finding snow was difficult. Collecting samples from the Jersey Shore, she started photographing sand. It was also much easier perfecting her technique using subjects that did not melt. The first example shown above is primarily quartz and feldspar from Sandy Hook, NJ, including several uniquely large grains.
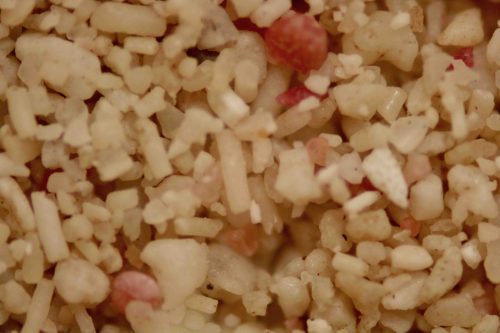
Focusing on individual sand grains, Kim was fascinated by the variety that exists in this world. She began to send out requests for sand from around the world. Added to her personal samples from Sandy Hook, NJ, were sand from Florida, New Zealand, the Dominican Republic, and other exotic locations. Kim was greatly encouraged by the support she received.
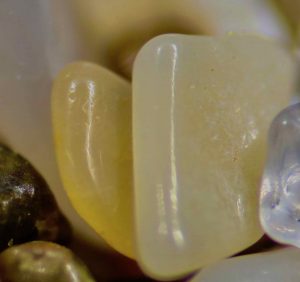
The variety of sand was instructive: New Zealand sand, for example, the second sample above, was from Rings Beach. It was notably glassy, with yellows, purples, and pinks. The next sample below, from Venice, Florida’s prime location on the Gulf Coast, is quartz mingled with fragments of fossils and crushed shells.
Throughout this process, Kim has been creatively reactive to her changing situation. As she presents in the poster session of the Symposium on Education, this has ultimately been an exercise in experimental design and development. Kim has learned how to adapt when the original plans did not work out and begun to network with a larger community.
She says,
At beginning of the sand and snowflake study, I hoped to obtain a few clear pictures of individual sand grains and snowflakes. Shortly after the study began, I became interested in learning about the different minerals that compose sand.
Currently, I have taken over 200 pictures of sand grains from over 35 different locations. This project has blossomed from a hobby into a passion.
Continuing her work, Kim would love for people to come see her at her poster to share ideas about how best to analyze the sand she has collected and to consult about techniques to catch and photograph snowflakes.
Another good reason to spend time wondering at the pictures in the poster conference. One final incentive, a biogenic sand sample from the Dominican Republic, where pink hues set it apart from U.S. East Coast sand.
Is It Sand Or Is It Snow?: Nuggets from Today's Poster Session
Today’s poster sessions starting at 4 p.m. will full of mysterious images. This is your opportunity to ask the researchers what the pictures are all about.
In the case of Morristown-Beard School sophomore Kim Magnotta’s poster (103) today, the question may be simply, what are pictures of sand doing at a meteorology conference?
There’s a good reason, of course, so go ahead and ask.
Magnotta jumped into microphotography hoping to capture images of snowflakes falling on Northern New Jersey. Starting her work during summer vacation, finding snow was difficult. Collecting samples from the Jersey Shore, she started photographing sand. It was also much easier perfecting her technique using subjects that did not melt. The first example shown above is primarily quartz and feldspar from Sandy Hook, NJ, including several uniquely large grains.
Focusing on individual sand grains, Kim was fascinated by the variety that exists in this world. She began to send out requests for sand from around the world. Added to her personal samples from Sandy Hook, NJ, were sand from Florida, New Zealand, the Dominican Republic, and other exotic locations. Kim was greatly encouraged by the support she received.
The variety of sand was instructive: New Zealand sand, for example, the second sample above, was from Rings Beach. It was notably glassy, with yellows, purples, and pinks. The next sample below, from Venice, Florida’s prime location on the Gulf Coast, is quartz mingled with fragments of fossils and crushed shells.
Throughout this process, Kim has been creatively reactive to her changing situation. As she presents in the poster session of the Symposium on Education, this has ultimately been an exercise in experimental design and development. Kim has learned how to adapt when the original plans did not work out and begun to network with a larger community.
She says,
At beginning of the sand and snowflake study, I hoped to obtain a few clear pictures of individual sand grains and snowflakes. Shortly after the study began, I became interested in learning about the different minerals that compose sand.
Currently, I have taken over 200 pictures of sand grains from over 35 different locations. This project has blossomed from a hobby into a passion.
Continuing her work, Kim would love for people to come see her at her poster to share ideas about how best to analyze the sand she has collected and to consult about techniques to catch and photograph snowflakes.
Another good reason to spend time wondering at the pictures in the poster conference. One final incentive, a biogenic sand sample from the Dominican Republic, where pink hues set it apart from U.S. East Coast sand.
Dr. Wakimoto’s Lessons in Leadership
“One of you is likely to be standing here someday replacing me, “ AMS President Roger Wakimoto told the assembled 600+ attendees of the 18th AMS Student Conference Saturday morning in Phoenix.
The students looked at each other in the North Ballroom, but nobody could figure out who he was talking about. And neither could Dr. Wakimoto.
“Everyone is capable of being a leader,” he explained. “It’s whether or not you want to grasp the opportunity.”
For Wakimoto, who now serves as Vice-Chancellor for Research at the UCLA, this is wisdom grasped from life experience.
“As a student I was never chosen to lead anything,” the famed severe storm researcher told the students. “When they selected basketball teams, I was always the last person they would have selected.”
But at key moments in his life, enough people recognized Wakimoto’s capabilities even when he did not. Wakimoto didn’t plan to go to graduate school, but a professor “yanked me aside and told me it would be an incredible waste if I didn’t.”
Then, while comfortable in the academic enclave of his research at UCLA, people pushed him to try a leadership role, first at NCAR and then the National Science Foundation.
Wakimoto, who had to step suddenly into a now-finished two-year tenure as AMS President with the death of Matthew Parker, expressed the lessons of leadership in three simple words: transparency, integrity, and engagement.
The rest is unpredictable. “Forecasting the weather is easy; forecasting your future is impossible.”
Dr. Wakimoto's Lessons in Leadership
“One of you is likely to be standing here someday replacing me, “ AMS President Roger Wakimoto told the assembled 600+ attendees of the 18th AMS Student Conference Saturday morning in Phoenix.
The students looked at each other in the North Ballroom, but nobody could figure out who he was talking about. And neither could Dr. Wakimoto.
“Everyone is capable of being a leader,” he explained. “It’s whether or not you want to grasp the opportunity.”
For Wakimoto, who now serves as Vice-Chancellor for Research at the UCLA, this is wisdom grasped from life experience.
“As a student I was never chosen to lead anything,” the famed severe storm researcher told the students. “When they selected basketball teams, I was always the last person they would have selected.”
But at key moments in his life, enough people recognized Wakimoto’s capabilities even when he did not. Wakimoto didn’t plan to go to graduate school, but a professor “yanked me aside and told me it would be an incredible waste if I didn’t.”
Then, while comfortable in the academic enclave of his research at UCLA, people pushed him to try a leadership role, first at NCAR and then the National Science Foundation.
Wakimoto, who had to step suddenly into a now-finished two-year tenure as AMS President with the death of Matthew Parker, expressed the lessons of leadership in three simple words: transparency, integrity, and engagement.
The rest is unpredictable. “Forecasting the weather is easy; forecasting your future is impossible.”
AMS Council Speaks Out on Federal Government Shutdown
At its meeting this morning in Phoenix, the AMS Council has released the following statement on the Federal government’s ongoing shutdown:
Those of us who study and predict the atmosphere are familiar with the impacts of uncertainty. Americans rely on weather forecasts, and they trust them to be reliable. Lives and livelihoods are saved or lost based on the timeliness and accuracy of a single weather warning.
Unfortunately, the current U.S. government shutdown—and the associated uncertainty—is now beginning to seriously set back efforts to better understand and forecast our environment and protect the nation’s health and prosperity. National Weather Service forecasters who work without pay during a shutdown, like their peers in other essential government services, experience mounting financial and emotional stress. Years of research are jeopardized when federal scientists cannot collect uninterrupted data. When government researchers no longer maintain collaborations with their peers in academia and industry, our nation, and each and every citizen, loses out.
The uncertain length of a shutdown adds to its costly and corrosive effects. Like a chain reaction, the impacts of a government shutdown ripple far beyond those who are furloughed and can impede development of new scientific technologies that are vital to our nation. Many non-government contract employees are already on forced time off without pay, and experiencing severe financial and personal hardship; we may lose the benefit of their knowledge and capabilities as a result.
Within days, the current shutdown may become the nation’s longest on record. Virtually all other nations have mechanisms to keep partisan disagreements from closing major segments of their governments for days or weeks. Without such a backstop, every shutdown means that the U.S. loses more ground to overseas competitors, as other nations take the lead in scientific leadership.
Our nation cannot afford to undermine its scientific enterprise for the sake of policy disagreement. The AMS urges our elected officials to come together and restore normal federal government operations as soon as possible, and we strongly suggest that partisan differences of opinion be given the time and attention they deserve without the unintended consequences of holding scientific research and related activities hostage.