by Tom Champoux, AMS Director of Communications
When I was in the fourth and fifth grade, my father visited my class on Science Day a number of times. I remember his visits vividly because he would always bring unique and interesting items with him–things no one else’s dad brought, like weather maps and rock samples. He once even brought in a grainy, amateur film that showed the volcanic island Surtsey being born off the coast of Iceland in the mid-1960s.
I also went with him many times to work, hanging out in his office while he taught class. There, my siblings and I would always find some interesting science toy or activity to play with and learn from. It was during these years that I learned so much about Earth and space science, and it served as the foundation for my love of science that has lasted a lifetime.
Officially my father was an Earth science and geology professor at a small community college in northern Massachusetts, but he also taught meteorology, and later even added algebra and computers.
This week, AMS released a new policy statement on STEM education (Science, Technology, Engineering, and Mathematics), and reading through it I was reminded of my exposure to science in grade school. I was reminded too of the power of science to excite and engage school children in ways other subjects can’t.
In the new AMS Policy Statement, AMS supports maintaining Earth systems science as an integral part of STEM education–both to provide all students with a basic understanding of the Earth system as well as to create a pipeline of students who will become America’s future scientists and researchers.
The Earth system affects all of us, every day–from severe weather to rising seas, from solar radiation to plate tectonics. Because so much of what we experience every day is part of a very large and complex system, it is critical that all students learn about that system and the relationship between all areas of Earth science.
Most scientists can vividly recall the time or even the moment when they fell in love with science. Like me, many were school-age when it happened. There’s an inherent excitement in science–in looking through a telescope or microscope for the first time, or in creating models of volcanoes or posters showing the lifecycle of common frogs. Children want to understand science and engage in it, and it’s vitally important that we provide every opportunity to do just that.
Tomorrow’s challenges in understanding and explaining water, weather, and climate will be solved by today’s students. And those scientists of tomorrow will need their peers to be a receptive and knowledgeable public capable of utilizing science to solve society’s challenges. Providing all students with the best possible understanding of how the Earth works, and how humans function on it, will be vitally important to people everywhere.
Uncategorized
New Map Peeks Under Antarctic Ice
With data compiled from a number of satellite, aircraft, and surface-based surveys, the recently completed Bedmap2 project comprises three datasets to map the ice-covered continent of Antarctica: surface elevation, ice thickness, and bedrock topography. The new dataset updates 2001’s original Bedmap compilation with tighter grid spacing, millions of additional data points, and extensive use of GPS data—enhancements that have improved the dataset’s resolution, coverage, and precision. For example, it depicts many surface and sub-ice features that were too small to be visible in the original Bedmap. Data from Bedmap2 reveal that Antarctica’s average bedrock depth, deepest point, and ice thickness estimates are all greater than that recorded in the original Bedmap.
As outlined in the NASA video below, the updated information obtained from Bedmap2 should enhance currently limited data on the continent’s ice thickness and what is beneath the ice, which could help researchers better understand how Antarctica will respond to a changing climate. It also “will be an important resource for the next generation of ice sheet modelers, physical oceanographers, and structural geologists,” according to the British Antarctic Survey’s Peter Fretwell, lead author of a recently published article on Bedmap2 that appeared in The Cryosphere. The article and Bedmap2’s data can be accessed here.
Remembering the Battle . . . and the Weather
As Gettysburg National Military Park commemorates the 150th anniversary of the momentous and bloody battle fought there (it took place July 1-3, 1863), we can look back and examine the role weather played in those three days of conflict (and AccuWeather already has, in this interesting post). This is possible thanks in large part to a local man, Rev. Dr. Michael Jacobs, who took weather observations three times a day, even as the fighting raged on around him. His notes, which can be seen here, show that temperatures were slightly below average for all three days, and that cloud cover was considerate much of the time. This benefited the soldiers, who would have been most uncomfortable in their wool uniforms during extreme heat and/or humidity. Late on July 3, a thunderstorm broke out, and it is testament to the ferocity of the battle that Jacobs noted the thunder “seemed tame” after the nonstop cacophony of gunfire that echoed throughout that afternoon.
As the battle wound down, the weather intensified, with rain falling throughout the day (a total of 1.39 inches, according to Jacobs) on July 4, the day after the combat had ended. The inclement weather turned out to be significant, as some wounded soldiers were still lying on the battlefield; tragically, those who were in low-lying areas drowned when the rainfall caused the Plum Run Creek to overrun its banks. The rains also added insult to injury for the retreating Confederate army–the dirt roads they traveled on rapidly became treacherous, and as they moved southward they were trapped for a period of time on the north side of the Potomac after the river swelled, making it temporarily impassible. They weren’t able to cross until July 13th.
AMS Names New Policy Program Director
Beginning this month, Paul Higgins has succeeded Bill Hooke as director of the AMS Policy Program. Hooke will move into a senior policy fellow position and also more fully embrace the position of associate executive director of the AMS that he has nominally held for several years (he will also continue writing his blog on science, climate, and policy, Living on the Real World).
“I have big shoes to fill,” Higgins said, “but the fact that those big shoes will be standing with me will be a great help.”
After spending a year on Capitol Hill learning about the policy process as an AMS-UCAR Congressional Science Fellow, Higgins joined the Policy Program staff in 2006 as senior policy fellow, and was named associate director of the program in 2010. In these roles he has coordinated the AMS Climate Briefing Series, supervised the AMS-UCAR Congressional Science Fellowship Program, and helped train Earth scientists to engage the federal policy process at the AMS Summer Policy Colloquium. He also studies climate policy options and conducts scientific research on the causes and consequences of climate change. His scientific research involves the study of the two-way interaction between the atmosphere and the land surface, and his policy research involves analyzing existing legislative approaches and developing risk-management strategies that can overcome contentious political obstacles to climate policy.
In 2011, he was selected as a Google Science Communication Fellows–one of twenty-one early- to mid-career Ph.D. scientists across the United States chosen to participate in a workshop that included hands-on training and brainstorming on topics of technology and science communication.
In looking forward, Higgins cites two primary challenges the Policy Program faces: 1) ensuring that policy choices take full advantage of the knowledge and understanding made possible by Earth observations, science, and services; and 2) making sure that policy makers understand how much the nation’s welfare depends on those observations, science, and services.
“Meeting these two grand challenges,” Higgins said, “will strengthen the AMS community and, more importantly, help the nation and the world avoid risks and realize opportunities related to the Earth system.”
Hooke joined the Policy Program (which was then called the Atmospheric Policy Program) in 2000 and had been its director since 2001 while also serving as a senior policy fellow. In that time he directed the AMS policy education programs, including the Summer Policy Colloquium and the Congressional Science Fellowship Program. His research interests include natural disaster reduction, historical precedents as they illuminate present-day policy, and the nature and implications of changing national requirements for weather and climate science and services.
“Serving as AMS associate executive director is a high honor,” Hooke said of his new role. “I hope to serve our community well.”
“This transition acknowledges that Bill has been very active in a variety of AMS initiatives, and allows him to more visibly represent the entire AMS,” said AMS Executive Director Keith Seitter. “Meanwhile, Paul brings new ideas and a fresh leadership to the Policy Program while becoming a member of the Society’s management team.”
NWS Experiment Chooses Words To Improve Warnings
The National Weather Service recently announced plans to expand the use of its experimental impact-based storm warnings to include all 38 branches of the NWS Central Region. The warnings go beyond a simple explanation of a storm’s strength by communicating specific effects that the storm could cause, using descriptions like “major house and building damage likely and complete destruction possible,” “major power outages in path of tornado highly likely,” and “complete destruction of vehicles likely.” The warnings were implemented last year in Kansas and Missouri, and officials believe they helped prevent fatalities during a tornado outbreak in Kansas last April 14. The effectiveness of the warnings last year will be examined in more depth in a presentation at the Second AMS Conference on Weather Warnings and Communication, which will be held this June in Nashville (in concert with the 41st Conference on Broadcast Meteorology) .
These new warnings are just one example of the advances made in communicating dangerous weather events to the public, and the Nashville conference will examine a number of methods, including the use of social media and mobile apps. The meeting will also look at how the general public responds to various types of warnings, and explore both old and new technologies in warning systems. The full program for the conference can be found here.
Clarity of communication is a key to the impact-based warnings. According to this story in the Wichita Eagle, emergency officials are praising the vernacular of the new warnings. Michael Hudson, chief operations officer for the NWS Central Region headquarters in Kansas City, Missouri, noted that “emergency managers liked the extra information that was in the warnings–the information that got to the magnitude of the weather.” In specific reference to the intense tornado in Sedgwick County, Kansas, last April, that county’s emergency management director, Randy Duncan, felt the language in the impact-based warnings “helped to convey how serious the situation was, and the fact that we didn’t have any fatalities means–at least in my mind–that people in Wichita paid attention.”
The expanded use of the warnings this year will include some minor revisions resulting from some lessons learned in last year’s experiment. One change is the new use of the word “considerable” instead of “significant,” because “significant” was considered by many users to be too vague. Hudson explained that forecasters are instructed to consider “what you’d tell your wife or husband or children” about the potential threat of a storm.
Checking the Sky for the Long Ball
In Major League Baseball today, pitchers are kings. Hits per games have decreased for six straight years, while strikeouts per game have gone up seven straight seasons. An influx of young pitchers throwing harder than ever and with more movement on their pitches combined with analytical data that puts the defense in better position to prevent hits has stifled offenses throughout the Majors. (Oh, and there’s also–presumably–fewer hitters with artificially enhanced bodies than there used to be.)
This means that baseballs are flying out of ballparks at much lower rates today than they were at the beginning of the new millennium. Home runs peaked in the 2000 season, with almost 5,700 balls leaving the park (1.17 per game). Those numbers have been in a fairly steady decline since, reaching a nadir of 4,552 (0.94) in 2011, and still only at 4,934 (1.02) last season. So what’s a fan who just wants to see a few dingers to do? Well, don’t forget about the weather. Baseballs tend to travel farther when the air is less dense, and of course a good tailwind helps as well. And there’s an app that can help fans track conditions at their local Major League stadium and, most importantly, let them know the likelihood of home runs at that day’s (or the next day’s) game.
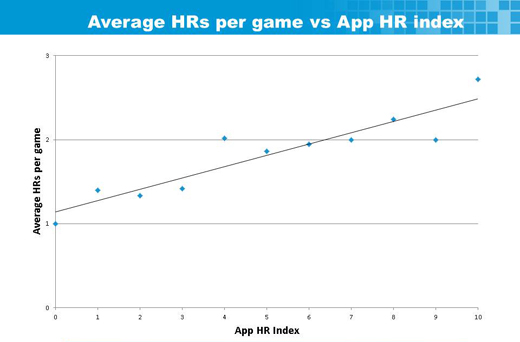
Home Run Weather takes into account temperature, atmospheric pressure, humidity, wind direction and speed, the orientation of the ballpark, and the drag coefficient of a baseball to calculate the home run index, which tells how favorable conditions are for home runs at every game in every Major League park. The index, which is available for both current conditions and hourly over a 24-hour period, is given on a scale of 0 (least favorable) to 10 (most favorable). The creation of the index incorporated both analysis of weather and home run data over several seasons at Citizens Bank Park in Philadelphia as well as a theoretical, physics-based model that calculates how far a baseball will travel in specific atmospheric conditions. The accuracy of Home Run Weather is indicated in the chart below, which shows the average number of home runs hit per game over the course of the 2012 season for each of the app’s index values.
The app is available for both iPhones and Androids. And just a quick heads up: tonight’s Nationals-White Sox game at 7:00 in Washington, D.C., gets a “10” on the home run index (forecast of 80-degree temps, 12-mph winds, 49% humidity, and pressure of 29.85″), so if you like home runs, get yourself to Nationals Park!
AMS Teaching Excellence Award Renamed after Edward N. Lorenz
Almost five years after his passing, the AMS is honoring Edward N. Lorenz by renaming the Teaching Excellence Award after the pioneer meteorologist. Best known as the founder of the chaos theory and butterfly effect, Lorenz was also an influential professor at the Massachusetts Institute of Technology (MIT) for decades.
According to Peter Lamb in his recommendation to rename the award:
Edward N. Lorenz was arguably the most accomplished research meteorologist of the twentieth century. His seminal contributions in several key areas of our science today either carry his name or a name that he provided. At MIT, his principal instructional role was to introduce multiple generations of beginning doctoral students, many with little or no background in meteorology, to the challenges and rigor of the theoretical essentials of our science. Those lectures were renowned for their consistently very high standards of preparation and presentation, just like Professor Lorenz’s external seminars.
Lorenz received the MIT Department of Meteorology’s “Best Teacher” award the first year student evaluations were conducted as well as subsequent years. He went on to win the Kyoto Prize and AMS Carl Gustaf Rossby Research Medal, just a few of his numerous honors. Many of Lorenz’s students went on to distinguished research careers. Several were recognized with the AMS Rossby Medal and Charney Awards, and two of his past students received the AMS Teaching Excellence Award.
The AMS Council passed the recommendation in January, renaming the award “The Edward N. Lorenz Teaching Excellence Award.” Nominations for all awards are now open with a deadline of May 1. The Council encourages members and friends of the AMS to submit nominations for consideration for the Society Awards, Lecturers, Named Symposia, Fellows, Honorary Members, and nominees for elective Officers and Councilors of the Society here.
New NSTA Executive Director Talks Climate Education
Last month, AMS member David L. Evans began as the new executive director of The National Science Teachers Association (NSTA), the largest professional organization promoting excellence and innovation in science teaching and learning.
Evans—former director of the Center for Sustainability: Earth, Energy, and Climate at Noblis, Inc.—has served the science profession in many different capacities throughout his career. Along with serving as undersecretary for science at the Smithsonian Institution in Washington, D.C., he was assistant administrator for Oceanic and Atmospheric Research at the National Oceanic and Atmospheric Administration, deputy assistant administrator for the National Marine Fisheries Service, senior scientist and deputy administrator at the National Ocean Service, and program manager at the Office of Naval Research. Evans was also a tenured professor of oceanography at the University of Rhode Island and was a classroom teacher in Media, Pennsylvania.
The Front Page asked Evans about his plans as executive director.
As the new executive director of NSTA, what are your plans for promoting education about climate and weather?
The National Science Teachers Association is a partner in the development of the Next Generation Science Standards (NGSS) and will be working to encourage their adoption and assisting with implementation. One of the design constructs of the NGSS has been to reduce the breadth of topics covered in favor of greater depth. Weather and climate are among the disciplinary core ideas in the standards, which are important at all grade levels. In addition to their presence as “topics,” weather and climate provide ideal areas to explore science and engineering practices and cross cutting concepts like model development.
How did teaching prepare you for a career in science (and/or science prepare you for teaching?)
For me, teaching and science have always been intimately linked. Being a scientist has always inspired me to share what I know, whether in a journal article or in the classroom. Teaching is where it all begins, where we can ignite a spark in students to want to learn more about science. Discovering something new about the world we live in and discussing and sharing the information with others is all part of the scientific process of evidence-based reasoning and communication.
How do you feel your background in general will aid in facilitating the goals of the NSTA?
My background includes teaching at both high school and university levels, conducting and managing scientific research, and leading large scientific and educational organizations. At NOAA, I worked to enhance the education programs in the National Marine Sanctuaries, the National Sea Grant College Program, and NOAA Cooperative Institutes. At the Smithsonian, I worked to develop the National Science Resource Center and to emphasize the importance of the public understanding of science in the museums and zoo. My executive skills coupled with my management expertise will be helpful in leading the NSTA and navigating the association’s future. My program and administrative experiences will be helpful in managing the NSTA.
Are there plans for any new programs/innovations in the NSTA?
It is really too soon to talk about new programs in detail. However, STEM education is on the national agenda and there seems to be broad agreement on its importance. NSTA’s mission is to promote excellence in science teaching and learning for all and that is not confined to doing everything the same way that it has always been tried. We have learned quite a lot about how people learn and we have mature and evolving technologies that make “information” available everywhere, all of the time. NSTA will be a part of the changing landscape of professional development for teachers and new learning methodologies for students.
AMS Lowers Dues for Members in Developing Countries
The AMS Council recently approved a reduction in the cost of membership for those living in countries with developing economies. AMS President J. Marshall Shepherd announced the change in this message:
As the new American Meteorological Society (AMS) President for 2013, I am pleased to inform you of a recent change to the AMS dues structure that directly impacts those living in resource-restricted areas. Effective immediately, scientists and other professionals residing in countries with developing economies (CDE) are entitled to AMS membership for just $20, a fraction of the regular member cost.
The current list of eligible countries as approved by the AMS Council may be located on the AMS Web site at http://www.ametsoc.org/MEMB/countrydeveconomylist.html
I urge you to take advantage of this opportunity to enhance your networking and professional development. AMS CDE membership runs on a calendar year basis (January-December) and includes a subscription to Digital BAMS (www.ametsoc.org/digitalbams/), published monthly. Journal subscriptions are optional and may be purchased at the discounted member rate. Additional benefits specific only to members include:
- Full access to Digital BAMS, the online version of Bulletin of the American Meteorological Society (BAMS), the official publication of the AMS
- Subscription to AMS News You Can Use, a weekly electronic newsletter that highlights topics in meteorology and related sciences from sources around the world
- Society journals at greatly reduced subscription rates and deep discounts on new and classic titles in the collection of AMS Books
- Discounted registration fees for AMS annual and specialty meetings and continuing education programs
- Special Member privileges on our AMS Online Career Center
- Full voting privileges
An application for CDE membership may be downloaded from http://www.ametsoc.org/MEMB/
apps/2013apps/cde_app.pdf and returned to AMS by fax or mail. Please refer to the application form itself for specific instructions. If you have any questions regarding AMS membership or the application process, our Member Services department is available by email at [email protected] or by phone at 617-227-2425 to assist you.
Join AMS and be part of a diverse and dynamic national and international scientific network that’s 14,000 members strong. I encourage you to fully immerse yourself into the Society, and where possible, engage in the numerous opportunities to contribute, such as volunteering for committee service or nominating fellow colleagues for awards. Help shape the future of our profession by becoming a member today.
Sincerely,
Dr. J. Marshall Shepherd
President, American Meteorological Society
UCAR Videos Bring the Past Back into Focus
For history buffs, YouTube is an incredibly addictive site. Are you a football fan? Maybe you’d like to watch some highlights from games played in 1976. More of a rock ‘n roll enthusiast? Check out the remastered version of the Beatles’ legendary appearance on the Ed Sullivan Show in 1964. But if you’re interested in the history of the atmospheric sciences, maybe you’ve been wondering where you can get your video fix. Now NCAR has the answer: their new YouTube channel. The channel is part of the NCAR/UCAR Archives, which has more than 70 collections in both paper and digital form. NCAR’s Kate Legg highlighted some of the organization’s digital archive highlights in Tuesday’s session on historical perspectives on weather.
The NCAR YouTube channel includes a number of 16-mm films made in the 1960s and 1970s, including scenes from various field projects and educational videos that Legg noted “remind her of film projectors and elementary school.” The channel currently has 30 videos, with new material added on a regular basis. The sample video below was made for the National Scientific Balloon Facility.