Asian American and Pacific Islander Heritage Month Spotlight: Dr. Syukuro “Suki” Manabe

By Anjuli S. Bamzai, AMS President

My graduate advisor at George Mason University, Dr. Jagadish Shukla, displayed the photos of four meteorologists in his office: Drs. Norman A. Phillips, Jule Charney, Edward Lorenz, and Syukuro “Suki” Manabe. All giants in their field, they had been his PhD advisers at Massachusetts Institute of Technology (MIT). In the 1990s, as I pursued my graduate degree at Dr. Shukla’s Center for Ocean-Land-Atmosphere Studies (COLA), the scientific family tree remained strongly connected, and so I in turn had the chance to cross paths with luminaries like Manabe in person.

Suki Manabe photo

Circa 1994, I had the privilege of hearing Manabe–or, as I came to refer to him, Suki-san–give the inaugural talk at the newly established COLA. He spoke about the use of dynamical general circulation models to study the atmosphere and its coupling to land, using a simple ‘bucket’ model to discover emergent properties of this complex, chaotic system. He was an animated speaker; it was apparent that he was driven by curiosity and sheer love of the science that he was pursuing.

I was inspired by his ability to explain the properties of such a complex system as the Earth in such elegant terms. Suki-san’s clarity and scientific passion resulted in contributions to our understanding of climate the importance of which cannot be overstated. As I began my own foray into Earth system science, those initial interactions were a formative experience.

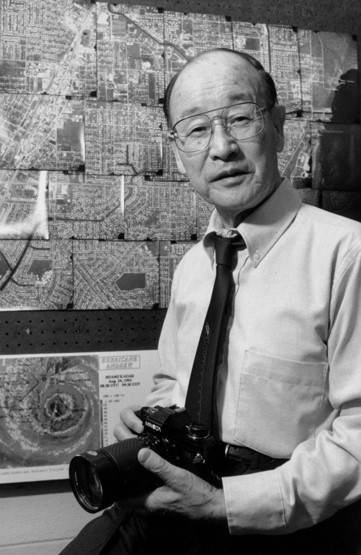
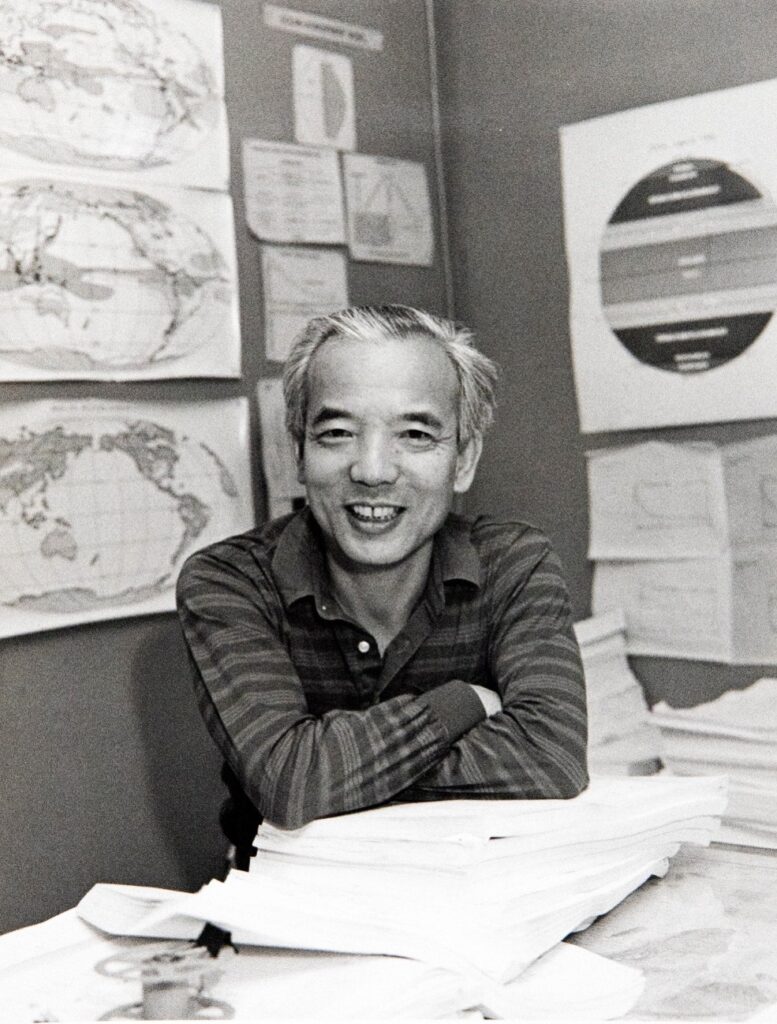
Left: Suki-san enjoying his work. Photo courtesy of Dr. V. Ramaswamy.

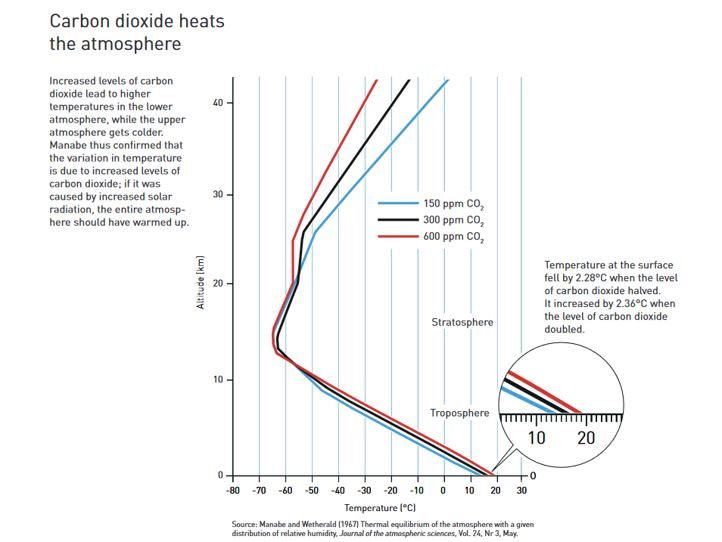
The models he used were relatively simple compared to the complex Earth system models of today. Yet Manabe and Wetherald (1967), published in the AMS’s Journal of the Atmospheric Sciences, is arguably one of the most influential papers in climate science. It demonstrated a key feature of the atmosphere with an increase in carbon dioxide: rising temperatures closer to the ground while the upper atmosphere got colder. If the variation in solar radiation was primarily responsible for the temperature increase, the entire atmosphere would have gotten warmer.

Graphic from Phys.org, based on Manabe and Wetherald (1967), Figure 16, “Vertical distributions of temperature in radiative convective equilibrium for various values of CO2 content.”

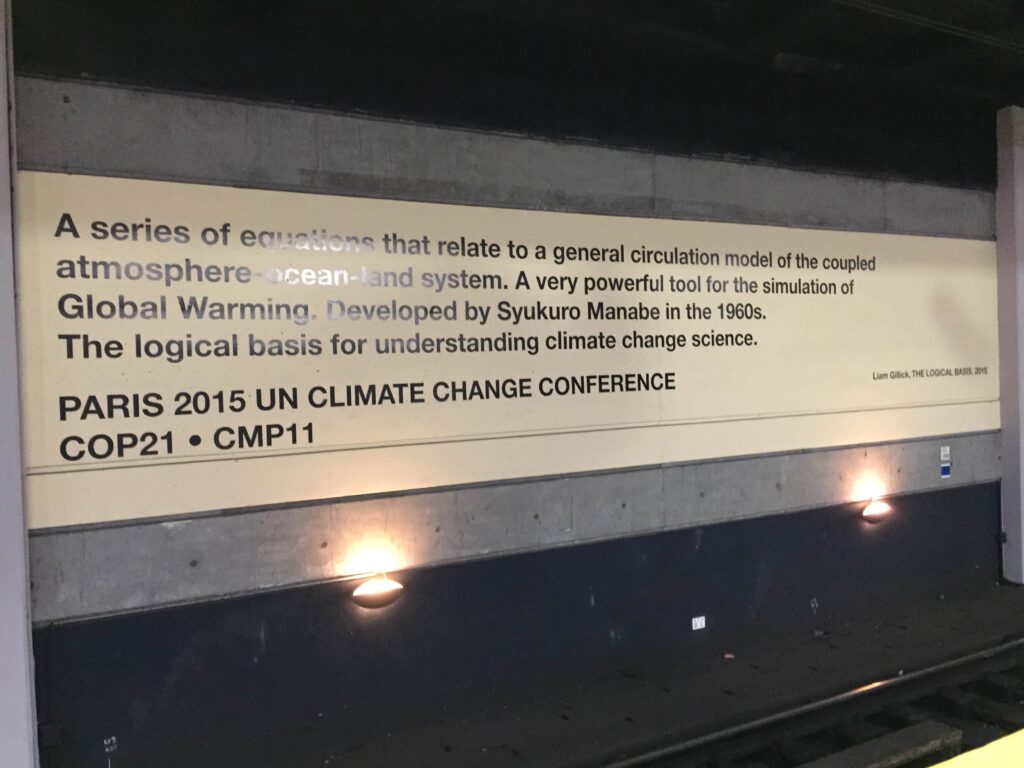
The work that Suki-san and his team conducted comprised a major component of the 1979 report, “Carbon dioxide and climate: A scientific assessment.” Led by Jule Charney from MIT, it is now commonly referred to as the Charney Report. The main result of the succinct 22-page report was that “the most probable global warming for a doubling of [atmospheric] CO2 [is] near 3°C with a probable error of ± 1.5°C.” Perhaps most importantly, the report ruled out the possibility that increasing CO2 would have negligible effects. This estimate of climate sensitivity has pretty much withstood the test of time; in the past forty years, annual average CO2 concentrations increased by ~ 21% and the global average surface temperature increased by ~0.66°C. How prescient!

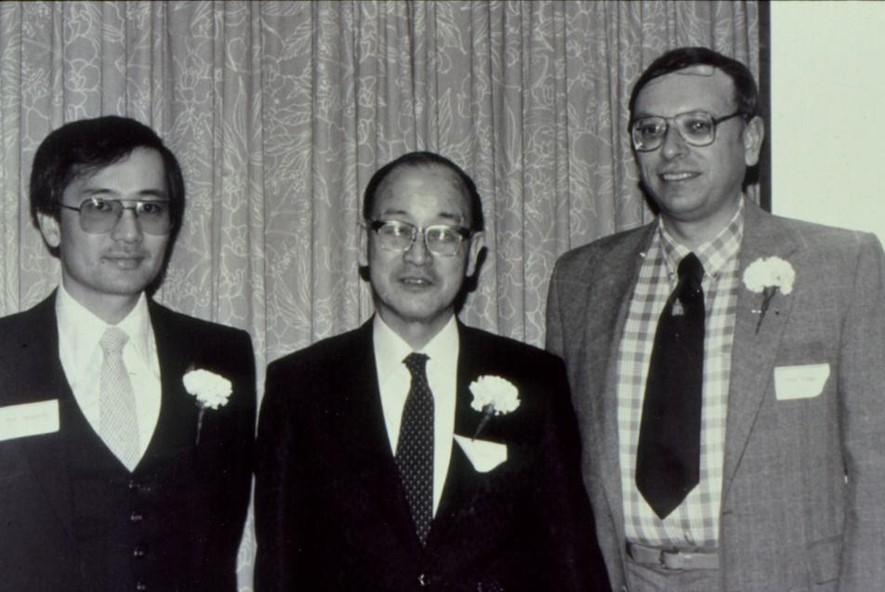
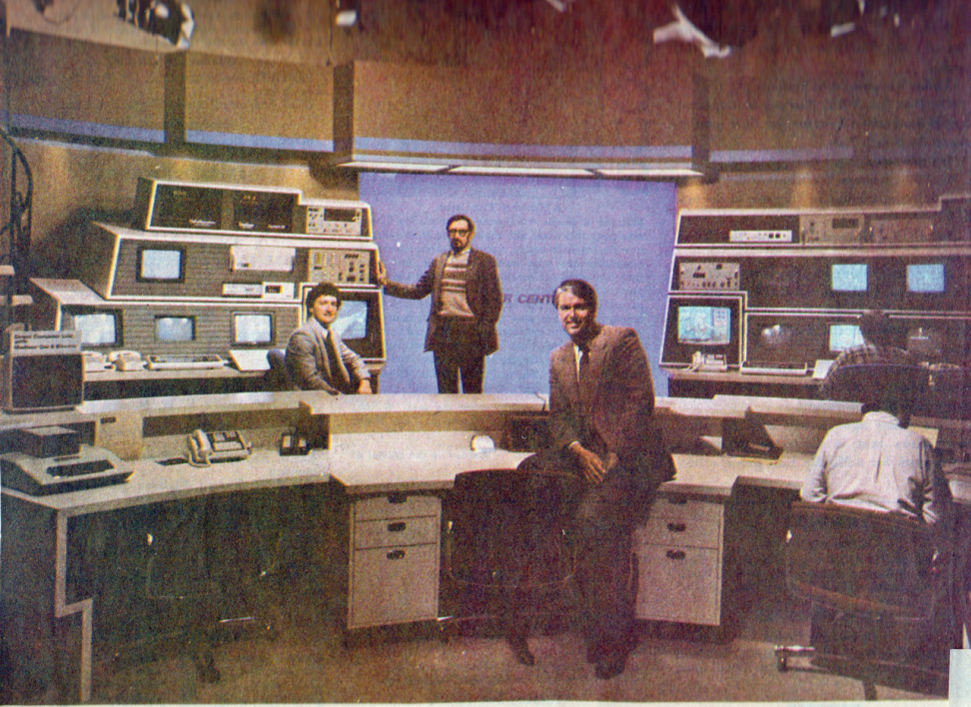
Suki-san was one of the panelists who shared their insights at a session that the National Academy of Sciences’ Board on Atmospheric Sciences and Climate (BASC) convened during its November 2019 meeting to commemorate the 40th anniversary of the Charney Report. Suki-san’s concluding slide pretty much summed up his philosophy: make your model just as complicated as it needs to be, no more. (See photo below.)

Panelists photo and concluding slide. Slide text says, "Concluding Remarks: 
[Bullet point one] Satellite observation of outgoing radiation over annual and inter-decadal time scale should provides macroscopic constraint that is likely to be useful for reducing large uncertainty in climate sensitivity.
[Bullet point two] It is desirable to make parameterization of subgrid-scale process 'as simple as possible', because simpler parameterization is more testable."
Left: Panelists at the November 21, 2019 session on The Charney Report: Reflections after 40 years at the BASC meeting. (Left to right) Drs. Jagadish Shukla, former student of Jule Charney; D. James Baker, member of the original authoring committee; Jim Hansen and Syukuro Manabe, major contributors to the original report; and John Perry, staff lead for the report. Right: Dr. Manabe’s final slide at the Charney Report session at BASC. Photos courtesy of Anjuli Bamzai.

October 5, 2021, was such an exciting day to wake up to! The Nobel Prize in Physics was shared by Drs. Syukuro Manabe, Klaus Hasselman, and Giorgio Parisi. The citation reads: “The Nobel Prize in Physics 2021 was awarded for groundbreaking contributions to our understanding of complex physical systems” with one half jointly to Syukuro Manabe and Klaus Hasselmann “for the physical modelling of Earth’s climate, quantifying variability and reliably predicting global warming,” and the other half to Giorgio Parisi “for the discovery of the interplay of disorder and fluctuations in physical systems from atomic to planetary scales.”

As he eloquently stated on the momentous day that he received the Nobel Prize, “I did these experiments out of pure scientific curiosity. I never realized that it would become a problem of such wide-ranging concern for all of human society.”

The accompanying press release on the Nobel Prize particularly cites Suki-san’s work at NOAA in the 1960s, noting that “he led the development of physical models of the Earth’s climate and was the first person to explore the interaction between radiation balance and the vertical transport of air masses. His work laid the foundation for the development of current climate models.”

Left: Event to honor Nobel Laureate Dr. Suki Manabe at National Academy of Sciences. (Left to right) Drs. Jagadish Shukla, Suki Manabe and Marcia McNutt, President National Academy of Sciences. Photo courtesy of Dr. J. Shukla. Right: (Left to right) Drs. V. Ramaswamy, Director, NOAA GFDL, Suki Manabe, and Whit Anderson, Deputy Director, NOAA GFDL, celebrating the big news of Suki-san’s Nobel Prize, October 2021. Photo courtesy of Dr. V. Ramaswamy.

It is no exaggeration to state that the modeling findings by Suki Manabe and, about a decade later, Klaus Hasselman, opened not only an era of climate modeling but also an entirely new subfield of climate science, viz., detection and attribution (D&A) through fingerprinting and other techniques. Observations have provided an important reality check to model simulations through these D&A efforts.

The current torchbearers of the D&A tradition are Drs. Ben Santer, Tim DelSole, Reto Knutti, Francis Zwiers, Xuebin Zhang, Gabi Hegerl, Claudia Tebaldi, Jerry Meehl, Phil Jones, David Karoly, Peter Stott MBE, Tom Knutson, and Michael Wehner, among others. Over the years several of them have also gone on to receive AMS awards—including, in Meehl’s case, the Jule G. Charney Medal. Speaking of awards, Jonathan Gregory is the most recent recipient of AMS’s Syukuro Manabe Climate Research Award, which has also been bestowed on Drs. Joyce Penner and Cecilia Bitz. Next year, consider nominating someone for the Manabe Award, the Charney Medal, or the new Jagadish Shukla Earth System Predictability Prize!

Those of us in the atmospheric and related sciences benefit directly from Suki Manabe’s scientific legacy and intellectual passion, and all of human society owes Suki-san a great debt for helping us to understand climate change, one of the greatest challenges humankind has ever faced.

Anjuli is grateful to Katherine ‘Katie’ Pflaumer for providing useful edits.

Asian American and Pacific Islander Heritage Month Spotlight: Dr. Tetsuya “Ted” Fujita

Tidal Basin with cherry blossoms and ducks (NPS photo)

By AMS President Anjuli S. Bamzai

Blossoming cherry trees are stars of springtime in Washington, D.C., and the most popular place to visit the cherry blossom trees is the Tidal Basin. Their bloom is one of the most joyful events of the year, awaited with much anticipation by tourists, meteorologists, local businesses, and the National Park Service.

Celebrating the friendship between the Japanese and American peoples, the Tidal Basin cherry trees were a gift from the Mayor of Tokyo to the United States in 1912. While the precise timing of peak bloom varies from year to year (April 4 on average, driven largely by winter/early spring temperatures), peak bloom has been occurring earlier due to warming trends. Furthermore, a combination of rising sea level and sinking land has necessitated plans for a new seawall that requires many existing trees to be removed. Yet the government of Japan has promised new trees to replace those that were lost.

This year’s beautiful blossoms strongly reminded me of the remarkable contributions of Japanese Americans — in particular Japanese American meteorologists. Our science would be especially bereft without the contributions of several scientists who, after receiving their advanced degrees at the University of Tokyo in the so-called “Syono school” of dynamic meteorology, immigrated to the U.S. from postwar Japan. Among them were Tetsuya Fujita, Akio Arakawa, Akira Kasahara, Kikuro Miyakoda, Takio Murakami, Katsuyuki Ooyama, Michio Yanai, and of course, Syukuro ‘Suki’ Manabe, one of the three recipients of the Nobel Prize in Physics in 2021.

Celebrating AAPI Heritage Month, in this post I chose to showcase the contributions of the legendary Dr. Tetsuya Theodore ‘Ted’ Fujita. Nicknamed “Mr. Tornado,” he linked tornado damage with wind speed and in 1971, developed the Fujita scale for rating tornado intensity based on ground and/or aerial damage surveys. He is also recognized as the discoverer of downbursts and microbursts, which are serious potential threats to aviation safety. Thus his discoveries made aviation safer.

Fujita (left) with John McCarthy, Inaugural Director of NCAR-RAP/RAL, in 1982. After studying tornadoes for over two decades, Fujita had just seen his first one in person. Photo: Texas Tech, found in Fujita’s memoir, “Memoirs of an Effort to Unlock The Mystery of Severe Storms During the 50 Years, 1942–1992,” in the Texas Tech Southwest Collection/Special Collections Library.

But let’s take a step back. How did Fujita get interested in tornadoes in the first place? In part, his involvement was yet another legacy of the Manhattan Project: Fujita began his life’s work studying damage in Hiroshima and Nagasaki in the aftermath of the atomic bombs.

Fujita was working as assistant professor in physics at Meiji College of Technology in Tobata, exactly halfway between the two cities. A couple of years earlier, in compliance with his dying father’s wishes, he had opted to go to Tobata for his studies in mechanical engineering rather than Hiroshima. In the month following the bombings, Fujita and his team of students went on an observational mission to study the blast zones at both sites. At Nagasaki, through studying the burn marks of various objects, Fujita had the goal of estimating the position of the atomic bomb when it exploded. At ground zero, most trees, though scarred black by radiation, were still standing upright while buildings were in ruins. Seen from above, it looked like a giant starburst pattern.

After WWII ended, he joined the University of Chicago. By a stroke of genius, the Japanese American meteorologist was able to draw comparisons between severe weather and the nuclear shock waves he had studied some twenty-five years earlier at Hiroshima and Nagasaki, through studying the debris and damage of tornadoes before cleanup. He led the development of the Fujita Scale to categorize tornado intensity, a modified version of which remains in use today.

Following the Super Outbreak of 3–4 April, 1974, which covered over 2,600 miles and produced nearly 150 tornadoes in an 18-hour period, Fujita carried out aerial and ground damage surveys covering over 10,000 miles. Through meticulous analysis of the observational data, he demonstrated the existence of smaller tornadoes — suction vortices — within the parent tornado. The aerial surveys also led to the discovery of microbursts.

Photo: Dr. Fujita as a professor of Geophysical Sciences at the University of Chicago, photo taken in April 1961. Special Collections Research Center, University of Chicago Library.

You can read more about his discovery of the downburst and its contributions to aviation safety (including his work as a principal investigator for the National Intensive Meteorological Research On Downburst [NIMROD] project) here.

In 2000, two of his former students organized the “Symposium on the Mystery of Severe Storms: A Tribute to the work of T. Theodore Fujita,” held at the 80th AMS Annual meeting. They were none other than Gregory S. Forbes from The Weather Channel and Roger M. Wakimoto from UCLA, both distinguished meteorologists in their own right. Roger was of course our AMS President in 2017–2018. The photo below shows the three of them at an event at the University of Chicago from the early 1980s.

Dr. Roger Wakimoto (left), Dr. Ted Fujita (middle) and Dr. Gregory Forbes (right), taken in the early 1980s when all were at the University of Chicago. Photo Courtesy of Roger Wakimoto, honorary member of the AMS.

You can read the proceedings of the Symposium here to get a fuller sense of Fujita’s immense contributions to atmospheric science. In this short piece, I have barely scratched the surface.

You can also learn about Fujita through the PBS American Experience series, which describes events and people who have shaped the landscape over the course of history. Fujita is profiled in the episode titled, “Mr. Tornado.”

Featured image: Cherry blossoms surround the Tidal Basin in Washington, D.C. Photo: National Park Service, Kelsey Graczyk

Anjuli is grateful to Katherine ‘Katie’ Pflaumer for providing useful edits.

Celebrating Women’s Contributions to Atmospheric Sciences

By AMS President Anjuli S. Bamzai

I grew up in a family that valued intellectual pursuits, discipline, and the importance of women’s education—and was provided the support to make sure I received that education despite external social and cultural barriers. In the 1930s, when my mother was young, such values were uncommon outside of her family. My mother was the first woman in our community in the town of Srinagar, Kashmir, to receive a college degree, back in the late 1930s. She was followed by her younger sisters, one of whom went on to become the principal of the women’s college in town. Thus, I grew up with the important privilege of having strong women as role models.

As I entered the atmospheric sciences, one of the women who embodied the undaunted courage and determination in that generation of path-breakers was Dr. Joanne Simpson, the first U.S. woman to obtain a doctorate in meteorology, which she earned from the University of Chicago in 1949. In 1989 she became the first female president of the AMS. She researched hot towers and hurricanes, and was the project lead of the Tropical Rainfall Measuring Mission (TRMM) at NASA. While I never got a chance to meet Dr. Simpson, she was a beacon of inspiration.

I worked at the National Science Foundation under Dr. Rita Colwell—NSF’s first female director. An eminent biologist, she is recognized for her groundbreaking work on global infectious diseases such as cholera and their connection to climate. At an NSF holiday party during her directorship, I was astounded and inspired by the number of awards and honorary degrees on her office wall, from institutions all over the world! I admire her efforts in developing programs that support the advancement of women in academic science and engineering careers, such as NSF ADVANCE.

AMS President Anjuli S. Bamzai with a portrait of Dr. Joanne Simpson at AMS HQ (left), and with Dr. Rita Colwell (right). Images courtesy of Anjuli S. Bamzai.

This Women’s History Month, as I reflect about women pioneers who inspired me, I thought I’d share with you a few important figures from my mother’s generation and before. Their contributions have indeed made our field a richer place.

June Bacon-Bercey (1928–2019)

When June Bacon-Bercey went to UCLA, her adviser told her she should consider studying home economics, not atmospheric science. Considering that she’d transferred to UCLA specifically for its meteorology degree program, she didn’t believe this was good advice. We’re all lucky she followed her heart.

Bacon-Bercey graduated from UCLA in 1954, the first African American woman to obtain a bachelor’s degree in meteorology there, and early in her career worked for what is now the National Weather Service as an analyst and forecaster. Later, as a senior advisor to the U.S. Atomic Energy Commission, she helped us understand nuclear fallout and how atomic and hydrogen bombs affected the atmosphere.

In 1972, she became the first on-air African American female meteorologist, working for WGR-TV in Buffalo, New York (and soon after, became the station’s chief meteorologist). That same year, she was the first woman and first Black American to be given the AMS Seal of Approval for excellence in broadcast meteorology. In 1975, she co-founded the AMS Board on Women and Minorities, now called the Board on Representation, Accessibility, Inclusion, and Diversity (BRAID).

June Bacon-Bercey. Image: AMS.

June Bacon-Bercey was a truly multifaceted scientist: over the course of her life, she was an engineer, a radar meteorologist, and a science reporter. She established a meteorology lab at Jackson State University, created a scholarship with the American Geophysical Union, earned a Master of Public Administration, and even served as a substitute math and science teacher well into her 80s. Not only did she achieve so much personally, but she was instrumental in making atmospheric sciences more accessible to minorities and to women.

I’m grateful to her for leaving all of us at AMS such a rich legacy, and hope you are too! Her determination and foresight benefit us all to this day.

Anna Mani (1918–2001)

Despite growing up in the same city where Anna Mani worked at the India Meteorological Department, I learned of her immense contributions to the field only recently. She followed her passion to study meteorology at a time when it was uncommon for women to pursue science. Although it went unseen by many, Mani’s work was instrumental (literally) in advancing meteorological research in India. Anna Mani once said, “Me being a woman had absolutely no bearing on what I chose to do with my life.” 

Thwarted from studying medicine as a young woman, she developed a passion for physics, studied the properties of diamonds, and eventually earned a scholarship to study abroad, learning as much as she could about meteorological instruments. Returning to India just after the country’s independence, Mani played an important role in developing Indian-made weather and climate observing instruments, helping the country become more self-reliant. Her ozonesonde—the first developed in India—was created in 1964 and used by India’s Antarctic expeditions for decades; in the 1980s, these ozonesonde data helped corroborate the presence of the ozone hole in the Antarctic.

Anna Mani and colleague with a radiosonde. Image: World Meteorological Organization.

She eventually became deputy director-general of the India Meteorological Department. She also held multiple elected positions with the World Meteorological Organization related to instrumentation, radiation climatology, and more.

After (nominally) retiring in 1976, she spent the next few decades—almost till the end of her life—heading up a field research project unit assessing wind and solar energy resources. That work paved the way for many wind and solar farms across the country, advancing India’s leadership in renewable energy. How prescient her thinking was in terms of the need to move away from fossil fuels to renewable energy resources for the health of the environment!

Eunice Newton Foote (1819–1888)

By all counts, Eunice Foote was a remarkable woman. She was a dedicated women’s rights campaigner and suffragist, who attended the historic 1848 Seneca Falls Convention, helped publish its proceedings, and was among the first signatories on its Declaration of Sentiments.

In 1856 she was also the first person to demonstrate heat absorption by atmospheric gases and their potential climate impacts. Using a mercury thermometer inside glass cylinders, Foote found that the heating effect of the sun was greater in moist air than dry air, and highest of all for carbon dioxide. She even suggested that higher proportions of atmospheric CO2 could have caused warmer climates over the course of Earth’s history.

Yet the findings of a female amateur scientist—including the first non-astronomical physics paper published by an American woman—were ignored or dismissed by many at the time. Possibly unaware of Foote’s work, a few years later John Tyndall from Ireland wrote his seminal paper on the topic of atmospheric gases and solar radiation in 1861, and he was credited with the discovery of the greenhouse effect.

That didn’t stop Foote, who would publish another physics paper and produce several patented inventions including a temperature-controlled stove. Though she spoke out about women being forced to file her patents under their husbands’ names for legal reasons, she still filed three under her own name, including rubber shoe-inserts and a paper-making machine. As a scientist, inventor, and women’s right campaigner, Eunice Foote was a trailblazer in the true sense of the word. 

The Declaration of Sentiments of the Women’s Rights Convention in Seneca Falls, 1848. Eunice Foote’s name is fifth in the left-hand column. Image source: U.S. Library of Congress.

Women continue to break barriers!

Women, and especially women of color, still face barriers to equal participation and recognition within our fields. There are women whose names we *should* all recognize, but whose work has been buried, others whose ambitions may have been thwarted, or who are still struggling to be taken seriously. Whoever and wherever you may be, you can do your bit to help change that. By giving credit where it is due, we do right by each other and help make the meteorological ecosystem an attractive place to join, work, and collaborate in.

I would invite all of us to make a special effort to recognize the women we know who are making important contributions in Earth systems sciences—not just the ones who’ve already made a name for themselves, beating the odds. Mentor the early career scientists you know. Appreciate their talents and potential. Champion their careers. Consider nominating those you consider meritorious for AMS awards (including the Joanne Simpson Award and the June Bacon-Bercey Award!). If you’re part of the AMS community, consider following in the footsteps of June Bacon-Bercey by getting involved with BRAID’s efforts to make our field more welcoming for all who have a passion to be part it—including women, people of color, LGBTQ+ people, and those with disabilities. Or you might simply view and share this month’s AMS social media posts, celebrating women in our community. Happy Women’s History Month!

Anjuli is grateful to Katherine ‘Katie’ Pflaumer for providing useful edits as well as contributing material.

Decades of Innovation in Weather Broadcasting

Mike Nelson, Terry Kelly, and Dr. Richard Daly in the Weather Central newsroom. Photo courtesy of Mike Nelson.

Celebrating the 50th Conference on Broadcast Meteorology

We’re back with the second of three posts highlighting memories from longtime broadcast meteorologists, as we celebrate last month’s 50th Conference on Broadcast Meteorology! Today’s post highlights how the field of broadcast meteorology has evolved over the decades since these meteorologists started out.

“If you told me in 1983 at the beginning of my career that, forty years later, I would hold a portable little computer in my hand that dwarfs the computing capacity of what was in the spacecraft that took astronauts to the moon, watch live radar on that little computer, and then send personal messages with those radar images and warnings to large groups people in seconds, I would have laughed at you. Everybody talks about model and radar improvements that have occurred during this time period, but the development of instantaneous communication of weather information is mind-blowing and has truly benefited the public.”

Paul Gross, AMS Fellow, CCM and CBM
(Left) Paul Gross and colleagues on a trip to Fenway Park during the 2012 AMS Conference on Broadcast Meteorology in Boston, Massachusetts. (Right) Paul Gross in 1984. Photos courtesy of Paul Gross.

“During my first internship at WMC in Memphis in the early 1980s, the station was still using a magnetic surface map during their weathercast. Of course, now we use augmented reality graphics. Forecasting in the 1980s when I started my career consisted of large printed surface maps and spaghetti charts; we would use colored pencils to make analysis. Now everything is available online and from multiple sources.

“When I first started attending AMS Broadcast Conferences in the early 1990s, Bryan Busby (KMBC-TV) and I had a running joke where we greeted each other as “the other Black guy,” because we were the only two African-Americans there. I am thrilled to see the growth in diversity in our field and our conferences over the decades, to where we can’t say that anymore!”

Alan Sealls, AMS Fellow, CBM, Past Seal Board Chair
Photo from the 33rd Conference on Broadcast Meteorology, in New Orleans in 2004. Pictured from left to right: David Tillman, Lisa Mozer, Bryan Busby, Gene Norman, Alan Sealls, and Yolanda Amadeo. Photo courtesy of Alan Sealls.

“I can remember having 5 p.m., 6 p.m., and 10 p.m. newscasts. I was responsible for one 3 ½-minute weathercast during each news show and maybe updating a phone line forecast. Now, I have a 3 p.m., 4 p.m., 5 p.m., 6 p.m., 6:30 p.m., and 10 p.m. newscasts with not only a generally 3-minute weathercast, but usually a first weather and teases. In addition, I am responsible for updating weather forecasts on a phone line, for radio, multiple social media platforms, the website and streaming service.”

Lisa Spencer, Chief Meteorologist, News4, Nashville, Tennessee

Photo courtesy of Lisa Spencer.

“I started in Seattle in 1971… the satellite images used on the air at KING-TV were single 4×5-inch B&W Polaroids taken at the local NWS office, a 10-minute drive downtown.

Stumping Bryan Gumbel and Jane Pauley with weather science on NBC’s TODAY in the ’80s was always fun, especially demonstrating the shape of rain drops by creating air bubbles in a 6-foot-tall clear plastic tube of Karo syrup (a sticky clean-up.)”

Joe Witte, Climate Outreach Specialist, Aquent, Pasadena, California

“I started my career at WKOW-TV in Madison, WI in 1976. … My first job was to erase the weather boards and help draw weather maps that would be used [by Terry Kelly, President of Weather Central, in his] weather reports. These maps were hand-drawn on lightweight cardboard and were then taped to the wall of the studio in a series of 5-6 maps. The cameraman (there were few women camera operators back then) would pan from left to right across the series of maps to help tell the story. If the masking tape let go, the map would fall to the floor – the viewers were certainly startled to see that! Making these maps took many hours and it was nearly impossible to change the map if the weather changed.

Paper weather maps. Photo courtesy of Mike Nelson.

In 1979, Terry Kelly teamed up with some computer scientists at The UW Space Science and Engineering Department to create the Apple II Weather System which became one of the first TV Weather Computer Systems. … My job in the late 1970s through the mid-1980s was to travel around the country to install the various generations of these computers and train the meteorologists in this new technology. I installed over 50 units during this time and had the honor of meeting and training many of the legends of our industry such as Al Roker, Don Kent, Gary England, Bruce Schwoegler, Bob Copeland, Harry Volkman, Dick Albert, George Winterling, and Valerie Collins. It was truly an amazing time as the computer systems were rapidly changing and the competition between computer companies was intense!”

Right image: Mike Nelson with the Apple II Weather System. Photo courtesy of Mike Nelson.

Mike Nelson, Denver7 Chief Meteorologist, KMGH, Denver, Colorado

(Clockwise from left) Gary England, Don Kent, Dick Albert, and George Winterling. Photos courtesy of Mike Nelson.

“[My] first TV job was with the old WGAN-TV in Portland, Maine, as the first meteorologist on staff… [It] entailed washing down the regional and national weather maps–floor-to-ceiling and made of linoleum, and covered with the tempera-marker info from the night before. Mop-and-bucket work was just part of the shift. Paper weather maps, magnetic suns and moons, and air-brushed clouds followed before actual digital graphics arrived.

As a broadcast meteorologist back then, one had to be proficient in more than forecasting. Changing out helixes in the fax machine, repairing the teletype (without sending 72 volts through your body), changing toner in the satellite receiver, and unending paper cuts were all part of your day.”

Dr. Lou McNally, Former President, AMS Boston Chapter

Dr. Lou McNally at WIVB in Buffalo, circa 1983, with magnetic baseman.
Photo courtesy of Dr. McNally.

Photo at top of post: Mike Nelson, Terry Kelly, and Dr. Richard Daly in the Weather Central newsroom. Photo courtesy of Mike Nelson.


About 50Broadcast

The 50th Conference on Broadcast Meteorology took place in Phoenix, Arizona, June 21-23, 2023. It was organized by the American Meteorological Society Board on Broadcast Meteorology and chaired by Danielle Breezy and Vanessa Alonso.

Making Sure No Tornado Damage Is Too Small

Planetary, synoptic, meso-alpha, meso-beta, local, and more—there are atmospheric scales aplenty discussed at AMS meetings. Enter microtopography, a once-rare word increasingly appearing in the mix in research (for example, here and here).
The word is also coming up as researchers are getting new tools to examine the interaction of tornadoes with their immediate surroundings. Microtopography looks like a potential factor in tornadic damage and in the tornadoes themselves, according to an AMS Annual Meeting presentation by Melissa Wagner (Arizona State Univ.) and Robert Doe (Univ. of Liverpool), who are working on this research with Aaron Johnson (National Weather Service) and Randy Cerveny (Arizona State Univ). Their findings relate tornado damage imagery to small changes in local topography thanks to the use of unmanned aerial systems (UASs).
Microtopographic interactions of tornadic winds were captured in their UAS imagery. Here’s the 5-meter resolution RapidEye satellite imaging of a 30 April 2017 Canton, Texas, tornado path (panel a) versus higher-resolution UAS imaging:
UAS damage figure 1
 
The UAS surveys show that tornadic winds interact with sunken gullies, which appear as unscarred, green breaks (circled in red) in the track of browned damaged vegetation:
UAS damage fig. 3
Erosion and scour are limited within the depressed surfaces of the gullies compared to either side. In another section of the track, track width increases with an elevation gain of approximately 74 feet, as shown in a digital elevation model and 2.5 cm resolution UAS imagery:
UAS damage 3+
The advent of unmanned aerial vehicles (UAVs) has opened new windows on tornado damage tracks. Decades ago, damage surveys took a big leap forward with airplane-based photography that provided a perspective difficult to achieve on the ground. Satellites also can provide a rapid overview but in relatively low resolution. UASs fly at 400 feet—and are still limited to line-of-sight control and the logistics of coordinating with local emergency and relief efforts, regulatory and legal limitations, not to mention still-improving battery technology.
However, UASs provide a stable, reliable aerial platform that benefits from high-resolution imaging and can discern features on the order of centimeters across. Wagner and colleagues were using three vehicles with a combined multispectral imaging capability that is especially useful in detecting changes in the health of vegetation. As a result their methods are being tested primarily in rural, often inaccessible areas of damage.
UAS technologies thus can capture evidence of multi-vortex tornadoes in undeveloped or otherwise remote, vegetated land. The image below shows a swath with enhanced surface scour over two hills (marked X). The arrow on the right identifies speckled white surface erosion, part of the main tornado wedge. Such imagery explains why, among other research purposes, Wagner and Doe are developing the use of UASs in defining tracks and refining intensity-scale estimates.
UAS damage Figure 4

Eight Decades: Mapping New England Catastrophe

Eighty years ago today (September 21st), the Great New England Hurricane of 1938 ripped across New York’s Long Island and slammed into the Northeast, killing more than 600 people and clawing its way across New England and the record books. Every hurricane to strike the region since is compared to this behemoth, and none has come close to its devastating intensity.

U.S. Weather Bureau surface weather map for 7:30 a.m. ET Wednesday, September 21, 1938.

 
Ferocious winds gusting beyond category 5 intensity and an enormous storm surge that wiped out coastal Long Island and flooded into Rhode Island and Connecticut were its hallmarks. Copious rains also brought by the hurricane fell on soils swamped by heavy rain just days before the storm, leading to widespread flooding and thousands of landslides. Eight decades. And its imprint is still being realized.
Recently, new precipitation data on the storm and a precursor heavy rain event—now understood to be ubiquitous before New England hurricanes—were found. This precipitation map (right) newly appears in the 2nd edition of Taken by Storm 1938: a comprehensive social and meteorological history of the Great New England Hurricane, by Lourdes B. Avilés, professor of meteorology at Plymouth State University.
Precipitation observed during the Great New England Hurricane and its predecessor rain event. (U.S. Geological Survey)
Precipitation observed during the Great New England Hurricane and its predecessor rain event.
(U.S. Geological Survey)

 
The map was created by a grad student Avilés was advising—Lauren Carter—who painstakingly digitized thousands of observations from more than 700 daily weather stations Avilés had unearthed, spanning the 6-day event. This unique updated rainfall map is just one of many new and interesting finds detailed in the new edition of her book, which is now available in the AMS Bookstore. The book’s website houses supplemental information, including more color rainfall maps, detailed reports, and photos.

1871 Hawaii Hurricane Strike Shows Lane's Imminent Danger Isn't Unprecedented

Powerful Hurricane Lane is forecast to skirt if not directly hit Hawaii as a slowly weakening major hurricane today and Friday. Its track is unusual: most Central Pacific hurricanes either steer well south of the tropical paradise or fall apart upon approaching the islands. But a recent paper in the Bulletin of the AMS reveals that such intense tropical cyclones menace Hawaii more frequently than previously thought.
Hurricane Lane as of Thursday morning local time was packing sustained winds of 130 mph with gusts topping 160. Its expected track (below) is northward toward the middle islands today and early tomorrow, followed by a sharp left turn later Friday. When that left hook occurs will determine the severity of the impacts on Maui as well as Oahu, home to Hawaii’s capital and largest city, Honolulu. Although Lane is expected to slowly weaken due to increasing wind shear aloft, it appears that the Big Island of Hawaii, Maui, Molokai, and Oahu will be raked at a minimum by tropical storm winds gusting 55-70 mph, pounding surf, and heavy, potentially flooding rain. Hurricane conditions on these islands also are possible.

Three-day track forecast for Hurricane Lane's approach to Hawaii.
Three-day track forecast for Hurricane Lane’s approach to Hawaii (Central Pacific Hurricane Center).

The last major hurricane to affect the islands with more than swells and heavy surf was Hurricane Iniki in 1992. It was passing well south of the islands when an approaching upper-air trough brought in steering flow out of the south, and Iniki made a right turn toward the western islands while intensifying into a strong Category 4 hurricane. It slammed directly into the garden island of Kauai with average winds of 145 mph and extreme gusts that damaged or destroyed more than 90 percent of the homes and buildings on the island. Iniki obliterated  Kauai’s lush landscape, seen in its full splendor in such movies as Jurassic Park, which was filming there as the storm bore down.
The only other known direct hit on Hawaii was by 1959’s Hurricane Dot, which was a minimal Category 1 storm–the winds barely reaching threshold hurricane intensity of 74 mph when its center crossed Kauai. Without any prior record of major hurricane landfall, Iniki was not just rare, it was considered unprecedented.
Until now.
More than a century before Iniki, a major hurricane crashed into the Big Island, its intense right-front quadrant passing directly over neighboring Maui, causing widespread devastation on both islands. Its discovery is outlined in Hurricane with a History: Hawaiian Newspapers Illuminate an 1871 Storm, which details the narrative thanks to an explosion of literacy on the islands in the mid 19th century, which led to hundreds of local language newspapers that published eyewitness accounts of the storm.
Map showing the reconstructed track of the Hawaii hurricane across the eastern islands of Hawaii and Maui on 9 Aug 1871. Labeled red circles indicate the approximate time and location of the core of the storm. Green shading shows terrain altitude every 2,000 ft (610 m).

The new historical research, published in the January 2018 BAMS, found unequivocal evidence of an intense hurricane that struck August 9, 1871, causing widespread destruction from Hilo on the eastern side of the Big Island to Lahaina on Maui’s west side. A Hawaiian-language newspaper archive of more than 125,000 pages digitized and now made publicly available along with translated articles contained account after account of incredible damage that led the paper’s authors to surmise that at least a Category 3 if not a Category 4 hurricane hit that day.
The paper’s analysis is put forth as “the first to rely on the written record from an indigenous people” of storms, droughts, volcanic eruptions, and other extreme natural events. Accounts published in Hawaiian newspapers create a living history of the 1871 hurricane’s devastation, as recounted in the paper:
“On the island of Hawaii, the hurricane first struck the Hāmākua coast and Waipi‘o valley. The following is from a reader’s letter from Waipi‘o dated 16 August 1871:”

At about 7 or 8 AM it commenced to blow and it lasted for about an hour and a half, blowing right up the valley. There were 28 houses blown clean away and many more partially destroyed. There is hardly a  tree  or  bush  of  any  kind  standing  in  the  valley (Pacific Commercial Advertiser on 19 August 1871).

“An eyewitness from Kohala on Hawaii Island wrote the following:”

The greatest fury was say from 9 to 9:30 or 9:45, torrents of rain came with it. The district is swept as with the besom of destruction. About 150 houses were blown down. A mango tree was snapped as a pipe stem, just above the surface of the ground. Old solid Kukui trees, which had stood the storms of a score of years were torn up and pitched about like chaff. Dr. Wright’s mill and sugarhouse, the trash and manager’s residence, were all strewn over the ground (Ke Au Okoa on 24 August 1871).

“On Maui, newspaper reports document that Hāna, Wailuku, and Lahaina were particularly hard-hit. A writer in Hāna described the storm:”

Then the strong, fierce presence of the wind and rain finally came, and the simple Hawaiian houses and the wooden houses of the residents here in Hāna were knocked down. They were overturned and moved by the strength of that which hears not when spoken to (Ka Nupepa Kuokoa on 26 August 1871).

“In Wailuku the bridge was destroyed:”

… the bridge turned like a ship overturned by the carpenters, and it was like a mast-less ship on an unlucky sail.” (Ka Nupepa Kuokoa on 19 August 1871).

“From Lahaina came the following report:”

It commenced lightly on Tuesday night, with a gentle breeze, up to daylight on Wednesday, when the rain began to pour in proportion, from the westward, veering round to all points, becoming a perfect hurricane, thrashing and crashing among the trees and shrubbery, while the streams and fishponds overflowed and the land was flooded (Pacific Commercial Advertiser on 19 August 1871).

The BAMS paper concludes that the 1871 hurricane was “a compact storm, similar to Iniki.” Honolulu escaped damaging winds or rain despite such a close encounter.
Because such historical records have been unnoticed for so long, the paper notes “a number of myths have arisen such as ‘the volcanoes protect us,’ ‘only Kauai gets hit,’ or ‘there is no Hawaiian word for hurricane.’”
Today’s powerful Hurricane Lane and the newfound historical records go a long way to dispelling these misconceptions about the threat of hurricanes in the Hawaiian Islands.
 

Epic Blizzards Paralyzed New England, Midwest 40 Years Ago

By Chris Cappella, AMS
It began with a whisper. And ended in smothered silence for millions.
 

Cars and trucks stuck in snow on Route 128 near Needham, Massachusetts, following teh Blizzard of '78.
Cars and trucks stuck in snow on Route 128 near Needham, Massachusetts, following the Blizzard of ’78. Source: U.S. Army Corps of Engineers
Slideshow of blizzard photos.

 
I’ll never forget seeing tiny snowflakes blowing down Ocean Avenue in our small sea-side suburb of New Haven. In my hometown of West Haven, on the south shore of central Connecticut overlooking Long Island Sound, when snow fell it usually just stuck, firmly. On everything. The relative warm ocean water often changes our winter events to miserably cold rain. It never allows for dry, powdery snow. Or so I thought. Today—February 6, 1978—would be different. Far, far different. Than many of us hearty New Englanders, as we’re known, had ever seen. For that silky soft sinewy snow I was seeing in the infancy of this storm would grow into a furious blizzard and bury the region—a blizzard by which all others there since would be measured.
The tiny flakes blew into snowy tendrils that would side-wind down the road until they escaped the wind. And pile into miniature snowdrifts. A harbinger of things to come, but on a gigantic scale. This was the beginning of the epic Blizzard of ’78 in New England. Over the next 30+ hours, the snow would fall heavier than anything I—and most of us in the Northeast—had ever experienced. Sideways snow. Two to three inches an hour. For hours and hours. Blowing in winds gusting over 50 mph region-wide, and to hurricane force along the coast. 110 mph Scituate, Massachusetts. Snow so deep even as a 12-year-old I would struggle to walk in it. Drifts so large and deep they dwarfed entire houses. You could jump off second-story rooftops into them. And my friends and I did. Off our grammar school roof. Even its 45-foot high gymnasium roof. Weightless, for a second or two. And then: whump! We’d completely disappear in snowdrifts 10-15 feet tall.
Buried barely begins to describe the otherworldly landscape. Nearly all human life in the region would slow down and eventually grind to a halt. Thousands of people stranded on roadways as blinding snow enveloped everything, too quickly to make an escape. Governor Ella T. Grasso ordered all vehicles off the roads. We capitalized on it. Building giant snow forts with tunnels in the mountains of snow piled on sides of our road. Only once, though, did we recklessly dive into our snow tunnels to escape an oncoming snowplow. Luckily for us kids the snowplow only took out the last 3-4 feet of our tunnels, sparing us certain death. By snowplow.
Legendary Boston meteorologist, Harvey Leonard, who was just 29 then, remembers seeing “big potential” for a major snowstorm coming together in the Northeast four days beforehand—a lead-time “close to unheard of” in those days, he told The Boston Globe in a recent article chronicling the blizzard.

“As a person — not only a meteorologist, but somebody who really loves weather and is fascinated by storms, particularly winter storms — it was pretty amazing to see what was unfolding. ‘78 still stands as the most powerful and wide-reaching storm that I’ve ever been involved in forecasting and experiencing.”

The defacto “official” website devoted to the storm—blizzardof78.org—put together by amateur historian Matt Bowling describes how a failed forecast weeks earlier set up a situation in which people headed to work and school that Monday morning, February 6, as if just a routine snowfall was expected.

It is safe to say that by the time February 6th, 1978 came along, New Englanders had been pretty-well trained to not pay much attention to the weathermen. It had been a difficult winter already. On January 21st, as most forecasters predicted only rain, New England had been blanketed by a major league snowstorm that dropped 21 inches of snow in Massachusetts and downed a record number of power lines in Rhode Island.   This forerunner to the Blizzard of ’78 had brought so much snow that the roof of the Hartford Civic Center actually collapsed from the weight. When forecasters began predicting another big storm, nobody thought too much of it.

In a series of quotes gathered and posted to the site, WTNH-TV meteorologist and Western Connecticut State University professor Dr. Mel Goldstein continues this theme, describing why there was skepticism about the forecast for the storm:

Back in 1978 we did not have the accuracy of the computer models that we have today. And in 1978 there was a brand new computer model that came out and it was predicting the storm to be pretty much the magnitude it turned out to be. But because the computer model was brand new, people did not have confidence in it. And so there was some question whether or not people wanted to buy into the kind of product that it was delivering. To me it looked very reasonable … and I took my little bag of clothes and I moved into Western Connecticut State College weather lab and I said, ‘I’m going to be here for a few days and there’s no question about that. It’s in the logbook on that day: ‘a granddaddy of a snowstorm is coming our way.’

And in another Boston Globe article, noted weather columnist David Epstein wrote four years earlier about The meteorology behind the blizzard of February 6-7th 1978. In his article he reiterates how so many were caught off guard by the blizzard.

Computer models were still relatively new and a series of busted forecasts left many people skeptical that a big storm was actually coming. On the morning of the 6th, snow was suppose to start prior to the morning commute. However, when folks awoke and saw the snow hadn’t begun many of them decided it was another busted forecast and went to work. These same people would then try to get home that afternoon while the blizzard was fully underway.

A search on YouTube turns up numerous documentaries on the Blizzard of ’78, including “Blizzard of ’78,” below, on Leonard’s station WCVB.

Remarkably, New England’s Blizzard of ’78—with its record snowfall observations in Boston and Providence and its utter destruction along the Massachusetts coast as powerful winds slammed monster waves ashore through four tide cycles—came on the heels of a nearly equally intense blizzard that slammed the Midwest on January 25-27. That Blizzard of ’78 became known as the White Hurricane, with wind gusts of 100 mph and feet of snow shutting down states from Wisconsin to Ohio. It set pressure records (956.0 mb in Mount Clemens, Michigan—third lowest non-tropical atmospheric pressure ever recorded in the Unites States) and remains the worst blizzard on record in Ohio, Indiana, and Michigan.

Surface weather analysis of the Great Blizzard of 1978 on 26 January 1978. Source: NOAA

 
Its magnitude was summed up in a statement by NWS Detroit meteorologist C. R. Snider on January 30, 1978:

The most extensive and very nearly the most severe blizzard in Michigan history raged January 26, 1978 and into part of Friday January 27. About 20 people died as a direct or indirect result of the storm, most due to heart attacks or traffic accidents. At least one person died of exposure in a stranded automobile. Many were hospitalized for exposure, mostly from homes that lost power and heat. About 100,000 cars were abandoned on Michigan highways, most of them in the southeast part of the state.

Nearly three dozen times as many cars abandoned—and that was in just one Midwestern state.
To some, Blizzard of ’78 conjures up memories of a similar yet completely different storm.