If Climate Isn't Stable, Are We?

by William Hooke, AMS Policy Program Director
a portion of a series of essays from the AMS Project, Living on the Real World
In a short period of time (say, one or two hundred years), the human race has greatly grown in total numbers; has radically increased its per capita use of resources of every type; and has accelerated the rate of social change and scientific and technological advance.
In a short period of time? In science, a statement like that invites, maybe even demands a comparative. Short compared with what? Now you and I might look at this and say, “Well, a couple of hundred years is short compared with the age of the Earth itself, or with the ten thousand years of human civilization.” But here’s an additional list: Human success has occurred in a time short compared with

  • time scales of (“major”) climate variability;
  • the recurrence interval for natural extremes;
  • the time required for the emergence of unintended consequences;
  • the time required to prove we can “keep it up;”
  • the time required for the implications of our success to sink in.

Each of these realities enables us to make a prediction about a different aspect of our future. Let’s look at the first: time scales of (“major”) climate variability
In the climate-change debate, much has been made of this, by both sides. The Earth’s climate has at times over the past few billion years been at times much colder, and at other times much hotter, than it is today. But during the last two hundred years, the time of this extraordinary human success, climate has been fairly stable.
If climate hadn’t been so stable during this period, then we might not even have the word “climate” in our vocabulary. We wouldn’t think the concept was useful! And arguably, we might have been better off! Think a little bit about this. Suppose you’re in a job where you directly see the impact of weather on your labors. Such jobs are in the minority these days, but they matter – a lot. Take farming. To oversimplify: you want to base your decisions throughout the year on the weather – what to plant, when to plant, when to water, when to apply pesticides and fertilizers, when to harvest. But you have to make many of these decisions based on a time horizon much greater than any useful weather forecast.
Then it occurs to you. Although the weather is variable year to year, these variations occur around a set of average conditions: the average last frost of the spring, the average spring rain, the average summer temperature and sunlight, the average first frost of the fall, etc. So you go with that, and it helps. Then, as you start looking into it more closely, you realize that the average you calculate depends upon how many years you include in the calculation: do it for the past ten years, and you get one set of answers. Do it for the past twenty and you get another. Do it for ten years, but for a different ten years, and you get another answer still. Your head starts to spin…
Meanwhile, over this same period of 200 years, while the human race has been on a roll, scientists have made some remarkable discoveries. They started looking hard at glaciers and the landscapes around them and discovered that ice, as much as a mile thick once covered much of the Earth, as recently as 10,000-20,000 years ago. Whoa! And they discovered looking back that at times the entire Earth must have felt tropical – that it was hot and steamy pretty much everywhere. Who knew? So the reality is that the Earth and its atmosphere and its weather are resolutely variable, on all time and space scales. From the standpoint of coping with climate variability and change of whatever cause, we might be better off simply asking questions like: how and in what ways are temperature and rainfall patterns, etc., likely to change over the next few hours? The next few days? The next few centuries? We’d be making no artificial distinctions between weather and climate (certainly nature doesn’t draw any such line of demarcation). Scientists are working hard on all this! The stakes of getting the right answers for the right reasons couldn’t be higher.
In any event, for the past two hundred years, the climate has been remarkably stable. This narrow range of climate variability hasn’t challenged us so greatly. Humanity has been able to take the easy way out. We have tuned our decisions and actions in weather-sensitive sectors like agriculture, water resource management, energy-demand, transportation etc., to a rather narrow range of climatic variables. And we’ve been lucky! It’s worked so far.
But we know from the science that climate is constantly changing, in part just because of the nature of the atmosphere and oceans, but in part because we’re tinkering. We’re taking all that carbon that plant life took out of that tropical atmosphere from millions of years ago and deposited into sediments – and we’re burning it and putting it back into the atmosphere. It’s looking like our winning streak is about to play out.
This leads to a prediction: The future will be characterized by adverse climate shifts. We don’t know exactly how much, and we don’t know when. But we do know this. We won’t like them! We’ll view them as unfavorable. Why? How do we know they won’t be to our liking? Because we have tuned our climate sensitive activities – our human settlement and water use, our agriculture, our energy production and use, and many other aspects of our daily lives – to a narrow range of climate conditions.
Note that this disaffection will be true whichever way the climate changes. When and where it gets wetter, we’re going to wish it were drier (I planted wheat instead of corn. I wish I’d planted corn!). Where it gets hotter, we’re going to wish it were cooler (ski season in Colorado is shorter than it used to be; I invested in my resort hotel at just the wrong time). Where it gets cooler, we’re going to wish it were warmer (Brr! My condominium heat pump here in Georgia isn’t up to this cold snap). When things dry up, we’ll long for the moisture (our hydroelectric power in the Pacific northwest is no longer meeting as much of our energy needs).

Uncertainty: A Mathematician's Perspective

by Sean Crowell, Dept. of Mathematics, Univ. of Oklahoma
One thing we enjoy in mathematics is certainty of our knowledge. This is because the things we know are logically certain (neglecting Gödel), and logic is all there is for mathematicians. In fact, unjustified certainty can be very disturbing to professors attempting to teach you to prove things rigorously in foundation courses. Never mind all of the debate in recent years about the philosophy behind these things. Most of us have some inner threshold beyond which we say “the definitions and axioms are satisfied, and so the theorem is proven!”
For a long time I had heard applied mathematics described as “messy.” Really this meant that the calculations done were unpleasant, or the proofs were complex and tedious and inelegant. But I’ve discovered a far more terrifying aspect about this work, one which nonmathematicians take in stride.
There is no certainty in science. There is merely evidence. Again, we have an inner threshold, only once it’s crossed, we say “I now believe the conjecture supported by the evidence.” How is this different from logical proof? The biggest difference is that we have no perfect measuring stick to go by. All data has errors in it. All models are flawed. And yet, through a mysterious bootstrapping process, data is used to improve models, which is used to improve observational techniques and to tell researchers what they should be observing.
The casual and especially mathematically trained reader will shake their head and say “Errors upon errors! How can we say we know anything?” At this point we can trot out statistics that point to the advance of science. Warning times for severe weather have gotten much better due to this process. New particles have been discovered by this process. Diseases cured and sheep cloned. All using noisy data and imperfect models. It works! For whatever reason, the universe that we can interact with, though mysterious, is far more regular than irregular. If we watch long enough, we can uncover its secrets.
(Editors’ note: This post was first published on Sean’s blog, A Mathematician in a Meteorologist’s World, on Wednesday 15 September. We liked it too much to merely excerpt it. Sean is a doctoral candidate in mathematics studying tornadic flow.)

Recreational Tornado Chasing: the Psychology of Risk

Who seeks the thrill of nature at its most beastly? Researchers at the University of Missouri’s School of Natural Resources surveyed people who sign up for tornado chasing with five different tour companies in Tornado Alley and found that:

  • 62 percent are male
  • 63 percent were single.
  • The mean age was almost 42.
  • More than 25 percent had an advance degree.
  • 33 percent earn more than $100,000 per year
  • More than half are visiting from outside the United States: one-third from Europe, 13 percent from Canada (although one company cooperating in the study chased in Canada), and 11 percent from Australia.

We know that chasing is a hobby that is hard to shake. Not all these tourists are newbies: 53 percent had previous chasing experience and fewer than half of those had done so with a tour company, yet over 30 percent of those with chasing experience had seen a tornado before. 68 percent said they would be willing to spend money on another chase tour.
In a Master’s thesis based on the study, Shuangyu Xu builds psychological profiles of people based on “sensation-seeking” scales of behavior that might identify motivations for chasing tornadoes (asking questions about, for example, predilections for strange foods, comfort with people who are different, and predilection for restlessness). Previous studies had used similar psychological tools to investigate mountaineering, sky diving, white water rafting, and other high risk recreation. The storm chasing tourists scored very moderately on these tests for sensation-seeking behavior.

[H]ang-glider pilots (Wagner & Houlihan, 1994), mountain climbers (Cronin, 1991), skiers, rock climbers, white water kayakers, and stunt flyers (Slanger & Rudestam, 1997) displayed high levels of sensation seeking across all dimensions. These results may suggest that recreational storm chasers are different from other risk recreation activity participants, especially because their personalities seem to be more drawn to new experiences rather than the risks involved.

The tourists professed to sign up to be near nature, to witness natural power and beauty, and to learn about tornadoes. They were not generally doing it to impress people or do something extraordinary, and only moderately interested in the thrill, danger, or risks.
About half of the tourists were able to see a funnel cloud on their trip (and almost 35 percent saw a tornado on the ground). Interestingly, though, while nine companies originally agreed to distribute surveys to customers, four ultimately did not, citing inadequate weather and challenging economic conditions. Maybe the real risk takers here are not the tourists but the tour operators, who put their financial well-being at the mercy of both the business climate and the weather.

Not Seasick…Science Smitten

What if you are asked to be part of a scientific expedition aboard a non-luxurious research vessel, surrounded by complete strangers, forced to face rough seas – and sea sickness, 16 hours’ work shifts, no weekends or recreational activities, no days off, lots of hours under the sun working with scientific equipment, poor internet connectivity and no interaction whatsoever with the outer world? While many people would say: “no thank you”, I was euphoric when I received an email which first line read: “Congratulations, you have been selected as a participant of the Sixth Aerosols and Oceans Science Expedition”.

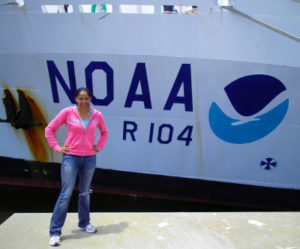
So begins Mayra Oyola’s engaging story of work aboard the NOAA research vessel Ronald H. Brown for the AEROSE campaign

Beside The Ronald H. Brown.

under the auspices of Howard University, NOAA, and other institutions. It was apparently a love affair not just with the science and the sea, but with a lidar, too:

[E]very scientist is …assigned at least one particular instrument and is expected to become the one and only expert on that matter.  In a sense, every scientist establishes a sort of “bond” with his/her assigned instrument that is very similar romantic affair. You can grow such a strong love and hate relationship with it. There are days when you two can get along just fine. But other days you have to fight against temptations (like throwing it overboard or smashing it with a sledge hammer). There are days when your appointed instrument gets seduced by Murphy (in other words, goes haywire) and you have to make him/her understand that s/he is in a monogamous relationship with you.  As some partners, these instruments can be gold diggers (they cost hundreds/thousands of dollars) and are high maintenance as well.

And, this enticing view of the ocean:

When people say I must be crazy to have loved so much sailing on this expedition, I just ask them a couple of questions: Have you seen bioluminescence or done some fishing in the middle of the Atlantic basin? Or have you ever had the chance to catch a movie under the stars in the middle of the Sea? Well, I had.  There are some great perks about sailing on the Brown. There is nothing as beautiful as lying on deck at night for the most spectacular stargazing sessions you will experience in this world.  There are unusual things that you will never see in your everyday life: like watching a double rainbow or the most impressive towering cumulonimbus cloud EVER at the Intertropical Convergence Zone (ITZC). I also loved watching different marine life forms like the flying fishes, dolphins and squids (oh yeah, we saw squids!). Oh and the sunsets… sunsets that will take your breath away!….But the highest reward is this:  we get to do REAL science to solve REAL problems, such as improving the quality of satellite operations,   understanding the effects of aerosols in hurricane formation and intensification and learning how tropospheric ozone can be linked to global warming, among many other things. There is nothing that can top that!

Check out the full story, and picture gallery, here, and kudos to Oyola for such drawing a compelling portrait of science at sea. We talk about the need to communicate science, and we’ll talk more about it as the Annual Meeting approaches, but she’s set a strong example already.

NOAA Names Regional Climate Services Directors

Commerce Secretary Gary Locke announced the selection of six new NOAA regional climate services directors. According to NOAA Administrator Jane Lubchenco:

NOAA’s new regional directors are liaisons to state and regional users and providers of climate science and information; they will also bring information from the regions back into NOAA. They will work with our many partners to identify new and emerging regional climate issues and help NOAA develop products or services to address issues like local climate forecasts, drought plans or flood risk mapping.

The new directors will be stationed at the respective National Weather Service regional headquarters work for the National Climatic Data Center. They are:
Eastern Region: Ellen Mecray
For the last four years, Mecray led strategic planning for NOAA’s Office of Oceanic and Atmospheric Research  and facilitated  inter-and intra-agency dialog and collaboration on climate science in New England. She is the lead for the North Atlantic Regional Collaboration Team’s Climate sub-team which consists of 20 people representing all of NOAA’s line offices and key regional partners. Prior to joining NOAA, Mecray was an

Read more

"Media" Is Short for "Meteorology"

Studies of local TV news have been telling us this story for years: weather is what drives people to the media. Now, Nielsen Co. is saying the same thing about smart phone applications use. Weather app downloads rank near the top for all platforms.
Here’s a chart from their study, announced today at the AppNation conference in San Francisco, as reported by SDTimes.

National Climate Assessment Welcomes Your Comments

The US Global Change Research Program published its “US National Climate Assessment Objectives, Proposed Topics, and Next Steps” (also available here in html) in the 7 September 2010 issue of the Federal Register.
The program requests public comments on this document, which describes the objectives of the National Climate Assessment (NCA) process, provides an outline of the next NCA synthesis report (scheduled for publication in June 2013), and describes the next steps in planning for and implementing the NCA process.
Public comments on this document will be evaluated and, if appropriate, used to inform the NCA structure and process. Updates on the NCA structure and process will be posted on the NCA web site as they are available. Comments will also be provided to the Federal Advisory Committee for the NCA, the “National Climate Assessment Development and Advisory Committee,” when it is constituted this fall. All comments will be collated and posted on the NCA Web site.
Please submit comments here no later than 11:59 PM EST, October 8, 2010.

Art Gets Meteorological

Lawrence, Kansas, has been an epicenter of serious weather in the past–dating back at least to a killer tornado in 1913 and with numerous others documented there or nearby since.
An art show where you shouldn't forget to look up.Right now, however, Lawrence has got to be the epicenter of the weather-art world. First an ongoing exhibit through October 4 at the Lawrence Percolator gallery entitled “Clouds Are Easy to Love” features works on the walls–and ceiling–inspired by things meteorological. Channel 6 Meteorologist Jennifer Schack gave a talk at the gallery about the science of clouds.
Meanwhile, a “flash” exhibit in a vacant downtown retail space lasting less than a month, through the end of this week, is featuring some cerebral and sensory explorations of themes that ought to sound familiar: “explores the material attributes of the passage of light and its blockage (through opacity and diffusion)…”
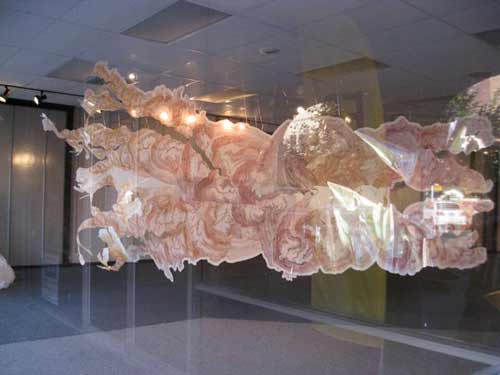
Called “TRANS*parent TRANS*lucent,” the show at 739 Massachusetts St. in Lawrence features a drawing/painting on suspended mylar called “Meteorology,” by Linnea Spransy. Writes reviewer Ryan LaFerney,

"Meteorology," by Linnea Spransy.

[Spransy’s] work is about working within boundaries. She creates predetermined systems, underlying grids that her drawings and paintings are formed from. These grids serve as boundaries to be utilized and traversed. From these grids, which are determined by the artist, Spransy draws one single continuous line that blossoms into a labyrinth of molecular-looking abstractions. For Spransy, these limits generate surprise and even freedom. Meteorology is no different. The only difference is the physicality of the piece. It is experiential, like all of her

"Maelstrom," by Linnea Spransy.

work, but warrants a visceral response and physical interaction. Suspended from the ceiling, Meteorology, outstretched in transparent layers, reaches out to engulf the viewer. It is an inviting work that calls one to investigate the whirlwind of orderly detail from both sides ….The viewing experience is rendered not as one of solitude but as one best experienced in good company. Spransy ends up giving value both to the creative act and to community.

Sounds a lot like some atmospheric scientists we know. A sampling of Spransy’s  meteorologically oriented works, from her web site confirms the connection.

"Weak Potential Energy," by Linnea Spransy

"The Spectra of Light Emitted," by Linnea Spransy

"The Quantized Values of Angular Momentum," by Linnea Spransy.

The Rise of Mountain Meteorology

Mountains are already hard to miss, often hard to avoid, but in meteorology their prominence is only growing right now, according to John Horel and David Whiteman, chairs of last week’s AMS Conference on Mountain Meteorolog. Whiteman pointed in particular to new opportunities for modelers and observationalists to work together, bringing in new people to the field:

We’ve found over time that the models have improved at a faster rate than the observational equipment has improved, so what we tend to find is that there are people who are able to make their models work on smaller length scales but they find that they don’t have the observations to really evaluate how well the models are working. That’s been good for our community because we’ve also now been able to have a number of programs that combine these high performance models with an observational program….For the first time we can start to look at the very small features.

For more of Whiteman and Horel’s discussion with The Front Page, check out these video interviews (with apologies to John for the brilliant Sierra light in Squaw Valley!) from the AMS YouTube Channel, Ametsoc:


And for a more “down in the trenches” view of mountain meteorology (come to think of it, a rather nice view from the resort patio, between sessions), here’s another interview, with Thomas Chubb, Neil Lareau, and Temple Lee, recently uploaded to Ametsoc on YouTube:

How Much Was That Forecast Worth?

Despite the general good fortune that the storm stayed out at sea, there are plenty of grumblings about the cost of Hurricane Earl and more specifically the cost of preparing for it:

Last week’s storm was forecast to be the strongest to hit Long Island’s East End in nearly twenty years. And to handle possible outages, the Long Island Power Authority brought in 1,600 workers from out of state, at an estimated cost of $30 million. LIPA’s budget — already reeling from combating four major storms earlier this year — is now even further in the red.

(Fortunately, LIPA wisely understands the risks that Earl posed:

However, because the storm was supposed to hit such a wide area, LIPA says if it had to do it all over again, it still would’ve brought in those extra workers.)

And further north:

Airlines canceled dozens of flights into New England, and Amtrak suspended train service between New York and Boston….Massachusetts officials estimated that Cape Cod lost about 10 percent of its expected Labor Day weekend business, but were hopeful that last-minute vacationers would make up for it. Gov. Deval Patrick walked around Chatham on Saturday morning, proclaiming, “The sun is out and the Cape is open for business.”

So, as a palliative while people continue to grouse about paying the costs of meteorological uncertainties, read Mike Smith’s post about the savings this time when 450 miles of coastal warnings were issued compared to the much broader-brush (1,500 coastline miles warned) for Hurricane Floyd in 1999.

Instead of warning the entire East Coast as we had to during Floyd, the science of meteorology correctly identified that only the two areas (outer banks and far east Massachusetts) were at risk and warned accordingly. The forecast change in Earl’s direction of movement and rate of weakening were both remarkably good considering this forecast was two days out.

Taking NOAA’s calculations for evacuation costs per mile of coastline, and a reduction of 1,050 miles of warnings in similar situations, and do the math:

OK, now take those 1,050 miles and multiply them by a conservative figure of $700,000 in savings for each mile that correctly was not warned = $735 million dollars! ….And, when you figure in the value-added private sector hurricane forecasts issued by companies like WeatherData and its parent company AccuWeather, the savings grow further, perhaps approaching a billion dollars in total when the correct landfall forecast for Canada is factored in.

Clearly this depends on whether people actually evacuated based on the warnings, but the progress is clear, nonetheless, as are the positive benefits of recent improvements in track forecasts.