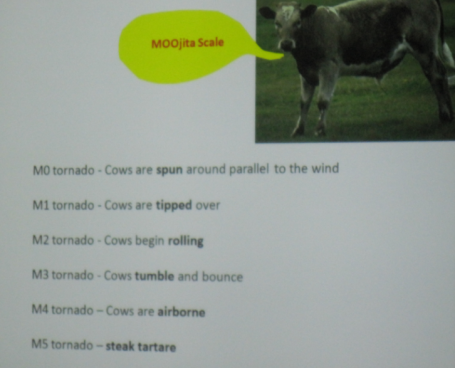
Moove Over, Dr. Fujita!

Thanks to Paul Douglas and D.J. Kayser for a report on Josh Wurman’s presentation at St. Cloud State University about the Doppler on Wheels project (based at the Center for Severe Storm Research in Boulder, Colorado).

Dr. Wurman explained that since the DOW project started about 15 years ago, the vehicles have seen between 160-170 tornadoes, about 15-20 of them with the VORTEX 2 project which was aimed at better understanding tornado formation and to hopefully push the lead time out for tornadic storms. Part of Dr. Wurman’s research is also to study the lower level winds of a tornado in hopes to come up with an even better Fujita Scale (yes, different from the current Enhanced Fujita Scale) and hopefully be able to better warn areas that would be impacted by tornadoes, especially since there is currently little ability to forecast the intensity, duration, and size of tornadoes, unlike we can with hurricanes.

Even with that kind of experience it doesn’t look like Wurman’s udder tornado scale will be putting Fujita’s version to pasture any time soon.

NWS sez 'Hi' to Fort Worth on Facebook

The National Weather Service is on Facebook (so is AMS, actually). But you knew that already. What’s new is that now the NWS is trying out Facebook as a local-level communications tool. The Fort Worth, Texas, office has a new page to raise weather awareness locally. If weather turns ugly, it might become an important additional channel between meteorologists and the public.
Writes one commenter, “About time you guys got on here.” But actually, social media and government weather services have had a somewhat tempestuous relationship so far, even with the undeniable popularity of the national NWS fan page.
At least one NWS employee already had tested the waters on his own: in an April 30 severe weather outbreak one local forecaster in Arkansas was posting weather updates on a private Twitter account, minutes before the same information made it to TV screens. In response the Weather Service reiterated its policy against employees using unofficial communication channels for official business, effectively prohibiting social media for local weather communications.
More recently, the head of forecasting at Taiwan’s Central Weather Bureau, Ming-Dean Chen, used his personal Facebook page to distribute typhoon information hours in advance of the official notices from his own office. He expounded on possibilities that weren’t discussed in the official forecasts. Chen ended up apologizing to superiors, but pointed out that he was merely repeating information that had already been posted on the Japan Meteorological Agency web site anyway.
Renegade incidents seem less likely now that NWS is cautiously dipping an official toe in Facebook waters for local purposes. They could start a tidal wave, however, if they don’t proceed judiciously. Digital Meteorologist blog points out that a strong social media presence by local NWS offices might rapidly erode the long-held niche broadcast meteorologists have enjoyed by combining local weather knowledge with direct access to the public.

Sure, the US government is slow, but what happens when it finally catches up?  #NWS could be a pretty powerful hashtag….Poke the bear if you want.  Just make sure you are ready to run when he wakes up.

No One of Us Can Solve the Whole Problem

by William Hooke, AMS Policy Program Director, from the AMS Project, Living on the Real World
“Go to the ant, you sluggard; consider its ways and be wise!”
This Biblical proverb warns against laziness, and exhorts each of us to higher levels of diligence and industry. A good idea! However, there’s more here. The ant also demonstrates the power of effective policy. Before turning to the ant, a brief segue…
Have you ever watched a flock of birds? (Or, equivalently, a school of fish?) Scientists are getting clever about why birds (and fish) exhibit such behavior. The motives are apparently social and include protecting against predators, staying warm in winter, and sorting out dominance. But how do they do it, given that they’re under the control of birdbrains? We don’t know for sure, but here you will find a video of “boids”: what flocking would look like if birds operated on the basis of three rules:

  • matching speed and direction with nearby birds
  • maintaining a minimum separation, to avoid in-flight collisions, and
  • always flying toward the center of the flock

The rules seem pretty simple, don’t they? Reading them, it’s pretty easy to imagine that birds are able to operate, and cooperate, on this basis. And sure enough, the video looks pretty realistic, doesn’t it? In essence, flocking birds seem to have a policy, a framework for making decisions. By the way – and this is important to tuck away for later – this kind of behavior is called “emergent.” If you study a few birds in the laboratory, you would never know about this ability. It’s only when birds are present in large numbers, and free to behave as they want, that this behavior emerges. If you’ve got the time (six minutes), check out this YouTube video: starlings on Otmoor to see flocking in its fullest grandeur:

But back to the ants. Though birdbrains are the subject of ridicule, birds are mental giants compared with insects. And ants exhibit their own emergent behavior, don’t they? Again, study

Read more

If Your Climate Cup Runneth Over

Processing the endless stream of weather data can be a little like drinking from a fire hose. So designer/artist Mitchell Whitelaw has found a new way to civilize information intake.

measuring cup
"Measuring Cup," by Mitchell Whitelaw, showing at the Object Gallery in Sydney, Australia.

“Measuring Cup” is formed using 150 years of monthly average temperatures for Sydney, Australia. Says Whitelaw,

The structure of the form is pretty straightforward. Each horizontal layer of the form is a single year of data; these layers are stacked chronologically bottom to top – so 1859 is at the base, 2009 at the lip. The profile of each layer is basically a radial line graph of the monthly data for that year. Months are ordered clockwise around a full circle, and the data controls the radius of the form at each month. The result is a sort of squashed ovoid, with a flat spot where winter is (July, here in the South).

Whitelaw decided to smooth the data with a five-year moving average “because the raw year-to-year variations made the form angular and jittery.” The result is not only aesthetically pleasing but functional due to climate change:

The punchline really only works when you hold it in your hand. The cup has a lip – like any good cup, it expands slightly towards the rim. It fits nicely in the hand. But this lip is, of course, the product of the warming trend of recent decades. So there’s a moment of haptic tension there, between ergonomic (human centred) pleasure and the evidence of how our human-centredness is playing out for the planet as a whole.

In other words, don’t sip from your own data unless you can show a perceptible warming.

Overheating in Cars

The September Bulletin of the American Meteorological Society features an article with a new table showing how fast the inside of a parked car can heat up if left with the windows closed. The data comes none too soon.
A small Kansas-based nonprofit, Kids and Cars, says that already this year, 48 children have died of hyperthermia in cars in the United States. This is a new record in the 13 years statistics have been available. An average of 37 children in the United States die each year from hyperthermia in cars.
It’s tempting to blame the spike in deaths (there were 33 last year) to the record heat in various parts of the country, but Jan Null, a CCM with Golden Gate Weather Services, cautions that hyperthermia in vehicles is a danger with or without record heat waves:

I think from the small 13-year sample that we have that probably from a statistical basis, this is within the range of what you would expect. It’s impossible, I think, to associate it with the weather totally. Is weather a factor? It’s always a factor.
According to the BAMS article, the interior air temperature of the vehicle can rise about 4°C in 5 minutes, about 7°C in 10 minutes, and 16°C in 30 minutes, and 26°C in an hour. Thus after an hour in direct sunlight, the air temperature in the vehicle can reach 57°C (135°F). Authors Andrew Grundstein, John Dowd, and Vernon Meentemeyer hope their research helps educate people about the dangers of hyperthermia to children who sometimes are inadvertently left unattended in cars.
Janette Fennell, founder and president of Kids and Cars, notes that these tragedies are due to ordinary memory error, not bad parenting, and hopes car makers will install warning systems that will alert parents who might have left their kids in cars, just as technology has made it possible already to warn of keys left in the ignition, open trunks, and low batteries. She says people can help themselves by routinely placing their briefcases, cell phones, or other needed items the back seat, near their children, so that they’ll have to look back before leaving the car.

The Toughest Part of Forecasting

The New Zealand MetService’s chief forecaster Peter Kreft writes:

Getting the message out about severe weather, particularly when it involves rapid changes, requires excellent communication with the New Zealand public and many organisations managing weather-related risks. The message needs to be relevant and clear – not always an easy task, given that users of weather information have such diverse needs….In some ways, the challenge of getting the communication right is even more difficult than getting the meteorology right.

After recent events in New Zealand, Kreft should know. For days, the MetService had been tracking developing conditions for severe weather for parts of New Zealand. Then, on Wednesday, September 15, forecasters actually issued an advisory for gale force winds and “bitterly cold” weather several days ahead.
That’s when the other part of forecasting–the tough part- started to go awry. The media made references to a “massive” storm the size of Australia about to go medieval on New Zealand. References to civil defense authorities making preparations for the worst also hyped up the alarm.

[S]hortly after the MetService press release on Wednesday, this communication process was thrown off kilter by a media article about “the largest storm on the planet”. The article was based in part on the MetService press release but included information from other sources as well as a measure of journalistic licence.

Not surprisingly, weather discussion boards, blogs, and more media went haywire. Kreft says the misconstrued warnings went “viral”:

Within a matter of hours, MetService was fielding calls from people concerned about the “massive storm heading for New Zealand” and asking for clarification on various statements that MetService had apparently made. It was clear early on that people were confused about the source of the information they were receiving, and had been misled into thinking that the whole country was in for serious weather.

Not only worried citizens and nervous farmers but even disaster-preparedness authorities got caught in the storm of “mediarology.”

Unfortunately, MetService’s ability to get weather information to those who really needed to know was significantly hampered by media articles over-stating the area affected by the storm.

While severe conditions indeed occurred, the weather, as meteorologists had expected, was not bad everywhere in New Zealand

…leaving many people wondering what all the fuss was about. The danger this raises is that some of those may simply ignore the next Severe Weather Warning they receive.

All in all, it was a good reminder for why the weather enterprise continually needs to foster the partnership between scientists and the media, and ultimately the communication between forecasters and the public.
Subtle, but Sultry: A Fog Story

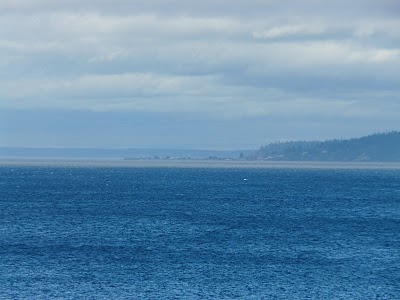
On a day of extremes in the West (with downtown Los Angeles, for example, setting an all-time record high), Cliff Mass posted this fine example of a fog forming as a thin, low-lying layer over Puget Sound.

Fog over Puget Sound, posted on Cliff Mass Weather Blog, from Greg Johnson of www.SkunkBayWeather.com.

Sultry Pacific air was moving in from the southwest. The dewpoints in the Seattle area soared into the high 60s Fahrenheit. Mass explains:

The humidity is so large that there has been some condensation in the form of shallow fog over parts of the Sound…which is cold enough to cause this moisture to condense. Some wind was also helpful, since it mixed the water vapor towards the cold surface.

Walking a Fine Hydrologic Line

by Robert V. Sobczak, National Park Service, Big Cypress National Preserve.
Reposted from his blog, The South Florida Watershed Journal.

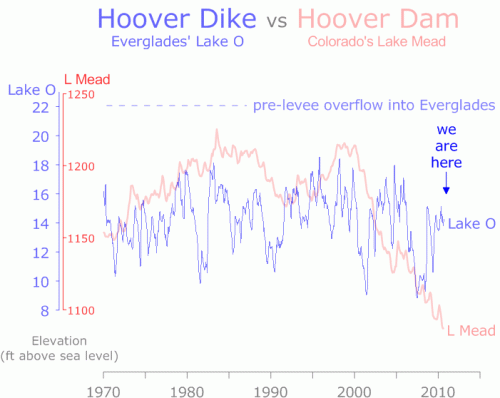
Are Florida’s Lake Okeechobee and Colorado River’s Lake Mead comparable?

After all, a Hoover Dam (or dike) surrounds them both.

Lake O bounces from deep drought to levee-lapping flood stage from one year to the next. We’ve had two deep drops into drought this past decade: the first in 2001 and the second (and longer one) in 2007, plus those couple high years during the hurricane frenzy of 2003-2005.
Keep in mind the difference between extreme drought (9 ft above sea level, 1.7 million acre feet) and extreme flood stage (18 ft above sea level, 5.3 million acre feet) is less than 10 feet.

Compare that to Lake Mead’s decade-long decline:
In 1999 it was flush at over 1200 ft above sea level high and holding 28 million acre feet of water, but has steadily dropped ever since.
Current stage is around 130 feet lower and only 10 million acre feet (and dropping). Here’s a recent article describing how water planners are trying to cope.
Why the difference?
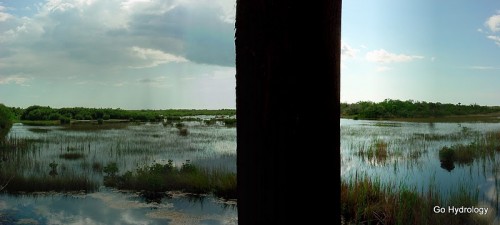
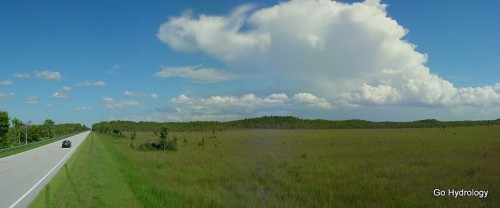
Flat south Florida is rain rich but storage poor, while the arid West has storage galore (with its deep canyons) but not much rain …
And more recently, hardly any snow melt either.

“The drought can’t last forever,” Western water planners seem to think/hope.
Here in Florida, as much as we like seeing those storms veer away “safely out to sea,” the Lake is a couple more near misses and a dry (and warm) La Niña winter ahead from a plummet into spring time drought.
On the other hand, all it takes is one big “rain maker” to send us up into flood stage.
Florida walks a fine line between flood and drought.

Nowcasts: Forecasting's Achilles Heel

by Cliff Mass, University of Washington
Adapted from a post from this weekend on Cliff Mass Weather Blog.
On Saturday we experienced a noticeable forecast failure and one that in some sense was self-inflicted.
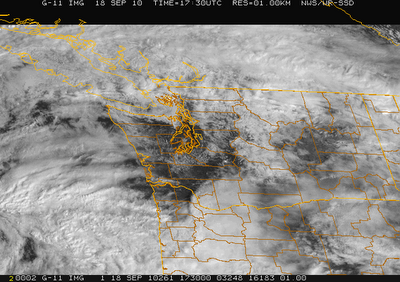
Here in Puget Sound country it was going to be a beautiful day…lots of sun and temps rising into the 70s. You could look outside or view the visible satellite picture.

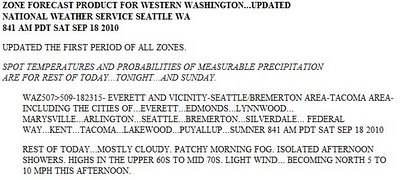
On the other hand the National Weather Service forecast RELEASED THAT MORNING painted a less optimistic picture.
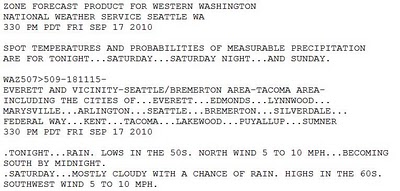
And Friday’s forecast was even more pessimistic.

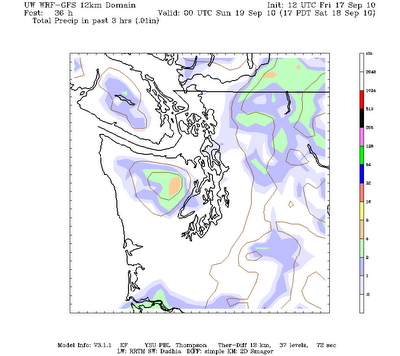
The computer forecasts on Friday showed the break between systems (see example) and certainly on Saturday morning it was clear.

Why didn’t the message about a spectacular break on Saturday get out?
I think there are three main reasons:
1. The National Weather Service forecast cycle is only updated every 6 hr in most cases and there is a lack of emphasis on nowcasting–describing what is happening now and during the next few hours.
2. There is a distinct tendency for the National Weather Service to broadbrush their forecasts–smear out clouds and weather over an extended period and not to put emphasis on breaks in the weather…even when they are pretty obvious.
3. Finally, there is the tendency in the NWS to maintain forecast consistency–staying with the same story–even when new guidance suggests otherwise. This is based on an internal philosophy not to jerk the forecast around as numerical guidance changes.
Personally, I think this all has to change…and in fact this blog is partially a reaction my feelings.
I believe that that providing frequent updates on current and expected weather is a hugely important area for development and that society has much to gain from this direction. For many of us, knowing what is happening and what will happen in the next 6 hrs is hugely important…and has great value for saving property and lives. To be fair, when severe weather is occurring the NWS does do more nowcasting, but I think they need to do so on a more regular basis.
In a day with smartphones, internet-capable cell phones, and computers on the internet everywhere, the ability to deliver real-time weather information exists. New software applications, better computer modeling, and a huge increase in observations will make the information available. We just have to put the package together–and society has much to gain from it.
The nightly weather on the local news is great, but people need weather information all the time…and we have to find a way of delivering it. An idea: every major city could have a nowcasting weather broadcast on the internet, updating the current weather situation every 15 minutes.

Danger Lurks where Weather Statistics Lack

In his new book, Hot Time in the Old Town: The Great Heat Wave of 1896 and the Making of Theodore Roosevelt, Edward P. Kohn tells how New York City’s government generally dithered while casualties mounted. During the heat wave in 1896, an estimated 1,300 people died as 10 straight days of 90-degree-plus heat, high humidity, and no wind baked the crowded working class tenements. Unfortunately, City Hall wasn’t keeping close track of what was happening until too late.
Roosevelt, then president of the city’s Board of Police Commissioners, was an exception. He ordered vendors to supply ice–normally too expensive for ordinary workers–for free.

Roosevelt personally supervised the ice distribution from the police precinct houses, not only “busting” this particular trust, but also having intimate contact with the city’s working poor.  Writing his memoirs years later he would remember the “gasping misery of the little children and of the worn-out mothers.”  Such scenes must have helped shape the man who was about to become the dominant figure of the Progressive era.

Kohn makes a perceptive point that general unawareness compounded the deadliness of the 1896 heat wave and can still exacerbate heat waves today. Even while some of us have begun waking up to the dangers of heat–especially since Chicago in 1995 and the European Summer of 2003– when complete, reliable, and immediate statistics are not available, heat is an underrated, quiet killer, more lethal than most people realize, and usually more lethal than necessary:

Images of forest fires and smoke-choked Moscow filled American televisions, yet the tremendous death toll from the heat wave attracted little attention.  Only in mid-August did the Moscow city government report that the death rate in the city had doubled during the heat wave, resulting in three hundred extra deaths every day.  The Russian heat wave, then, was a historic and catastrophic natural disaster.  But it was underreported and will soon fade from our collective memory.

Now we’re galloping onward with fall, circulation patterns have changed and the summer’s heat has been replaced by other concerns. Reading Kohn’s book is a good way to reflect on the value of keeping good weather impacts statistics.