A Vote for Weatherproof Elections

Predicting–as opposed to actually voting in–elections has become a national past-time, if one is to judge the media’s obsession with who’s going to win what in today’s midterm contests in the United States. And what better way to make predictions than to ponder the weather map?
Tony Wood of the Philadelphia Inquirer, however, disputes the oft-cited connection between weather and election results. In a post last week on “Weather, Democracy, and Mythology“, he looked into the old theory that rain dampens voter turnout and concluded that it doesn’t hold water:

Consider the 2004 presidential election. Recall that it all came down to Ohio in a close race between President Bush and Democratic nominee John Kerry.
That Election Day was a nasty one all over the state. It rained almost everywhere. The result? The voter turnout in Ohio was believed to be highest in at least 40 years. Some folks were said to be waiting up to nine hours to vote.
We did our own analysis of 30 years of election returns and weather in Philadelphia found no evidence of a link between the two. It rained on half of the Election Days with the 10 highest turnouts, while seven of the 10 lowest-turnout days were rain-free.

What about the oft-told story of the 1960 election? In his classic, The Weather Factor, meteorological historian David M. Ludlum claimed that rain in Illinois (on an otherwise mostly fair day across the country) hindered Nixonian rural voters more than Kennedy liberals in Chicago? Wood counters with political analyst Terry Madonna of Franklin & Marshall University, who says weather took a back seat to the behind-the-scenes intervention of Mayor Richard Daley:

“It [the rain] didn’t matter,” said Madonna, “because Daley had those votes already counted.”

We’re not sure how that explanation is logical (given that Ludlum’s theory is more about the lack of rural voters than about any surge in urban voters), but more specifically it would be great to see more of Wood’s 30-year study. In the meantime, the one recent study, by political scientist Brad Gomez and colleagues, quantifies a correlation between weather and voter turnout. The paper, published in 2007 by the Journal of Politics, was discussed at the 2008 AMS Broadcast Meteorology conference (audiovisual version here) by Allan Eustis.
Gomez et al. found that every inch of rain above normal correlates significantly 1% reduction in voter turnout. Similarly, every inch of snow correlates significantly to a 0.5% drop in voter turnout.
Eustis pointed out some limitations in this seemingly exhaustive study involving 22,000 weather observations (to resolve weather effects locally) across 14 national presidential elections. For instance, there’s no mention of extreme temperatures or windy weather. Eustis believes extreme weather, not deviations from norms, are more significant in turnout (therefore a linear relationship between precipitation and voting might not be valid).
Cliff Mass of the University of Washington discusses the Gomez paper in his blog and quickly throws a bucket of cold water on the the relevance of those numbers for today’s election, anyway:

Now an inch of rain is quite a bit of precipitation, only occurring during major storms (like Monday in the NW) or in thunderstorm areas.
Furthermore, these results were for presidential elections where people are generally highly engaged and motivated. What about midterm elections like Tuesday’s? If we assume that people would be less excited than for presidential runs would one expect the influence of precipitation to be greater for this election?
And what about the influence of the greater proportion of absentee ballots and of extended balloting times (some places in the U.S. allow voting in the weeks before the election)?

Playing along with the Gomez et al. paper for the moment, however, Mass  predicted (on Sunday) that if Republicans are indeed favored by lower turnout and thus precipitation, the relatively small areas of rain today will have little impact because it will fall areas that are already leaning heavily toward Republicans.
Eustis, however, notes that other studies of weather and elections, unlike Gomez et al., don’t support the adage that Republicans pray for rain (for instance this 1994 paper by Steve Knack of American University).
What Eustis has learned while working for the National Institutes of Standard and Technology, however, is that the weather effects the voting systems, not the voting people: apparently optical scanners can incorrectly process paper ballots, which expand in excessive humidity causing misalignment (see the 2005 SAT scoring controversy).
Ah, for the simple days when gentleman farmers slogged through the mud and rain, got further sloshed with liquor, shouted their preferences to the poll takers, and went home waiting weeks for the results with nary a prognosticating pundit to second-guess them.
…but not THE Bomb

Editor’s note: Having just posted on the record-setting central U.S. bomb below, it’s only fair to hear immediately from the other side (of the continent) about who has the biggest, baddest storms. Only in meteorology do you get both pros and cons in a story about bombs….
by Cliff Mass, Univ. of Washington
reposted from the Cliff Mass Weather Blog
There has been a lot of media attention regarding the storm in the Midwest with claims it was the strongest (lowest pressure) non-tropical storm in U.S history. DON’T BELIEVE IT FOR A MOMENT. This is classic eastern U.S. media myopia….we have had the deepest and most violent storms!
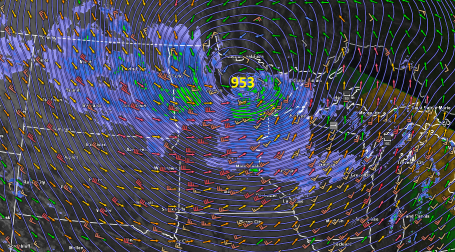
So here is the story. The media is raving about this storm in the Midwest in which the lowest pressure reported was 28.20 inches or 954.8 mb at Bigfork Airport in Minnesota. This is the lowest pressure ever observed in Minnesota! Here is a surface analysis of the storm at its height.
Now this storm has very low pressure but the pressure gradients (pressure changes with distance) are not that impressive and pressure gradient drive winds. Thus, the winds were really not that exceptional.
But we can top that without breaking a sweat. Now take a relatively recent storm around here in the Pacific Northwest: December 12, 1995. During that event the sea level pressure at Buoy 46041 , 52 miles west of Aberdeen, Washington, got to 28.31 inches (958.8 mb) and certainly that did not sample the center of the storm. Since the storm was farther offshore the pressure would to had to have been considerably less. The estimate of local storm uber-expert Wolf Read was the pressure had dropped at least to 953 mb (see track map below).
There are other examples I could cite. The great January 1880 storm was probably much deeper as well and I bet I could find others. And I haven’t even mentioned the Columbus Day Storm of 1962, which clearly was the most powerful extratropical cyclone in U.S. history. Furthermore, our storms generally have larger pressure gradients and thus more extreme winds.
The media is going nuts about a storm that had maximum gusts of 81 mph. Big deal. Our storms regularly have winds over 100 mph and sometimes over 125 mph
If you want to read detailed accounts of major Northwest windstorms, check out the WONDERFUL web pages created by Wolf Read available on the Washington State Climatologist website. Hours of good reading there.
And Bri Dotson and I recently published a paper on our storms.
Now I know how these tricky east-coasters work. They will say that our storms are generally over water during their early lives and don’t count. Don’t let them get away with this. Their fabled “Nor’easters” –which they count–spend plenty of time of water. And don’t forget the Great Lakes! And why did they call one of their storms “The Perfect Storm” when many of ours far outrank it by any mark?

The Bomb

The storm system moving through the Midwest today met the usual criteria–one mb surface pressure drop per hour over 24 hours– for a “bomb”. We usually associate such rapid intensification and deep pressures with storms over the ocean, but this landshark of a storm this morning reached a low pressure stronger than a number of the Atlantic hurricanes this year. Says Paul Douglas in his Minneapolis Star-Tribune blog,

Welcome to the Land of 10,000 Weather Extremes. Yesterday a rapidly intensifying storm, a “bomb”, spun up directly over the MN Arrowhead, around mid afternoon a central pressure of 953 millibars was observed near Orr. That’s 28.14″ of mercury. Bigfork, MN reported 955 mb, about 28.22″ of mercury. The final (official) number may be closer to 28.20-28.22″, but at some point the number becomes academic. What is pretty much certain is that Tuesday’s incredible storm marks a new record for the lowest atmospheric pressure ever observed over the continental USA. That’s a lower air pressure than most hurricanes, which is hard to fathom.

The previous record for Minnesota was 28.43 inches, or 962.6 mb, was set at two stations, Austin and Albert Lea, during the 10 November 1998 storm.
At the Minnesota Climatology Working Group they refer to an even lower pressure over the continent, for the 26 January 1978 Ohio blizzard–28.05 inches. That storm is highlighted in a Monthly Weather Review paper on bombs over the eastern United States by Bruce MacDonald and Elmar Reiter. It deepened 24 mb in only 9 hours!

One blogger made “bomb cyclogenesis” the word of the day:

Sounds very terrorism-cyberpunk, doesn’t it? Sort-of-luckily for the state of Minnesota, it’s actually a meteorological term. I say “sort of” because bomb cyclogenesis will probably work out better for us as a weather phenomenon than it would as a tactic of the android jihad, but it’s still not great.

Douglas, Paul Huttner of Minnesota Public Radio, and others also referred to the storm as a “land hurricane.” The language makes it clear that such storms are not common over the continent.
Indeed bombs are usually a maritime phenomenon. However, not always. Often forgotten in such discussions of rapidly intensifying storms are some of the early parameters set forth in the classic paper by Fred Sanders and John Gyakum in Monthly Weather Review, 1978. In their climatology of “bombs,” they note that these storms are “primarily maritime” but also show significant frequency in the eastern United States–in other words, bombs are not particularly rare over land.
Sanders and Gyakum took the standard of 24 mb drop in 24 hours from Tor Bergeron’s earlier work on rapid intensification. In extending the Norwegian’s work, they noted that an equivalent intensification depends on latitude: at the pole it would be 28 mb/24 hours; at 25 degrees latitude it would be only 12 mb/24 hours. All of these rates qualify for what Sanders and Gyakum called “1 bergeron”. At a latitude of around 45 degrees North, yesterday’s pressure drop needed to be only 19 mb to qualify. (The latitude of Bergeron’s Bergen, Norway is above 60 degrees North.)
Among the many factors that separate ordinary extratropical cyclones from rapidly deepening bombs over land, MacDonald and Reiter noted that both the focus of rising air and surface convergence coincide closely with surface low. There’s also copious heating, including the large-scale latent heat release (condensing moisture) that intensifies as the storm matures. (For more factors, download the paper here.)
Here’s a Storm Prediction Center animation of the storm deepening in “bomb” mode.

Framing the Framers: Updating Science Communication

Some of you may remember a lively panel on the Science of Communication at the 2008 AMS Annual Meeting. It featured a presentation by author Chris Mooney (audiovisual version here) from the trenches of the now full-blown communications quagmire of climate change politics.
Since communication is the overarching theme of the upcoming Annual Meeting in Seattle, it is interesting that a number of climate scientists are trying to shed central tenets of that session, which seemed so cutting-edge two years ago. As a result, judging from some of the scheduled papers, the shape of discussion on communications philosophy in Seattle is going to be quite different than it was three years earlier.
Recall that one of Mooney’s main take-home messages was based on the research of his friend, American University communications professor Matthew Nisbet, on “frames” in communication.
Basically the idea is that information succeeds in becoming memorable, perhaps changing an audience’s thinking, if it is conveyed within an effective “frame.’ Framing can be a story, a useful reference, symbol, or metaphor, a style of delivery (folksy, serious, humorous, self-deprecating, authoritative). Is the science a story of underdogs prevailing? Of frontiers opening? Of prosperity ensuing? Is it scary? Exciting? Weird? Does the science resonate with preexisting perceptions and priorities? Success all depends on knowing your audience and the moment.
In a recent interview, Nisbet says bluntly that the typical frames employed to argue for action on climate mitigation have been ineffective or counterproductive, losing out to competing frames.

If refining frames sounds like it’s more about politics than science to you, then you’re not alone. A number of scientists seem to be growing wary of this focus on framing. The Symposium on Policy and Socio-Economic Research at the upcoming AMS Annual Meeting in Seattle will delve into these frustrations with framing. Speaking directly to the problem of fear-mongering that Nisbet mentions in the interview linked above, Renee Lertzman of Portland State University (4:45 p.m., Tuesday) will discuss how the psychology of anxiety “can evoke complicated, often contradictory emotional and cognitive responses that may hinder or support efforts for effective communications” about the uncertain future. That goes for climate prediction as well as weather forecasting.
The response to poor framing of climate change science has lately turned away from “better” framing. Some climate researchers

Read more

Follow the Water

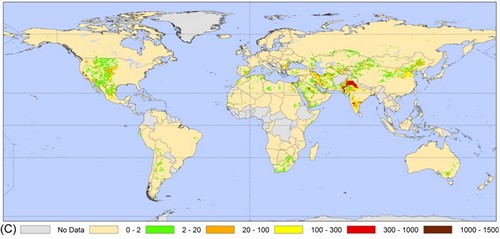
As the world’s population grows, so does water usage. As a result, the rate we pump water out of the ground to satisfy our thirst and, more frequently, the thirst of the plants we grow, has been exceeding the rate that precipitation can replenish that water. From the news page of the International Groundwater Resources Assessment Centre about a study in Geophysical Research Letters:

The results show that the areas of greatest groundwater depletion are in India, Pakistan, the United States and China. Therefore, these are areas where food production and water use are unsustainable and eventually serious problems are expected. The hydrologists estimate that from 1960 to 2000 global groundwater abstraction has increased from 312 to 734 km3 per year and groundwater depletion from 126 to 283 km3 per year.

The gravity of the water situation: relative ground resource depletion rates. Note the prominent depletion in the central United States: Steven Mauget of the US Department of Agriculture will discuss a new software tool for agricultural water management in the Ogallala region (Wednesday, 26 January) at the upcoming AMS Annual Meeting.

Not only does the depletion threaten food supplies in the long run, but it also adds to global level rise. The GRL article quantified this effect, showing that a quarter of the sea level rise since 2000 is due to aquifer depletion. Water that would have stayed underground 50 years ago is now used by people and their plants, then evaporated; eventually most of it finds its way back to the oceans.
As Roger Pielke points out in a recent post, there is much to be learned about the effect of this water on climate. Not all water under the surface of  the Earth is a renewable resource. While some aquifers indeed are readily replenished by recent precipitation, others have been (or were) locked away from ground sources for many years, due to geology. These isolated reserves, called “fossil water,” were formed long before humanity and have yet to be adequately inventoried. Some of them, like the Ogallala aquifer, have been tapped for agriculture. Thus fossil water is being returned to the water cycle (hence, climate) after a long absence.
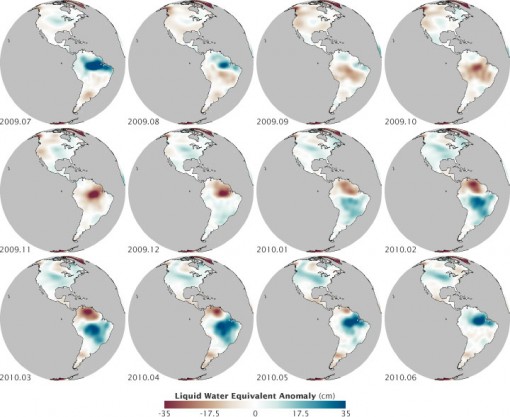
All of this fuss over emptying ground water is a good introduction to the “image of the day” from NASA’s Earth Observatory. Not surprisingly, heavy liquid shifting to and from land has a significant local effect on the gravitational pull of the planet. (Fluctuations of the water table are also hypothesized by some geologists to trigger mid-continental plate earthquakes, but that’s an obscure intersection of geology and meteorology, reviewed in this month’s Bulletin of the Seismological Society of America, to explore in your spare time.) The gravitational effect of water is the basis of water distribution observations from the GRACE (Gravity Recovery and Climate Experiment) mission:

the satellites measured how Earth’s gravity field changed as water piled up or was depleted from different regions at different times of year.

Below is GRACE data from 2009-10 mapped by NASA’s Robert Simmons, showing how the water year giveth (blue) and taketh away (red). (There will be more on watching water resources carefully from space in presentations at the AMS Annual Meeting, including NASA’s David Toll on the NASA Water Resources Program on Tuesday 25 January.)

Michio Yanai, 1934-2010

by Robert Fovell, UCLA, and Wen-Wen Tung, Purdue Univ.

Professor Michio Yanai passed away suddenly at his home in Santa Monica on October 13th, at the age of 76.
A seminal figure in tropical meteorology, Professor Yanai grew up in Chigasaki, Japan. He received a D. Sc. in geophysics at the University of Tokyo in 1961 and was an assistant professor at the same university from 1965-1970 before being appointed to a full professorship at UCLA in 1970.
Professor Yanai published a 1964 review paper on the formation of tropical cyclones that served as the most comprehensive reference on the topic for more than a decade. Much of his groundbreaking work continues to guide research even today, including his observations of the mixed Rossby-gravity wave (also known as the Yanai wave), his systematic approach of estimating apparent heat sources (Q1) and moisture sinks (Q2) and associating them with the bulk properties of convective systems, and his diagnostic studies of the Asian monsoon, in particular his pioneering works on the impacts of the Tibetan Plateau on the Asian Monsoon. In 1986, the American Meteorological Society honored him with the Charney Award. In 1993, he received the Fujiwara Award from the Meteorological Society of Japan. His UCLA Tropical Meteorology and Climate Newsletter has been an invaluable resource to the community since its founding in 1996.
This year, Professor Yanai was selected by the AMS to be honored at a special symposium dedicated to his life and career at the 2011 annual meeting in Seattle (Thursday, 27 January).    Professor Yanai was thrilled by this selection, which certainly helped maintain his passion and energy as his health declined, and was a very enthusiastic contributor as the symposium program took shape.  He was scheduled to deliver the closing remarks at the symposium.
The occasion led Professor Yanai to reminisce not only about his life and career but also about the histories and contributions of his colleagues, especially his fellow meteorologists who emerged from post-war Japan.   He also recently embarked on a project to document the evolution of the Atmospheric and Oceanic Sciences program at UCLA, which was still called the Department of Meteorology when he joined in 1970.  Professor Yanai was in the midst of collecting oral histories of the department from past and present members of the UCLA family when he passed away. The last UCLA Tropical Meteorology and Climate Newsletter was issued on October 8th.
Although we will greatly miss his presence at the Michio Yanai Symposium, we know he will be there in spirit when we gather to honor his accomplishments, his legacy and his memory.  No one who is so fondly remembered can ever truly be lost.
Professor Yanai is survived by his wife, Yoko; two sons, Takashi and Satoshi; four grandchildren, and a sibling, Tetsuo Yanai of Japan. The family requests that memorial donations may be made to the Professor Emeritus Michio Yanai Memorial Fund in Atmospheric and Oceanic Sciences at UCLA. E-mail Dawn M. Zelmanowitz ([email protected]) for information. Readers are also encouraged to share their memories of Professor Yanai in the comments to this blog post.

Warren Washington Honored by President Obama

UCAR photo by Carlye Calvin.

AMS Past President Warren Washington, a leader in the development of climate modeling, was one of the ten winners of the National Medal of Science announced Friday by President Obama at the White House. Since 1959 this has been the highest honor bestowed by the nation to its scientists, and very few in the atmospheric, oceanographic, and related sciences have been among the recipients–including Jacob Bjerknes, Roger Revelle, Susan Solomon, Helmut Landsberg, Henry Stommel, Charles Keeling, Verner Suomi, and Wallace Broecker.
In a statement issued by the National Center for Atmospheric Research, where he has worked since 1963, Washington says:

I am very pleased to receive this honor, which recognizes not only my work but that of my many colleagues whom I’ve had the pleasure of working with for more than 45 years. Akira Kasahara and Jerry Meehl, at NCAR, contributed significantly to the development of computer climate models, and support from NSF and the Department of Energy enabled us to make research advancements that I hope will contribute to mankind’s ability to sustain this planet.

President Obama remarked today:

The extraordinary accomplishments of these scientists, engineers, and inventors are a testament to American industry and ingenuity….Their achievements have redrawn the frontiers of human knowledge while enhancing American prosperity, and it is my tremendous pleasure to honor them for their important contributions.

Another AMS Past President, Bob Ryan, wrote on his blog,

Warren has been and continues as one of the world’s leading climate researchers of the 20th and now 21st centuries. His contributions to meteorology, science, public understanding, education and opportunity and service to his science are immense. Warren is one of those people whom we cross paths with personally, professionally or both, whom we know have enriched our lives. Someone you look forward to seeing again . . . and again.  That’s a Warren Washington.

Adds Roger Wakimoto, the director of NCAR:

His scientific leadership, innate diplomacy, as well as the mentorship to future generations of scientists have deeply and profoundly impacted our field.

The Meteorology of the Chilean Mine Rescue

by Cliff Mass, Univ. of Washington; reposted from Cliff Mass Weather Blog

Now that all of the miners are safe, it is interesting to think about some of the meteorological aspects of the disaster–and of the misinformation provided by the media.
Some of the media suggested that the miners could get the bends from “rapid decompression”, but this is nonsense!
The level of the mine entrance, where the drilling is taking place, is at roughly 2400 ft above sea level, and the miners were trapped at a level a few hundred ft above sea level. Clearly, the pressure was higher where the miners were–roughly 8 % higher. And it took them about 15 minutes to make the change as they were lifted out. This is nothing to worry about! Virtually all of you experience this change many times each year. An example: drive to Snoqualmie Pass (elevation roughly 3200 ft) from the west. The last fifteen minutes you gain roughly the same elevation in the same amount of time! Or when you take off in a plane, take a long lift ride while skiing, take that gondola ascent on vacation, etc., you experience the same or worse!
Then there was the “steam” coming out of the hole (click on picture to see video):

Why the cloud coming out of the hole? The temperature down in the mine was very warm (90-105 from various reports) and there were sources of moisture down there. The air had sufficient water content that when it hit the cool nighttime air, it was cooled to saturation–thus the fog. It looked to me that temperatures were fairly cold during the evening rescues—40s F perhaps from the jackets people were wearing. A small contribution could also have come from the expansion cooling of the air as it rose.
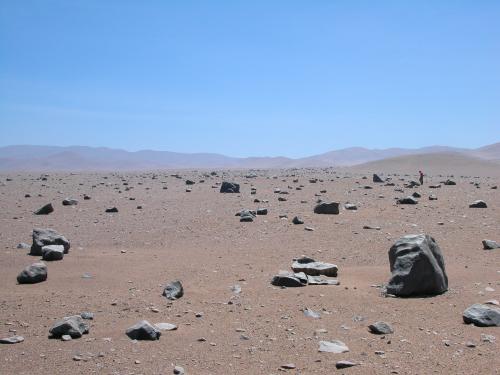
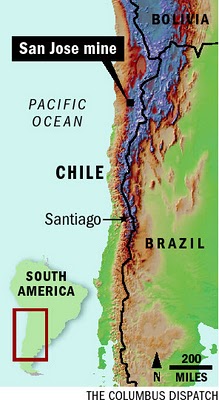
The region surrounding the mine is very, very dry–in fact one of the driest places on earth…the Atacama Desert (see map). Some locations have never observed rain, and in others they receive perhaps a few hundredths of an inch per year. Why so dry? Sinking air from a subtropical high, the high Andes preventing moisture from moving from the east,

Mars or the Atacama?

and the coastal mountains preventing moisture movement from the west. Plus an inversion aloft that stops the air from moving over the coastal mountains.

And talking of media issues…which country is wrong in the map at left?
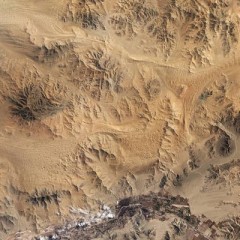
The mine site from space.

The Storm That Started a Drought?

by Robert V. Sobczak, National Park Service, Big Cypress National Preserve.
Reposted from his blog, The South Florida Watershed Journal.
Do all storms end with drought?
I know you’re thinking. I mean the opposite instead:
That “all droughts end with a flood,” right?

Deer Creek
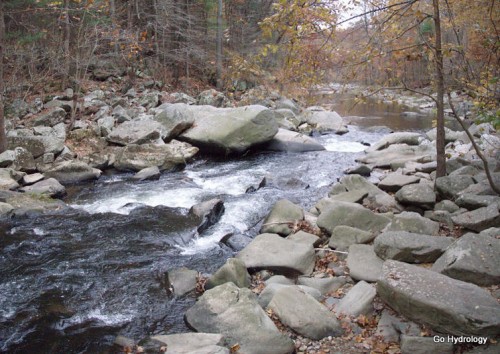
Deer Creek, Maryland at low-water autumn ebb.

A meteorologist in the snow-bound climes of the Red River Basin introduced me to the latter saying. To what degree it holds any statistical truth I cannot say. My initial gut reaction was that an observational bias was in play, plus some seasonal slight of hand. But no matter how much I tried to deny it, the saying kept sneaking up on me wherever I roamed.
Take Tropical Depression Nicole for example. It threatened to make our already high-water rendition of the Big Cypress Swamp all the more wetter but by the flap of the wings of the butterfly bypassed to the east and then onward north to the Atlantic Coast where it drenched those watersheds instead.
Now here’s the catch:
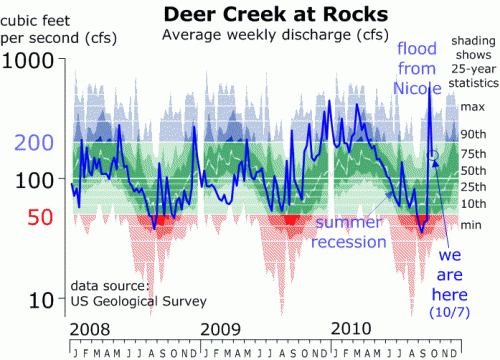
Those watersheds were at the end of their seasonal drought, better known as the summer recession, transforming currents from trickles into torrents overnight.
So yes, chalk one on the board for that old reliable saying!

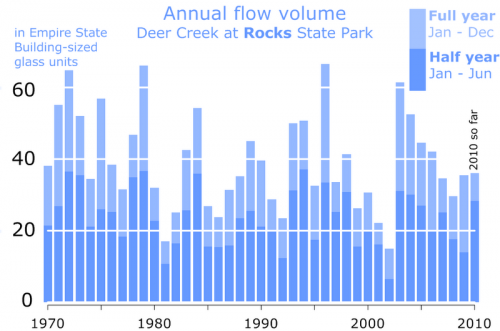
Case in point is Maryland’s Deer Creek, as measured at Rocks State Park (or just “Rocks” as us Harford Countians call it). Thanks to Nicole it now has a chance to top 40 Empire State Buildings (ESBs) worth of water flow for the year. That would make it an above average year, but not a “chart topper,” a term I reserve for the biggest of big flow years which pass 60 or more ESBs worth of water. That’s happened just four times in the modern era (aka my lifetime), the most recent of which (2003) which was, as predicted by that old reliable saying, preceded by the drought of record in 2002 when less than 20 ESBs worth of water flowed through Maryland’s famed Rocks State Park for the year.
Ha, there it is again! So, cherry picking not withstanding, I guess that means that, yes, all drought do seem to end with floods.

Does the same saying apply to the Florida swamps?
Seasonally it happens each year with our winter dry season. By spring the swamps are nearly 100 percent water free and crunchy, just a single lightning strike away from an uncontrollable blaze. But along with the lighting are the thunder that beckon the wet season’s arrival … and the floods that will soon be to follow.
Which brings me back to Nicole:
Instead of flushing flood waters even higher into the swamp it paradoxically reversed the tables by ushering in a week’s worth of dry air in its wake instead.
Meteorologists are calling it an early start to the dry season.

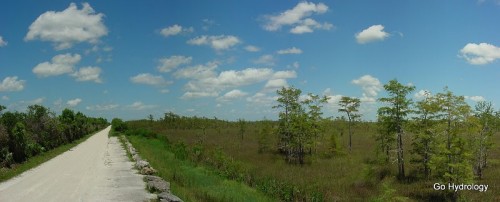
Loop Road near Gator Hook Strand at the wet-season peak.

Or in other words…
Call it the storm that started the drought!

Scientists 4.0

by William Hooke, AMS Policy Program Director. From the AMS project, Living on the Real World

In the competitive world of computer software, smartphones, and other technology and devices, it’s all about version. Internet 1.0? Soooooooooo yesterday. Web 2.0 caused a big stir a few years ago. Web 3.0 already beckons. We’re now working on Windows 7 No, wait! It’s Windows 8! And yesterday’s 3G smartphone network is giving way to 4G. We’re constantly moving on.
Scientists periodically undergo similar upgrades, but with little or no fanfare. Let’s start to correct this….I’m a scientist version 3.0, but if you’re a scientist and reading this, chances are good you’re a scientist version 4.0.
Got your attention? Let’s peel this onion:
Scientist version 1.0 This generation comprises greats such as Empedocles (ca. 490-ca.430 BC), Aristotle (384-322 BC), Hippocrates (ca.460-ca.370BC), Galen (129-217[?]AD), and others. These men didn’t think of themselves as scientists. Instead, they saw themselves as philosophers, as thinkers. And the scientific method, the rules for thinking which we regard as commonplace today – based on evidence, logic, and rigor; developing testable hypotheses, subject to proof or disproof by experiment – were either under construction or lay still ahead. Peer review? Out of the question. It was therefore possible for Empedocles to suggest that all matter was composed of a blend of four basic elements – earth, water, air, and fire. Aristotle could assert that porcupines shoot their quills. Hippocrates could intuit a link between the environment and health even though at a loss to explain just why. Galen might decide (versus, say, determine) that the function of the heart was to heat the body. All of these notions were flawed at best, or failed to survive subsequent scrutiny. However each, even the theories about disease, contained (ahem!) a germ of truth. Each helped burnish the reputation of these men as among the foremost intellectuals of their time. They got us started down the road to the science of today. They will always remain giants.
Remember, as we’ve discussed in previous posts, that the pace of progress and social change was once much slower than it is today. So this state of affairs persisted for maybe 2000 years. Then along came
Scientist version 2.0 Just to make things concrete, suppose we name Galileo (1564-1642) and Newton (1643-1727) two of the first of this new breed. Their contributions? To elevate the idea of controlled experimental tests, quantitative measurement, meticulous observation – and to inject a little mathematics. They may have thought of science as an activity, but still thought of themselves more as natural philosophers. The term scientist probably didn’t come into widespread use until later in this period, the 19th century, say. Science was still seen less in terms of career or profession and more in terms of avocation. As we pointed out in an earlier post, even as recently as Darwin, scientists were either independently wealthy or forced to cobble together funding and resources for their work. These folks succeeded in picking up the pace of innovation quite a bit. Version 2.0 prevailed for a little more than 300 years.
Scientist version 3.0 This pretty much covers every scientist alive today who’s been out of graduate school for at least 5-10 years. The version was launched during and immediately following World War II, per yesterday’s post. Thanks to Vannevar Bush, scientists-version-3.0 have operated under the most unusual social contract ever envisioned, let alone implemented, by the mind of man: “Give us lots of money, and stand back – and someday you’ll be glad you did.”
What’s even more amazing is that scientists-version-3.0 have provided an extraordinary return on this investment. Society got a bargain! This scientist-upgrade provided

Read more