It was predicted early and often—and now, finally, it’s official. Throughout 2015, climate-watchers at NOAA and NASA were giving indications that the world’s surface temperature was going to top every annual mean measured since records began in 1880. Today, the two agencies with independent analyses jointly confirmed that global surface temperatures in 2015 blew away the record set in 2014.
The mean global temperature in the analysis by NASA’s Goddard Institute for Space Studies was 0.13°C above the 2014 record, and NOAA’s National Centers for Environmental Information had it as 0.16°C above. In all, according to NCEI, 2015 was 0.90°C above the 20th-century average.
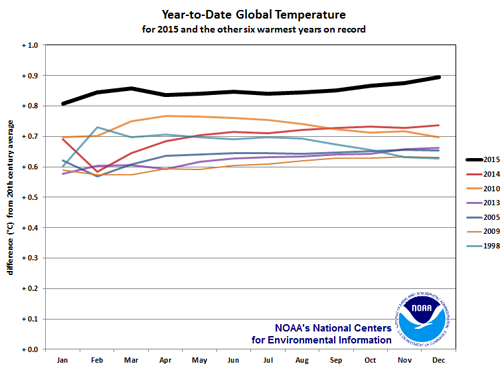
The temperature record was no surprise, even though 2015 set a new record by the largest margin ever recorded. In the horse race of annual temperatures, 2015 jumped out of the gate ahead of the pack and never looked back at previous record holders like 1997, 2005, and 2014 (see the NOAA graphic below). It was a wire-to-wire victory in which 10 of 12 months were the hottest ever on record for their respective periods. Indeed, going into the homestretch, NCEI pointed out that December 2015 would have to stumble to more than 0.81°C below average to avoid setting a record. Instead, December extended the year’s lead by registering 1.11°C above the 1880-2015 century average—in other words, it was the hottest month in the century-plus of measurement history.
Inevitably, the question arises: does this record conflict with the notion of a “hiatus,” which the IPCC addressed in its Fifth Assessment Report in 2013? Trend aside, 15 of the 16 hottest years on record have occurred in this still-young 21st century, according to NASA; NOAA says four different years in that brief period have now reset the global surface temperature record.
Not surprisingly, a decade or so is a mere blip in climatology terms, and the short-term trend of global warming depends on where you mark the start and end point of your analysis. The warming has been relatively fast since 1970—about 0.16 or 0.17°C per decade, depending on your dataset. If you just look at only 1998-2012, as IPCC did, during sustained warmth near record levels, the upward trend is half what it is over the longer period. Of course, starting with 1998 means starting out very warm—hence a trend with major handicapping.
As a result, there’s been scientific backlash against use of the term “hiatus.” As Stephan Lewandowsky, James Risbey, and Naomi Oreskes point out in a newly released article in BAMS, the word doesn’t fit:
The meaning of the terms “pause” and “hiatus” implies that the normal fluctuations in warming rate have been surpassed such that warming has stopped.
They show that warming looks slower or faster depending on the start date of any given 15-year period, but that none of the slowest-warming periods, including the last 15 years, is any slower than one might expect in a warming climate post-1970 (or indeed less remarkable with longer periods one might choose). They conclude,
The “pause” is not unusual or extraordinary relative to other fluctuations and it does not stand out in any meaningful statistical sense.
Lewandowsky and colleagues go on to show that, objectively, “hiatus” doesn’t pass the eye test. When tested by looking at a curve resembling the global temperature curve, experts and nonexperts alike perceived a long-term, uninterrupted upward trend. The authors conclude that misuse of the word “hiatus” distorts how the data look, and thus impedes not only public perception of global warming but also scientific work.
One benefit of the “hiatus” talk is that scientists have been motivated to ask more questions about the normal short-term fluctuations of climate. One purpose of the Community Earth System Model’s Large Ensemble Project, for example, is to produce large numbers of climate model simulations to help “disentangle” model error from internal climate variability—that is, the fluctuations caused by climate irrespective of anthropogenic forcing.
In an article in the August issue of BAMS, the ensemble project’s investigators show a sample experiment in which the slower warming of the last 15 years has actually been a pace well within normal variability, with or without greenhouse gas forcing (see figure below).
As the world continues to warm, this year’s record is prone to fall. Meanwhile, the ensemble also shows that the odds of a 10- or 20-year fluctuation stopping the warming—let alone a brief cooling—keeps getting tinier and tinier.