Perhaps no one thought that Game 5 of the World Series would end the way it did. It started with two of the game’s best pitchers facing off; a low-scoring duel seemed likely. But the hitters gained the upper hand. In the extra-inning slugfest the score climbed to 13-12.
If you started that game thinking every at-bat was a potential strike-out, and ended the game thinking every at-bat was a potential home run, then you’ll understand the findings about human expectations demonstrated in a new study in the AMS journal, Weather, Climate and Society. University of Washington researchers Margaret Grounds, Jared LeClerc, and Susan Joslyn shed light on the way our shifting expectations of flood frequency are based on recent events.
There are two common ways to quantify the likelihood of flooding. One is to give a “return period,” which tells (usually in years) how often a flood (or a greater magnitude flood) occurs in the historical record. It is an “average recurrence interval,” not a consistent pattern. The University of Washington authors note that a return period “almost invites this misinterpretation.” Too many people believe a 10-year return period means flooding happens on schedule, every 10 years, or that in every 10-year period, there will be one flood that meets or exceeds that water level.
Grounds et al. write:
This misinterpretation may create what we refer to as a ‘‘flood is due’’ effect. People may think that floods are more likely if a flood has not occurred in a span of time approaching the return period. Conversely, if a flood of that magnitude has just occurred, people may think the likelihood of another similar flood is less than what is intended by the expression.
In reality, floods that great can happen more frequently, or less frequently, over a short set of return periods. But in the long haul, the average time between floods of that magnitude or greater will be 10 years.
One might think the second common method of communicating about floods corrects for this problem. That is to give something like a batting average–a statistical probability that a flood exceeding a named threshold will occur in any given time period (usually a year). Based on the same numbers as a return period, this statistic helps convey the idea that, in any given year, a flood “might” occur. A 100-year return period would look like a 1% chance of a flood in any given year.
Grounds and her colleagues, however, found that people have variable expectations due to recent experience, despite the numbers. The “flood is due” effect is remarkably resilient.
The researchers surveyed 243 college students. Each student was shown just one of the three panels below of flood information for a hypothetical creek in the American West:
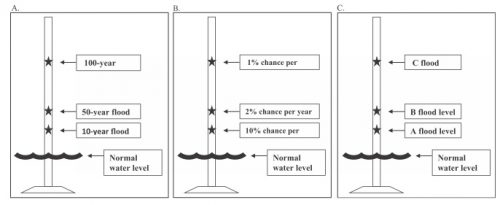
Each panel showed a different method of labeling flooding (panel A showed return periods; panel B percent chance of flooding; panel C had no quantification, marking levels A-B-C). The group for each panel was further subdivided into two subgroups: one subgroup was told a flood at the 10-year (or 10% or “A”) marker had occurred last year; the other subgroup was told such a flood last occurred 10 years ago. This fact affected the students’ assessment of the relative likelihood of another flood soon (they marked these assessments proportionally, on an unlabeled number line, which the researchers translated into probabilities).
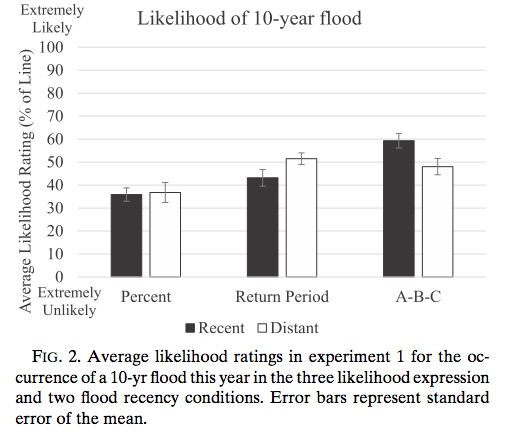
Notice, the group on the right, who did not deal with quantified risks (merely A-B-C), assessed a higher imminent threat if a flood had occurred last year. This “persistence” effect is as if a home run last inning made another home run seem more likely this inning. The opposite, “flood due” effect, appeared as expected for the group evaluating return period statistics. Participants dealing with percentage chances of floods were least prone to either effect.
This test gave participants a visualization, and also did not quantify water levels. Researchers realized both conditions might have thrown them a curve ball, skewing results, so the researchers tried another survey with 803 people (gathered through Amazon.com) to control test conditions. The same pattern emerged: an even bigger flood-is-due effect in the group evaluating return-period, a bigger persistence effect in the group with unquantified risks, and neither bias in the group assessing percentage risks.
In general, that A-B-C (“unquantified”) group again showed the highest estimation of flood risk. The group with percentage risk information showed the least overestimation of risk, but still tended to exaggerate this risk on the scales they marked.
Throughout the tests, the researchers had subjects rank their concern for the hypothetical flood-prone residents because flood communication stops not at understanding, but at concern that motivates a response. Grounds et al. conclude:
Although percent chance is often thought to be a confusing form of likelihood expression…the evidence reported here suggests that this format conveys the intended likelihood information, without a significant loss in concern, better than the return period or omitting likelihood information altogether.
How concerned these participants felt watching the flood of hits in the World Series…well, that depended on which team they were rooting for.